ISSN 1479-4403 136 ©ACPIL Reference this paper: Karkar, A. J. M., Fatlawi, H. K., and Al-Jobouri, A. A., 2020. Highlighting E-learning Adoption
Techniques: University of Kufa as a Case Study
Ammar J. M. Karkar, Hayder K. Fatlawi and Ahmed A. Al-Jobouri
University of Kufa, Najaf, Iraq
[email protected]
[email protected]
[email protected]
DOI: 10.34190/EJEL.20.18.2.003Abstract: Electronic learning (e-learning) plays a significant role in improving the efficiency of the education process. However, in many cases in developing countries, technology transfer without consideration of technology acceptance factors has limited the impact of e-learning and the expected outcome of the education process. Therefore, this shift in learning method has been met with low enthusiasm from academic staff and students owing to its low perceived usefulness and perceived ease-of-use. The University of Kufa (UoK) in Iraq is considered a good case study because it has implemented the e-learning platform since 2013. The UoK platform is based on open-source Moodle owing to the latter’s advantages, such as low implementation cost, open community for support and continuous update and development. To identify and evaluate the challenges, this study uses a questionnaire survey that targets the level of adoption, implementation, familiarity and technology acceptance of staff and students. A total of 242 educators participate in the survey, and the data are subsequently analysed. Important information is extracted using data mining techniques, namely clustering and decision trees. One of the main crucial factors extracted from the analysis results is the perception that social media is easier to use compared with a dedicated e-learning platform such as Moodle. This factor may also discourage educators/learners from adopting an offered e-learning platform, regardless of actual usefulness, motivation and training programs. Therefore, this paper offers practical information regarding the main issues and a guideline to fully utilise e-learning for policy makers and e-learning developers, particularly in newly established institutions or developing countries.
Keywords: e-learning, technology acceptance model, Educational data mining, Moodle, social media, Facebook, clustering, decision trees
1.
Introduction
Some educators have considered electronic learning (e-learning) as the most remarkable leap in the education process since the invention of writing (Tan, Chew and Mellor, 2016). This set of education means is believed to be the newest method of passing knowledge and expertise as a supplement and/or replacement to traditional classrooms owing to their flexibility and efficiency. Moreover, the need and importance of e-learning have grown because the education process and outcome expectancies have changed. For instance, modern institutions have realised that education is no longer the memorisation of knowledge but rather the ability to solve problems with novelty, developing independent and long-life learning and communication skills (Atanda and Ahlan, 2014). Traditional classes, which are limited by space and time, can also no longer satisfy the growing demands for knowledge. This entire set of new requirements has driven the development of e-learning tools.
E-learning has been a standard technique of education in developed countries for many years (Koponen, Tedre and Vesisenaho, 2011; Tan, Chew and Mellor, 2016). However, developing countries continue to struggle in reaping the benefit of such techniques (Atanda and Ahlan, 2014; Ansong, Boateng and Boateng, 2017; Canedo, Santos and Leite, 2018). This situation may be due to numerous reasons, such as lack of technical infrastructure, service availability, staff readiness and experts to build and manage such infrastructure, which has been the case for e-learning in many institutions including those in Iraq (Mahmod et al., 2017). However, the infrastructure or technology may not be sufficient for learners and educators to fully adopt e-learning and accept e-learning technology, thus remaining a major concern in many developing and developed countries (Kanwal and Rehman, 2017; Ansong, Boateng and Boateng, 2017; Haron and Sahar, 2010; Almazroi et al., 2016; Cidral et al., 2017). Therefore, determining the factors that play a crucial role in e-learning adoption and technology acceptance is an active research area. Student motivation, perceived usefulness, perceived ease of use, policy making and the method to break traditional outdated concepts of the education process or its expected outcomes are factors that may need to be tackled on different levels. Thus, experts are in dire need
for crucial information to redirect resources by identifying the main challenges/factors and their impact on the education process and determining how these factors are connected to one other.
Educational data mining techniques have been introduced to answer these questions and visualise, analyse and/or extract useful and accurate information from the extensive data of education (Romero and Ventura, 2010; Castro et al., 2007; Yang and Li, 2018). Moreover, numerous studies have employed questionnaires to evaluate e-learning utilisation or usefulness (Ansong, Boateng and Boateng, 2017; Kanwal and Rehman, 2017; Almazroi et al., 2016; Mahmod et al., 2017; Kalelioğlu, 2017; Canedo, Santos and Leite, 2018). However, these studies either seem to focus on one factor that leads to the underutilisation of e-learning or require further study to confirm their findings and/or discover new factors given the different educational environment.
This paper mainly aims to offer insights into the main factors and challenges that influence the full adoption of a dedicated learning management system (LMS), which is Moodle in this case study. In particular, the study investigates the effect of perceived usefulness and ease of use of social media in education compared with those of Moodle. To analyse the educators’ responses to the questionnaire survey, which is conducted in the University of Kufa (UoK), accomplished data mining techniques are used. The UoK is considered a good case study for the status of e-learning adoption in Iraq and developing countries as well as institutions that suffer from the underutilisation of e-learning worldwide. This selection is due to the fact that e-learning, as a supplemental means to traditional classrooms, has been established in this university for over five years. The e-learning system is designed to have separate e-learning platforms for each faculty. There are 22 UoK faculties that comprise more than 40,000 unique users (staff/student) and 3,800 online blended courses. This number of users makes the UoK case study optimum for the early stages of e-learning implementation. This study’s main contributions are as follows:
Measuring the status and the challenges currently faced by e-learning through designing and conducting a questionnaire for academic members
Hypnotizing and investigating a new technology acceptance model
Using data analysis techniques, such as clustering and decision tree, to analyse, highlight and discuss the role of each factor that causes low e-learning adoption
Proposing possible solutions for researchers, policy makers and/or e-learning platform developers to address the identified main challenges
The rest of the paper is organised as follows. Section II reviews the background theory and related work. Section III presents the background and current status of the UoK e-learning platform in detail. Section IV describes the designed questionnaire and highlights its main results. Section V presents the use of data mining techniques to analyse and discuss results. Section VI discusses the main challenges and suggested solutions. Section VII drafts conclusions and suggestions for possible future work.
2.
Background and Related work
2.1
Technology acceptance
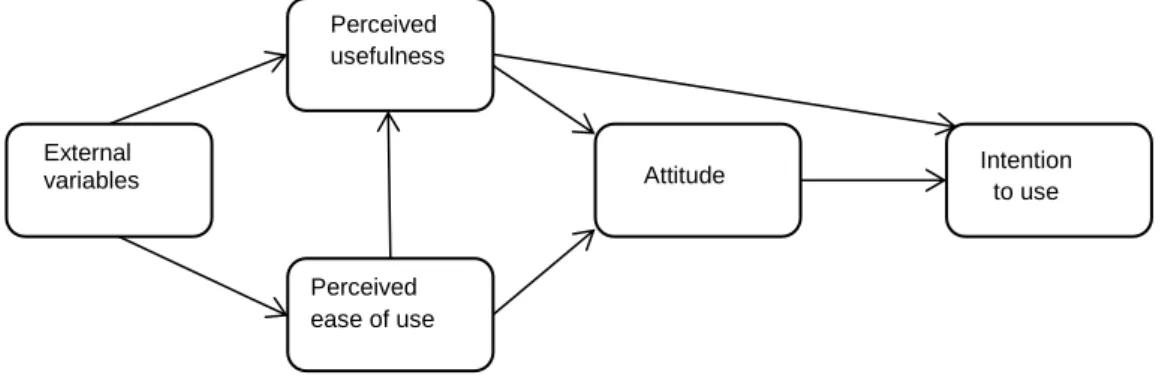
Technology acceptance model (TAM) is a well-established model that links personal beliefs regarding a technology with its usage. Figure 1 illustrates the TAM (Fishbein and Ajzen, 1975). This model posits that the determining factors for technology acceptance or adoption include perceived usefulness, perceived ease of use and/or other external factors. In e-learning, perceived usefulness refers to the technology user’s (educator/student) evaluation of the level of their performance improvement if they use the technology. For an educator/student, this improvement includes reducing the required effort for the education process that yields to an enhanced positive outcome. The educator’s and the student’s perceived ease of use of e-learning will depend on their level of personal technology background and training.
Numerous studies in literature have been dedicated to evaluating either a partial or full aspect of this model. Table 1 shows a list of these studies that explain or predict e-learning acceptance through the relationship amongst TAM factors. For instance, regarding the relationship between external factors and attitude, Baturay, Gökçearslan and Sahin (2017) show that the educator’s attitudes regarding use of e-learning may vary based on the environment, atmosphere and culture. Dudaitė and Prakapas (2017) investigate the merits of an e-exam system by analysing students’ questionnaires and find that these merits include helping them remain attentive, active and curious. A fair number of these studies have likewise focused on Moodle’s perceived usefulness and/or other factors that impact the students’ intention to use the e-learning material. For
example, Marikar and Jayarathne (2016) show that 61% of sampled students in a Sri Lankan university improved their results. Furthermore, Costa, Alvelos and Teixeira (2012) reveal that most students perceive that Moodle is good for downloading materials, delivering assignments and checking course news.
Figure 1: Technology acceptance model (TAM) (Fishbein and Ajzen, 1975)
On other hand, Sánchez and Hueros (2010) investigate an adjusted hypothesis of TAM by analysing students’ questionnaires and find that technical support is directly linked with perceived usefulness and perceived ease of use. This finding translates into high usage by improving students’ attitude regarding Moodle. Uziak et al., (2018) also reveal that a correlation exists between students’ attitude and use of blackboard in presenting the materials and features of the offered courses.
Ansong, Boateng and Boateng (2017) explore technology organisation environment (TOE) factors that affect e-learning adoption in Ghana. By analysing the responses of 417 educators/students, they highlight a number of factors that impact adoption, including IT infrastructure, perceived ease of use, expected benefits, organisational compatibility and competitive pressure.
Kalelioğlu (2017) and Petrovic et al. (2013) try to investigate a social media website, namely Facebook, as a learning management system. They conclude that Facebook exhibits high technology acceptance because the perceived ease of use and usefulness of social network websites amongst young students may overcome any merits offered by other e-learning tools.
Table 1: Questionnaire studies explaining and/or predicting e-learning technology acceptance levels
The study Aim Sample size Targeted Tool
Baturay, Gökçearslan and Sahin (2017)
External factor,
Attitude 280 teachers
Computer-Assisted Education and TPAK
Kalelioğlu (2017) Acceptance based on
perceived usefulness 18 students Facebook
Dudaitė and Prakapas (2017) perceived usefulness 60 teachers Interactive Evaluation System Marikar and Jayarathne (2016) perceived usefulness 31 students Moodle
Costa, Alvelos and Teixeira
(2012) perceived usefulness 278 students Moodle
Petrovic, et al. (2013) perceived usefulness 30 students Moodle and Facebook Sánchez and Hueros (2010) TAM model 226 students Moodle
Ansong, Boateng and Boateng (2017)
The Technology Organization Environment (TOE) framework
417 student/ educator
Ghana university e-learning system
Uziak, et al., (2018) acceptance of
e-learning 275 students Blackboard
2.2
Educational data mining
Data mining techniques have been effectively utilised in e-learning applications for behaviour analysis amongst learners or in predicting e-learning process outcomes (Calders and Pechenizkiy, 2012; Castro et al., 2007; Romero and Ventura, 2010; Hanna, 2004; Kaur, Singh and Josan, 2015; Yang and Li, 2018). For instance,
External variables
Perceived usefulness
Perceived ease of use
Attitude Intention
classification and clustering algorithms are used to perform those tasks based on collected data from access operations, assignments, exams, voting and/or survey.
Decision tree is an effective and easy to comprehend classification technique that uses recursive binary splitting to build a predictive or descriptive model (Han, Pei and Kamber, 2011; Tan, Steinbach and Kumar, 2005). Despite the decision tree’s benefits, its size can dramatically increase, thereby causing overfitting problem. Pruning certain parts of the decision tree can overcome overfitting without affecting the accuracy of the classification technique (De Ville, 2006; Tufféry, 2011). Therefore, the present study adopts the reduced error pruning tree (REPTree) because this method utilises the pruning concept to produce a simple and accurate decision tree.
Clustering methods can be categorised into three main types: partitioning, hierarchical and density based (Han, Pei and Kamber, 2011; Tan, 2007). K-means is a partitioning method that produces K partitions, each of which is considered a cluster. This method starts with an initial partitioning and is subsequently applied with an iterative procedure to enhance the partitioning by relocating the objects’ position from one partition to another. K-means has exhibited high goodness, given that objects in a cluster are closer than those in multiple clusters, whereas objects in multiple clusters are farther from one another (Han, Pei and Kamber, 2011). Moreover, from a computational view, k-means can be faster than hierarchical clustering when a dataset has a large number of features. Therefore, k-means clustering and REPTree classification are used in the present study to analyse survey responses gathered from the academic faculty members of the UoK, see section V.
2.3
University of Kufa Platform for E-learning
The UoK was founded in 1987. This public institution is funded by the Ministry of Higher Education in Iraq and has expanded to 22 faculties, including engineering, science, medical, dental, education, linguistic, nursing, business and arts, since its establishment. These faculties are distributed over seven campuses located in the cities of Kufa and Najaf south of Iraq (University of Kufa, 2018). With the exception of its night courses, all undergraduate and postgraduate courses in UoK are free.
The UoK LMS was established in 2013 with the support from UNESCO in Iraq (Anon., 2010). Since then, the faculty members and students have been offered training (at least two workshops for educators and one workshop for students per year per faculty). The training for the faculty members aims to help them design their own e-courses, highlights the benefits of e-learning services and enables them to use the LMS to supplement their classroom activities, also known as blended courses (Nortvig, Petersen and Balle., 2018). Furthermore, each new faculty member must undergo intensive training courses in pedagogy that include utilising e-learning skills to improve education process efficiency and outcome. However, limited infrastructures are available to record lectures inside/outside class. For instance, only two studios are available in the whole university to video record lectures. In terms of technical support, at least one e-learning site manager is available per faculty who also acts as technical support.
The online ecosystem of the university includes separate e-library, website and registration systems. However, the LMS export users’ data from the registration system. Although the in-campus Internet service is available only to faculty members, the LMS is openly accessible for students through the campus network and in their homes through the internet.
This LMS is open-source-based, with advantages such as low implementation cost, open community for support and continuous update and development. This platform includes Linux operating system, LAMP (Linux, Apache, MySQL, PHP PERL and PYTHON), Moodle, performance and theme plugin. Firstly, Linux is a Unix-like operating system that is considered the most popular open-source operating system. Its availability and continuous updates motivate the technical community to adopt it for their platform. Ubuntu is one of the most widespread Linux distributions for the server environment. Thus, an Ubuntu server has been utilised to operate and manage the web server of the e-leaning system.
Secondly, the LAMP platform contains the requirements to implement a web server’s services, including virtual hosting and database managements. Thirdly, Moodle, the core of our platform is a popular and widely adopted learning management system (Quesada et al., 2013; Moodle statistics, 2018). This system is an e-learning platform developed to provide students, teachers and administrators with a secure and integrated system.
Figure 2 shows that the utilisation of this platform is continuously growing. However, the UoK still has not reached the point of full adoption of e-learning techniques. This study attempts to define the challenges faced by the full utilisation of this platform by analysing the experience of its users, who are the academic members.
Figure 2: The level of growth in utilizing the University of Kufa platform for e-learning. (Resources: lectures handout, books, videos, website; users: a unique faculty member or student; questions: a unique question in a question bank or an exam; course: unique active courses that are blended (supplementary for classrooms) that is offered to undergraduate/postgraduate students in the entire 22 faculties in University of the Kufa)
3.
Hypothesized Acceptance Model
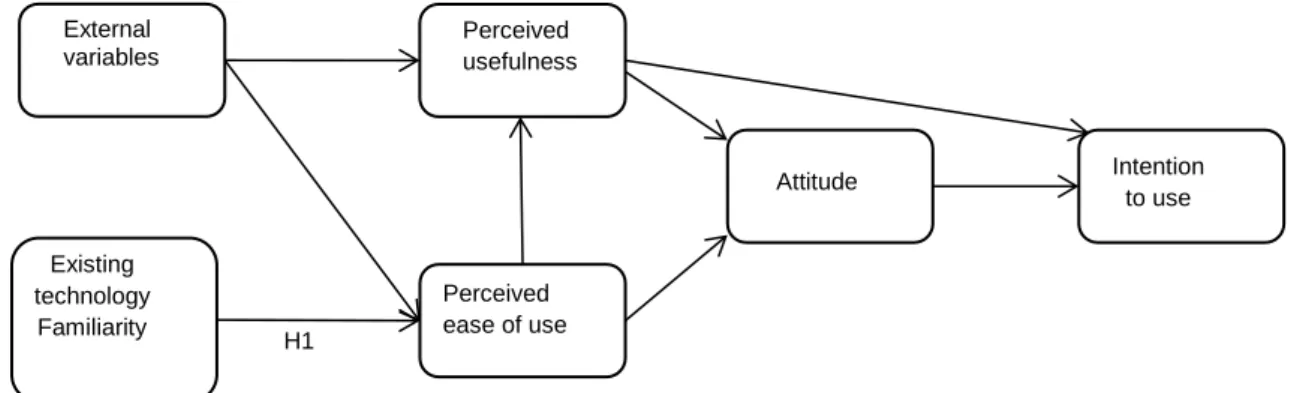
As previously mentioned in Section II.a, TAM states that perceived usefulness and ease of use influence the attitude of users towards a new technology and, therefore, its utilisation. However, the perceived ease of use and usefulness may occasionally be influenced by an existing technology, based on which the user will evaluate and compare any new technology. Based on this assumption, the following hypothesis is proposed:
H1: Perceived ease of use of a new technology is inversely proportional to the user’s familiarity with an existing technology.
Therefore, the proposed model introduces a variable to the TAM related to existing technology that offers some or all services offered by the new technology. This variable is familiarity, also known as perceived ease of use of an existing technology (Fig. 3). The existing technology in this study is represented by Facebook, which is widely used in UoK for sharing course materials and communicating with students.
Figure 3: Proposed Technology acceptance model
2560 1610
10507 4946
3308 6131
42619
19508
3826 8848
42925
25446
0 5000 10000 15000 20000 25000 30000 35000 40000 45000 50000
Number of courses Number of questions
Number of users Number of resources
1/1/2016 9/25/2017 9/25/2018
External variables
Perceived usefulness
Perceived ease of use
Attitude Intention
to use Existing
technology Familiarity
4.
The Questionnaire
4.1
Questionnaire design
A questionnaire survey is designed from scratch and conducted to convey the personal experience and impression of current educators regarding the status and challenges faced of full e-learning adoption. Specifically, the questions target the perceived usefulness and perceived ease of use for the educators. Several questions also focus on the perceived usefulness for their students.
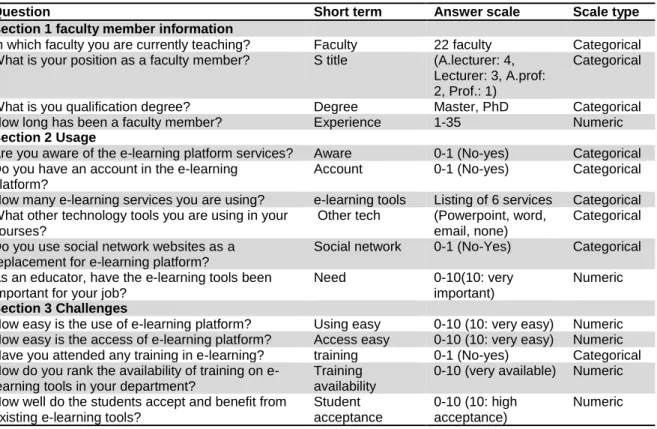
Table2: The questionnaire and the range of each question response
Scale type Answer scale
Short term Question
Section 1 faculty member information
Categorical 22 faculty
Faculty In which faculty you are currently teaching?
Categorical (A.lecturer: 4,
Lecturer: 3, A.prof: 2, Prof.: 1) S title
What is your position as a faculty member?
Categorical Master, PhD
Degree What is you qualification degree?
Numeric 1-35
Experience How long has been a faculty member?
Section 2 Usage
Categorical 0-1 (No-yes)
Aware Are you aware of the e-learning platform services?
Categorical 0-1 (No-yes)
Account Do you have an account in the e-learning
platform?
Categorical Listing of 6 services
e-learning tools How many e-learning services you are using?
Categorical (Powerpoint, word,
email, none) Other tech
What other technology tools you are using in your courses?
Categorical 0-1 (No-Yes)
Social network Do you use social network websites as a
replacement for e-learning platform?
Numeric 0-10(10: very
important) Need
As an educator, have the e-learning tools been important for your job?
Section 3 Challenges
Numeric 0-10 (10: very easy)
Using easy How easy is the use of e-learning platform?
Numeric 0-10 (10: very easy)
Access easy How easy is the access of e-learning platform?
Categorical 0-1 (No-yes)
training Have you attended any training in e-learning?
Numeric 0-10 (very available)
Training availability How do you rank the availability of training on
e-learning tools in your department?
Numeric 0-10 (10: high
acceptance) Student
acceptance How well do the students accept and benefit from
existing e-learning tools?
Table 2 shows the three sections of the survey. The first section is concerned with faculty members’ personal information that reflects his/her field and experience. The second section focuses on the level of Moodle usage. For instance, the participant is asked whether he/she has a Moodle account, about what services are used and whether he/she uses social media instead of the e-learning platform. The final section focuses on the challenges for the perceived ease of use and usefulness, such as easy access, ease of use, training availability and the process of how educators perceive the students’ acceptance of the technology and benefits from the e-learning system. In particular, this section aims to measure the variables related to Hypothesis H1.
Most of the questions are multiple-choice ones with a numerical or categorical scale for easy and fast survey accomplishment, thus encouraging many educators to participate in the study.
4.2
Sample and data collection
The electronic survey participants are UoK academic members across a wide range of disciplines. Table 3 shows the demographic characteristics of the participants, who belong to 22 faculties in the UoK, such as engineering, science, medical, law and business. The responses of the 242 academic members (out of 2,144) are collected through voluntary electronic survey using Google forms sent to their official emails. This sample accounts for 11.2% of the total university academic members. The participants also range from newly hired assistant lecturers to experienced professors with more than 20 years of experience. Their identities are authenticated using their official email address.
Although the questionnaire is limited in terms of excluding students, this study assumes that experienced educators exhibit more accurate impressions with a low acceptable margin of errors in evaluating e-learning usage than do less experienced educators. That is, the survey questionnaire is designed to reflect the academic
members’ experience and impression and the challenges that they or their students face. Meanwhile, the electronic survey ensures a high level of clean and valid data collection because it avoids digitization errors and over/under scale responses and offers identity authentication.
Table3: The demography characteristics of the questionnaire participants
Specialty (%) Engineering and science Humanitarian sciences Medical sciences
43.2 35.3 21.5
Qualification (%) PhD 59.8
Master 40.2
Experience (%) 0 -10 years 52.4
11-20 years 39.6
21 years or more 8 Position (%) Assistant Lecturer 27.4
Lecturer 34.4
Assistant Professor 30.9
Professor 7.3
4.3
Results
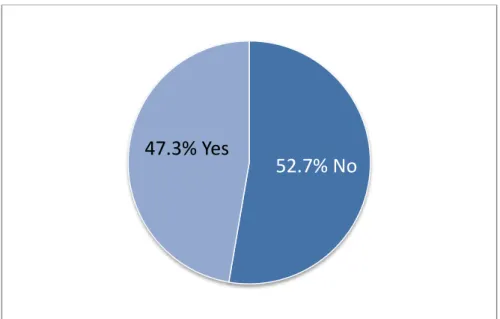
In terms of the existing status of e-learning utilisation, the responses show that approximately 94% of the faculty members are aware of the existing capability of the e-learning platform in the UoK; in addition, 93% already have an e-learning system account. Figure 4 reveals that 47.3 % of the faculty members use social network websites rather than the UoK platform for e-learning. According to face-to-face interviews with several participants, Facebook groups and Viber groups are the most adopted social media used by educators in UoK to communicate and share course materials with students.
Figure 4: The responses from faculty members whether they are using social network as a replacement for the existing e-learning platform
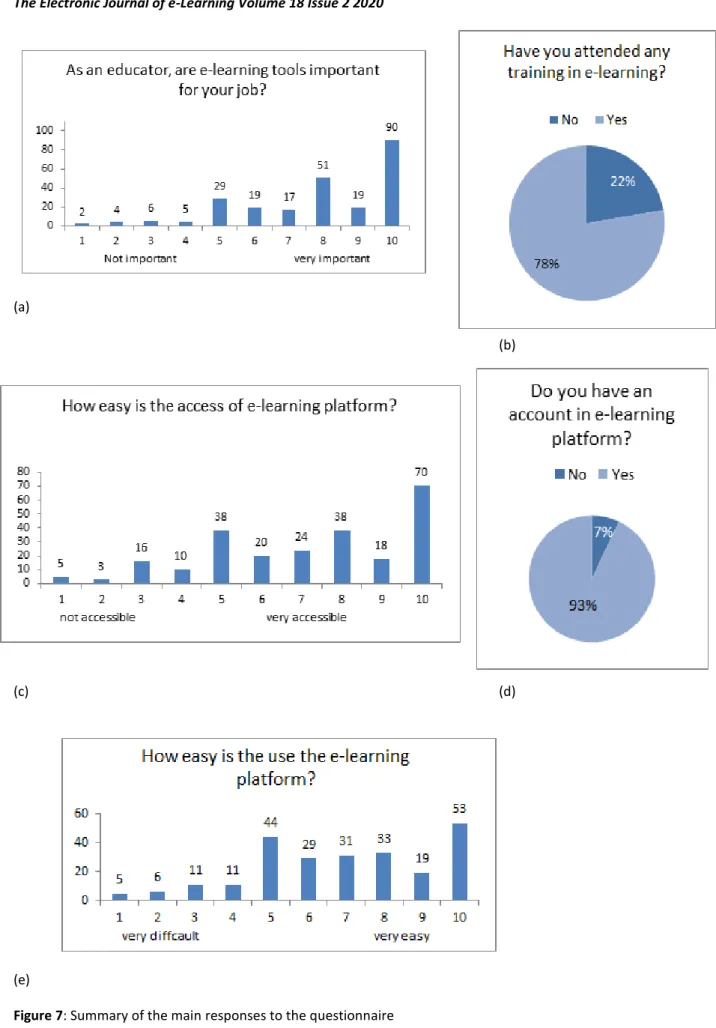
These findings are evident despite the fact that 77.6% perceive that e-learning training is fairly or very available, ranking 5 or more out of 10 (Fig. 6). Amongst the participants, 78% have already attended a training workshop on how to use the learning platform (Fig. 7.b). Moreover, 73.2% of the participants believe that e-learning has an important or very important role to play in the education process, ranking 6 or more out of 10 (Fig. 7.a). By contrast, less than 7% perceive that e-learning is not relevant in elevating their teaching outcomes, ranking 4 or less out of 10 (Fig. 7.a).
On the other hand, in terms of challenges, approximately 29.7% of the participants think that the existing e-learning platform is inaccessible, and 31.8% believe it is difficult to use (ranking it as 5 or less out of 10 in both cases) (Figs. 7.c and 7.e, respectively). However, when educators are asked regarding the students’ reaction,
52.7% No
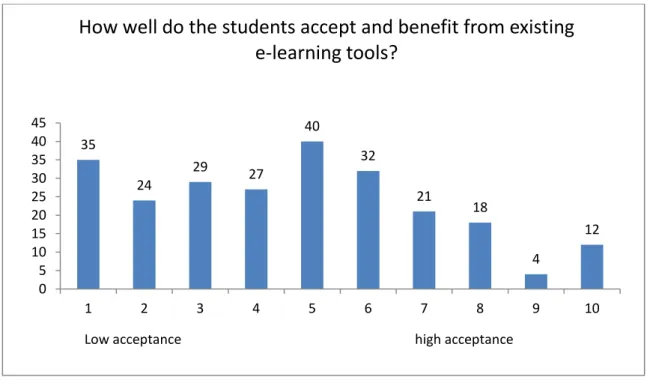
64.8% of them think their students are not reaping the benefits of e-learning tools, given that the educators rank it 5 or below out of 10 (10 being excellent in accepting and benefiting from e-learning), see Figure 5. These contradicting responses raise a number of questions that the present study attempts to address by using data analysis techniques in the next section.
Figure 5: The academic members’ assessment to students’ acceptance and benefiting from the e-learning platform
Figure 6: Responses regarding the e-learning training availability at the University of Kufa 35
24
29 27
40
32
21
18
4
12
0 5 10 15 20 25 30 35 40 45
1 2 3 4 5 6 7 8 9 10
Low acceptance high acceptance
How well do the students accept and benefit from existing
e-learning tools?
10 11 15
18
64
25 23
38
16
22
0 10 20 30 40 50 60 70
1 2 3 4 5 6 7 8 9 10
Not available very available
How do you rank the availability of training on e-learning
tools in your department?
(a)
(b)
(c) (d)
(e)
5.
Data Analysis and Discussion
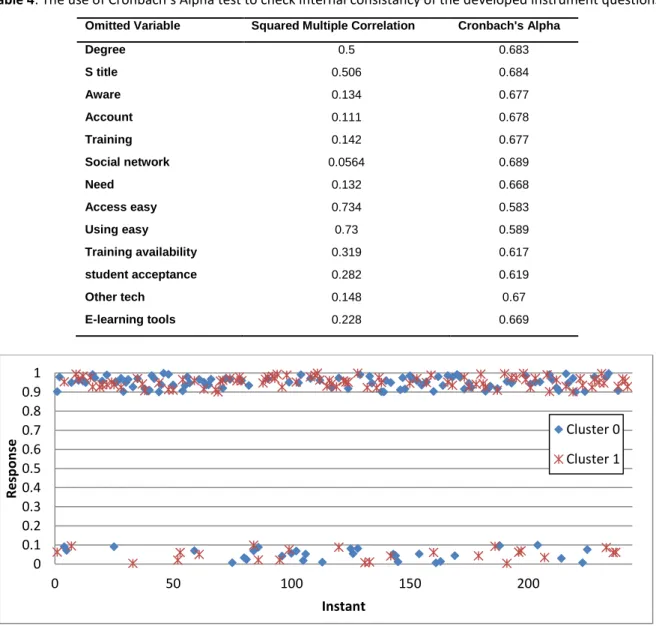
Cronbach’s coefficient alpha is used to check the internal consistency of the questions, as shown in Table 4 (Churchill, 1979). All the questions’ values are around 0.6 or above, which proves acceptable levels of internal consistency. In addition, the calculated squared multiple correlation shows that the social network question is the most independent amongst other questions, see Table 4.
Figure 8 shows the clustering of responses into two main groups as obtained using k-means clustering technique, as discussed in Section II. In contrast to the initial assessment, logical expectations and literature review (Chow, Tse and Armatas, 2018), training exhibits extremely little influence in shaping participant responses on the survey (Fig. 8.a). This finding is particularly true in our case study given the availability of training courses that already exist in the UoK (see Section 2.c). However, Fig. 8.b demonstrates that the use of social media seems to shape and divide all the responses of the survey participants into two groups. This result is attributed to the high familiarity and popularity of existing technology, including Facebook, which reflect on the users’ perceived usefulness and ease of use for Moodle. Specifically, competition with social media in terms of perceived ease of use and usefulness is difficult, particularly for faculty members who have already been using social media to load course learning materials and communicate with their students.
Table 4: The use of Cronbach’s Alpha test to check internal consistancy of the developed instrument questions
Omitted Variable Squared Multiple Correlation Cronbach's Alpha
Degree 0.5 0.683
S title 0.506 0.684
Aware 0.134 0.677
Account 0.111 0.678
Training 0.142 0.677
Social network 0.0564 0.689
Need 0.132 0.668
Access easy 0.734 0.583
Using easy 0.73 0.589
Training availability 0.319 0.617
student acceptance 0.282 0.619
Other tech 0.148 0.67
E-learning tools 0.228 0.669
a. Distribution of cluster instances based on training question responses. 0
0.1 0.2 0.3 0.4 0.5 0.6 0.7 0.8 0.9 1
0 50 100 150 200
R
e
sp
o
n
se
Instant
Cluster 0 Cluster 1
Using easy
Student acceptance
Training availability
Yes S Title
Access easy Yes No No Yes No using easy Degree e-learning tools 2.8 Training availability Training availability Using easy 4.58 2.89 6.44 1.33 3.07 Training availability 6.46 4.52
< 6.5 ≥ 6.5
>= 1.5 < 1.5
>= 1.5 < 1.5
< 7.5 ≥ 7.5
≥ 6.5 < 6.5 ≥ 4.5 < 4.5 ≥ 8.5 < 8.5 242 136 106 61 75 44 62 15 47 44 3 35 9 26 9
b. Distribution of cluster instances based on social media question responses. Figure 8: Clustering of questionnaire responses using k-means
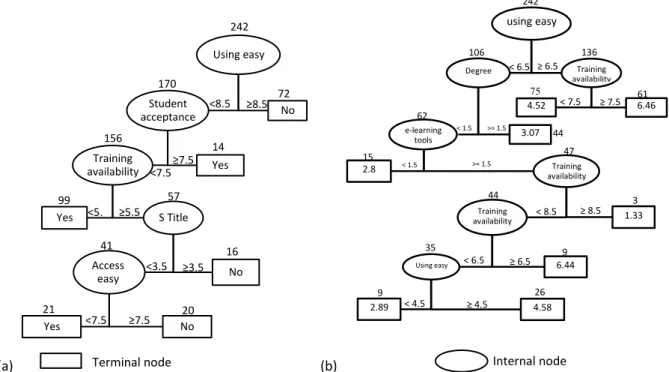
Moreover, Figure 9.a shows the decision tree built by using the REPTree technique, as discussed in Section II, to answer the use of social media as a target. This tree demonstrates that the use of social media is related to the impression of educators whether the use of the Moodle is perceived as very easy compared with familiar social media. A total of 72 participants (29.7% of the total participants) do not use social media because they believe the existing platform is very easy to use and access (on a scale of 1 to 10, they selected 8 or above). Moreover, even if the student reacts high to e-learning (answer range ≥ 7.5), an academic member may still use social media as a means of e-learning. However, if the students’ reaction to the e-learning platform is average or low, adopting social media becomes linked to the e-learning training, academic member position (newly employed faculty members are more willing to use e-learning) and accessibility. In conclusion to all these extracted links among the questionnaire variables, hypotheses H1 is accepted in the proposed e-learning TAM.
(a) (b)
Figure 9: Decision tree is generated using REPtree based on a specific target response (a) use of social media instead of e-learning? (b) Level of student acceptance. Note that the value inside terminal nodes represents the answers; value associated with branches represents answer range; values above internal/terminal is the number of responses
On the other hand, Figure 9.b presents the second decision tree with student acceptance as a target. Academic members seemingly reflect their own personal impression as their own students’ impression regarding e-learning tools. This assumption is confirmed by existing literature from the developing country (Cidral et al., 2017). That is, if the academic member (61 participants) perceives that e-learning platform is easy to use,
0 0.2 0.4 0.6 0.8 1
0 50 100 150 200
R e sp o n se Instant Cluster 0 Cluster 1 242 72 170 ≥8.5 <8.5 156 14 ≥7.5 <7.5 57 99 16 ≥5.5 <5. 5 41 ≥3.5 <3.5 20 21 ≥7.5 <7.5 Internal node Terminal node
accessible and subject to training, then his/her average response regarding student acceptance will be high (around 6.5). This confirms the outcome of Sánchez and Hueros (2010) and shows that attitude towards e-learning technology, namely Moodle, may be influenced and is not directly linked to the actual user experience. Meanwhile, other branches in the tree show that if the academic member uses a variety of e-learning services (e.g. lectures’ handout sharing, e-exam, assignments, forums, chats) and had access to the training, then the student acceptance is high (around 6.5). This finding is due to the full employment of e-learning services in their academic courses.
6.
Challenges and Suggested Solutions
The questionnaire-obtained results, statistics and information extracted and presented in previous sections reveal that the challenges in our case study, which are also confirmed by other studies, can be classified into the following main categories.
Firstly, technical issues include infrastructure, technical support, extensive student accounts management, reliable bandwidth connection to the servers and server capability to handle scalable demands. These technical issues can be categorised as external factors in the TAM, which studies show have great influence on perceived usefulness and perceived ease of use (Mahmod et al., 2017, Sánchez and Hueros (2010). These challenges are normal in developing countries because of low investments or lack of consistent maintenance.
Secondly, the analysed results suggest that a nontrivial percentage of faculty members and students use social media as an e-learning platform. This phenomenon is reasonable given that they are more familiar with social media and perceive these as extremely easy to use. In addition, the use of social media may have certain benefits for the education process, such as accessible information for students and for students to easily communicate with their teachers and their peers (Kalelioğlu, 2017, Petrovic et al., 2013). Therefore, although e-learning specialised platforms may offer more services than does social media, educators and students are reluctant to use them. Thus, seeing trained academicians who prefer to use social network websites instead of the official e-learning platform is becoming less surprising. Some studies have suggested using both Moodle and Facebook because of their merits in terms of e-learning (Kalelioğlu, 2017, Petrovic et al., 2013). However, several negative issues have been discovered when Facebook is used as e-learning platform, such as difficulty in finding old uploaded files, lack of time limitation for submissions, confidentiality of student submissions and their grades and distractions (Kalelioğlu, 2017, Petrovic et al., 2013). Therefore, the following suggested solutions should be considered. (1) Improve the training program and incentive policy to motivate the targeted students and educators to use e-learning platforms. (2) Develop a specialised version of social networks to be appropriate for education purposes. For example, Facebook could develop an e-learning platform similar to Workplace, which is appropriate for a working environment. Edmodo is another example of an e-learning environment that resembles typical social media websites (Edmodo, 2018). (3) Existing e-learning platforms, such as Moodle, can be modified similar to social media websites.
Thirdly, publicity should be considered. The statistics imply the consistently negative attitude towards e-learning in the UoK. A large portion of the academic members lack the motivation to actually use e-e-learning tools because they are sceptic of whether this platform will assist in their current education tasks or if it is just another routine layer to be added, which is a common attitude amongst educators in developing countries. This issue can be tackled by designing policies and starting a publicity campaign that aims to highlight the impact of e-learning on the education process as well as the possible savings in time and resources it might offer for the academic members and the students. For example, promoting and motivating students have shown significant impact on the e-learning outcome in developing countries (Maldonado et al. 2009).
7.
Conclusion and future work
This study shows that despite the availability of the e-learning technology, such as the case of UoK, e-learning utilisation may not reach the planned target and impact. This finding is assumed to be caused by the transfer of e-learning in developing countries, which focuses on technological infrastructure while ignoring the crucial factors that influence technology acceptance and the full adoption of e-learning. Critical information obtained from the faculty members’ questionnaire responses through data analysis techniques shows that the main factors and challenges faced by the full adoption of e-learning include lower perceived usefulness and ease of use compared with social media websites and the absence of planned promotions. Moreover, the findings confirm the proposed TAM, which posits that new technology usage and acceptance is relative to the user’s
(educator/student) attitude, experience and beliefs, particularly in case of an existing technology. Consistent with previous research, this study proves that social media, despite some of its merits for e-learning, is a negative influential factor that discourages educators from fully utilising any custom education management system platforms that offer enhanced learning capabilities. This outcome is attributed to the fact that the perceived ease of use and usefulness of Moodle fall short compared with those of familiar social media tools. Therefore, the proposed outline of possible solutions to handle these challenges includes modifying learning platforms to be similar to the social media environment and/or introducing new e-learning services to social media. Consequently, the study draws a new horizon for policy makers, researchers and e-learning platform developers. Recommendations for future work include further studies to confirm our finding through a student survey and implementation of the proposed solutions.
References
Anon., 2010. Iraq joins Avicenna virtual campus. A World of Science, 8(2), p 14.
Ansong, E., Lovia Boateng, S. and Boateng, R., 2017. Determinants of e-learning adoption in universities: evidence from a developing country. Journal of Educational Technology Systems, 46(1), pp.30-60.
Almazroi, A.A., Shen, H., Teoh, K.K. and Babar, M.A., 2016. IEEE Cloud for e-learning: determinants of Its adoption by university students in a developing country. In: IEEE 13th International Conference on e-Business Engineering (ICEBE) (pp. 71-78).Macau, China, 4-6 November 2016...: IEEE.
Atanda, B.N. and Ahlan, A.R., 2014. Issues of e-learning in developing countries: a Nigerian perspective. In: The 5th International Conference on Information and Communication Technology for the Muslim World (ICT4M), 2014 (pp. 1-4). Kuching, Malaysia, 17-18 November 2014.IEEE.
Baturay, M.H., Gökçearslan, S. and Sahin, S., 2017. Associations among teachers' attitudes towards computer-assisted education and TPACK competencies. Informatics in Education, 16(1), pp.1-23.
Calders, T. and Pechenizkiy, M., 2012. Introduction to the special section on educational data mining. Acm Sigkdd Explorations Newsletter, 13(2), pp.3-6.
Canedo, E.D., Santos, G.A. and Leite, L.L., 2018. An assessment of the teaching/Learning methodologies used in the introductory programming courses at a Brazilian University. Informatics in Education, 17(1), pp. 45–59.
Castro, F., Vellido, A., Nebot, À. and Mugica, F., 2007. Applying data mining techniques to e-learning problems. In: Tedman, R. A., and Tedman,D. K., eds. Evolution of teaching and learning paradigms in intelligent environment (pp. 183-221). Berlin, Heidelberg: Springer.
Chow, J., Tse, A. and Armatas, C., 2018. Comparing trained and untrained teachers on their use of LMS tools using the Rasch analysis. Computers & Education, Volume 123, pp.124-137.
Churchill Jr, G.A., 1979. A paradigm for developing better measures of marketing constructs. Journal of Marketing Research,16(1), pp.64-73.
Cidral, W.A., Oliveira, T., Di Felice, M. and Aparicio, M., 2018. E-learning success determinants: Brazilian empirical study. Computers & Education, 122, pp.273-290.
De Ville, B., 2006. Decision trees for business intelligence and data mining: using SAS enterprise miner. SAS Publishing. Dudaitė, J. and Prakapas, R., 2017. The experience of teachers in the application of ActivInspire Interactive Evaluation
System in classroom: a case of teachers in Lithuania. Informatics in Education, 16(2), p.181.
Edmodo global education network. [online] Available at: <https://www.edmodo.com/ >, [Accessed 1st January, 2019] Fishbein, M. and Ajzen, I., 1975. Belief, attitude, intention and behavior: An introduction to theory and research, USA,
Addison-Wesley.
Han, J., Pei, J. and Kamber, M., 2011. Data mining: concepts and techniques.USA, Elsevier.
Hanna, M., 2004. Data mining in the e-learning domain. Campus-wide Information Systems, 21(1), pp.29-34.
Haron, H. and Sahar, S., 2010. An investigation on predictors of e-learning adoption among Malaysian e-learners. In: 2010 International Conference on Science and Social Research. Kuala Lumpur, Malaysia, 5-7 Dec. 2010. IEEE. Kalelioğlu, F., 2017. Using Facebook as a learning management system: experiences of pre-service teachers. Informatics in
Education, 16(1), p.83.
Kanwal, F. and Rehman, M., 2017. Factors affecting e-learning adoption in developing countries–empirical evidence from Pakistan’s higher education sector. IEEE Access, 5, pp.10968-10978.
Kaur, P., Singh, M. and Josan, G.S., 2015. Classification and prediction based data mining algorithms to predict slow learners in education sector. Procedia Computer Science, 57, pp.500-508.
Koponen, T., Tedre, M. and Vesisenaho, M., 2011, May. An analysis of the state and prospects of e-learning in developing countries. In: IST-Africa Conference Proceedings, Gaborone, May, 2011 (pp. 1-9). IEEE.
Mahmod, M. A., Ali, A. B. M., Ahlan, A. R. B., Shah, A., and Seman, M. S. A., 2017, E-learning in Iraqi universities: A review. In: Computing, Engineering, and Design (ICCED), 2017 International Conference on (pp. 1-4). Kuala Lumpur, November, 2017, IEEE.
Maldonado, U.P.T., Khan, G.F., Moon, J. and Rho, J.J., 2009. E-learning motivation, students’ acceptance/use of educational portal in developing countries. In: Proceeds of the 4th International Conference on Computer Sciences and
Marikar, F.M. and Jayarathne, N., 2016. Effectiveness of MOODLE in education system in Sri Lankan university. International Journal of Modern Education and Computer Science, 8(2), p.54.
Moodle statistics. [online] Available at :< https://moodle.net/stats/ >, [Accessed 1st January, 2019]
Nortvig, A.M., Petersen, A.K. and Balle, S.H., 2018. A literature review of the factors influencing e-learning and blended learning in relation to learning outcome, student satisfaction and engagement. Electronic Journal of
e-Learning, 16(1), pp.46-55.
Petrovic, N., Jeremic, V., Cirovic, M., Radojicic, Z. and Milenkovic, N., 2013. Facebook vs. Moodle: what do students really think? In International Conference on Information Communication Technologies in Education. Singapore, September, 2013, (pp. 413-421).
Quesada, J., Calvo, I., Sancho, J., Sainz, J.A., Sanchez, J., Gil-Garcia, J.M., Sebastian, R. and Castro, M., 2013. Combining moodle and redmine as e-learning tools in project based learning of industrial electronics. In: e-Learning in Industrial Electronics (ICELIE), November. 2013 7th IEEE International Conference. Vienna, 2013, (pp. 86-91). IEEE.
Romero, C. and Ventura, S., 2010. Educational data mining: a review of the state of the art. IEEE Transactions on Systems, Man, and Cybernetics, Part C (Applications and Reviews), 40(6), pp.601-618.
Sánchez, R.A. and Hueros, A.D., 2010. Motivational factors that influence the acceptance of Moodle using TAM. Computers in Human Behavior, 26(6), pp.1632-1640.
Tan, A.Y.T., Chew, E. and Mellor, D., 2016, October. To infinity and beyond: Learning in the 21st century. In: Learning, e-Management and e-Services (IC3e), 2016 IEEE Conference. Langkawi, 2016, (pp. 156-161). IEEE.
Tan, P.N., 2007. Introduction to data mining. India, Pearson Education.
Tufféry, S., 2011. Data mining and statistics for decision making (Vol. 2). Chichester: Wiley.
University of Kufa, [online] Available at < http://www.uokufa.edu.iq/ >. [Accessed 1st January, 2019]
Uziak, J., Oladiran, M.T., Lorencowicz, E. and Becker, K., 2018. Students' and instructor's perspective on the use of Blackboard Platform for delivering an engineering course. The Electronic Journal of e-Learning, 16(1), pp.1-15. Yang, F. and Li, F.W., 2018. Study on student performance estimation, student progress analysis, and student potential