Sharif University of Technology
Scientia IranicaTransactions D: Computer Science & Engineering and Electrical Engineering www.scientiairanica.com
Research Note
A fuzzy-based method for road area detection in high
resolution SAR images
M. Saati and J. Amini
Department of Geomatics Engineering, College of Engineering, Tehran University, Tehran, P.O. Box 11365-4563, Iran. Received 16 November 2013; received in revised form 12 August 2014; accepted 21 April 2015
KEYWORDS Multiple features; Road detection; Fuzzy algorithm; High resolution; Synthetic aperture radar.
Abstract. Automatic road extraction from satellite images is one of the most important areas of research in the eld of remote sensing. The method proposed in this study is based on a fuzzy method for the detection of road areas from high resolution SAR images. In this method, the multiple features are extracted rst, using the backscatter coecients of each pixel and its neighboring pixels. The extracted features are combined with each other in the next step using a fuzzy algorithm, and, nally, the desired road areas are selected separately considering spatial and spectral criteria. The proposed algorithm is tested on dierent scenes of TerraSAR-X images. Experimental results reveal that the proposed method is eective.
c
2015 Sharif University of Technology. All rights reserved.
1. Introduction
Manual extraction of features from satellite images by expert operators requires high costs and time. Therefore, automatic extraction of the features from satellite and aerial images is basic research, in terms of the automatic generation of spatial information and mapping. Roads and buildings are most important, as well as frequent, features when preparing maps of urban, suburban and rural regions.
Synthetic Aperture Radar (SAR) images have advantages over optical images, mainly because of weather independence and their ability to operate both day and night. Currently, automatic road extraction from Very High Resolution (VHR) SAR data is a research topic in great demand. However, task com-plexity increases, and is not eased by the enhanced resolution due to speckle noise. The fact that buildings along the road may mask them, or reduce their
visibil-*. Corresponding author. Tel.: +98 21 88334409 E-mail addresses: [email protected] (M. Saati); [email protected] (J. Amini).
ity, further complicates the road detection problem. It is noted, here, that some satellites, like TerraSAR-X, RADARSAT-2 and COSMO-SkyMed, incorporate an appropriate resolution for extraction of roads, even in urban areas.
Since the 1990s, many researchers have addressed this topic [1,2].
A nearly automatic detection algorithm using the Markov random eld was proposed by Tupin et al. for linear features, such as the main axes of road networks [3]. Jeon et al. [4] developed a technique for the detection of roads in a SAR image using a genetic algorithm.
Tupin et al. [5] presented a technique for the detection of roads in dense urban areas using SAR imagery based on a multiscale framework. Dell'Acqua et al. [6] presented an algorithm for road extraction based on multiple road detectors and logical feature fusion in ne resolution SAR imageries. Bentabet et al. [7] updated road vectors using SAR imagery with-out human-computer interaction, with comprehensive knowledge provided by a road database.
from airborne SAR imagery supported by context information. Chen et al. [9] applied particle ltering in tracking consecutive road segments from SAR im-ages. Lisini et al. [10] presented a road extraction method comprising the fusion of classication results and structural information in the form of segmented lines. The approach was tested for airborne SAR data of resolution better than 1 m.
Li et al. [11] presented a road extraction method from high-resolution dual-polarization SAR data over urban areas based on a two road detector extraction and feature-level fusion. Stilla and Hedman [12] used a Bayesian network, in an already existing road extraction approach, for road extraction from SAR imagery. Hedman et al. [13] proposed a combination of two road extractors from VHR SAR scenes: one more successful in rural areas and one explicitly designed for urban areas. In order to get the best combination of both, a rapid mapping lter for discriminating rural and urban scenes is utilized.
To improve the performance of road extractors on SAR images, Zhou et al. [14] used the image of polarimetric SAR systems, which measures a target's reectivity using four polarizations. Liu et al. [15] presented a road extraction method from SAR imagery based on an improved particle ltering and snake model.
From this information, one can see that much work on road extraction has been undertaken using automatic or semi-automatic methods in aerial or satel-lite SAR images. As a basic step in all the mentioned methods, the local detection procedure plays a critical role and determines the overall performance of road detection procedures.
In the present work, we aim to improve the road area detection task in SAR images by exploiting multiple spatial and spectral feature extraction, dened as the range of a window in the vicinity of a pixel, and a fuzzy-based feature fusion method, in comparison with methods using segmentation, like Negri [16]. In fact, with meter or sub-meter spatial resolution, roads in SAR data may be more precisely modeled as dark elongated areas surrounded by bright edges, which are due to double-bounce reections by surrounding buildings or uniform backscattering by vegetation. The eect is more pronounced for roads oriented in a range direction. As a result, there are many bright areas with high contrast adjacent to them. Therefore, the features in this paper are dened exactly, based on the above mentioned issues, which include aligned, dark and high contrast pixels with their adjacent regions.
In the rest of this paper, Section 2 introduces the materials and methods used in the current research, while the results are discussed in Section 3. Finally, Section 4 gives some conclusions and suggestions.
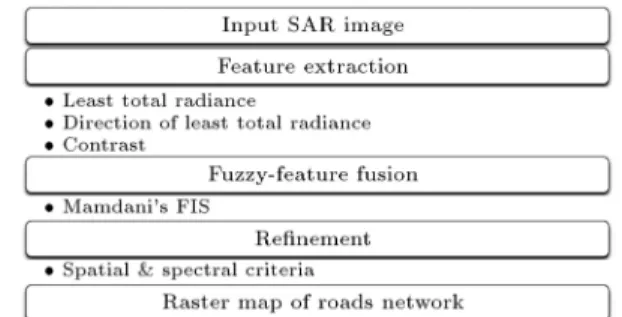
Figure 1. Diagram of the proposed road area detection method.
2. Materials and methods
The method proposed in this paper is divided into three steps, as depicted in Figure 1:
1. Feature extraction: The features adapted to road properties in high resolution SAR images are ex-tracted.
2. Fuzzy-feature fusion: The extracted features are fused based on a fuzzy algorithm to detect road areas.
3. Renement: The spatial and spectral criteria are used for renement of extracted roads. In the following subsections, we describe, in detail, the method, emphasizing the adaptation of the algo-rithm for suburban areas.
In this research, we have endeavored to achieve desir-able results using multiple detectors. Thus, straight linear features of the image are investigated, consid-ering the spatial relation between each pixel and its neighbors. Then, diagnosis of the road segments is improved in the next step by a fuzzy combination of the results derived from each detector.
It was previously mentioned that the road appears as extended dark areas with relatively light edges in high resolution SAR images [14]. Therefore, one should search for pairs with parallel edges or with homogeneous or extended dark areas. Taking into account each of the following conditions may generate undesirable results. Thus, a more precise answer would be a combination of the above mentioned conditions and ideas.
2.1. Feature extraction
In order to extract pixels of a road, the rst step is to calculate some spatial features in a square window around the central pixel, p(i; j). However, each of these features is a function of the window size, R R.
Figure 2 depicts how to select the neighbors of pixel p(i; j) on the image.
The sum of radiance in the specic direction of in the selected window is the total radiance, which is given as [16]:
Figure 2. Selection of neighborhood pixels.
r(i; j; R; ) =
k=R=2X k= R=2
p([i + k cos()]; [j + k sin()]): (1) The direction of the least total radiance, as the rst feature, is dened as:
0(i; j; R) = arg minr(i; j; R; ); [0 180): (2)
The corresponding total radiance of 0, as the second
feature, is also dened as:
r0(i; j; R) = r(i; j; R; 0): (3)
0and r0demonstrate dark areas elongated around the
pixel, p(i; j), which is extended in the current window. Assuming that these areas are appropriate candi-dates for road areas, their contrast with other areas (average total radiance of other directions) must be high. Therefore, the third feature is the value of the contrast, which is dened as:
c0(i; j; R) =
P
r(i; j; R; )
n r0(i; j; R)
; (4)
where, n represents the number of directions for which the value of total radiance has been calculated.
It is clear that features, 0, r0 and c0, display
dierent information. All of them are a function of the window size, R R, and each of them may reproduce incorrect results. So, incorrect results are expected to be deleted by combining them. It is noted here that the wider and longer road areas are detected from dimensions of the larger windows, whereas the narrower and shorter road areas are characterized by smaller dimensions.
2.2. Fuzzy-feature algorithm
The road areas in SAR images are determined with a fuzzy algorithm, called a fuzzy-feature algorithm, based on three features. Fuzzy logic provides a simple way to arrive at a denite conclusion based upon imprecise, uncertain, ambiguous, vague or missing input information. Fuzzy set theory, introduced by L. Zadeh in the 1960s, resembles human reasoning in its use of approximate information and uncertainty to generate decisions [17].
A classical fuzzy inference system consists of a rule base, membership functions, and an inference procedure (see Figure 3).
We dene three linguistic variables; Least Total Radiance (LTR), contrast (Co) and Direction of Least Total Radiance (DoLTR) as input, and variable Road as output of the fuzzy system. Table 1 shows the terms of each linguistic variable.
IF-THEN rules are statements that make fuzzy logic useful. Generally, a single fuzzy IF-THEN rule can be formulated according to:
IF x is A; THEN y is B.
A and B are linguistic labels dened by fuzzy sets on the range of all possible values of x and y, respectively. The rst sentence is called antecedent, and the second consequent.
For recognizing a road area in HR-SAR images, one of the IF-THEN fuzzy rules might be: IF LTR is Low AND Co is High AND DoLTR is Close to local average value, THEN the pixel area is Road. This example reveals an important aspect of fuzzy reasoning: The rule base should include observations of the important features.
Some of the other suggested fuzzy rules are:
If (Co is Low), Then (Road is False).
If (Co is High) AND (LTR is Low) AND (DoLTR is Moderate), Then (Road is True).
If (Co is High) AND (LTR is Middle) AND (DoLTR is Moderate), Then (Road is Probable).
Formulating the rules is more a question of the ex-pertise of an operator than of a detailed technical modeling approach. Given the rules and input features, the degree of membership to each of the fuzzy sets has to be determined. Fuzzy processing of the input features requires a specication of the linguistic labels
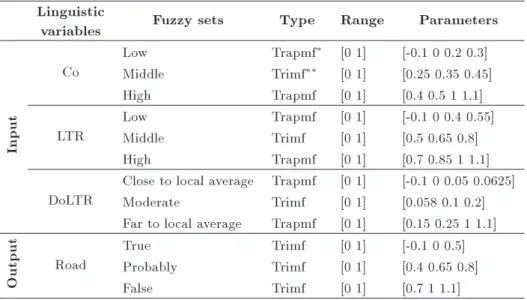
Table 1. Linguistic variables and labels for the fuzzy-feature algorithm. Linguistic
variables Fuzzy sets Type Range Parameters
Input
Co
Low Trapmf [0 1] [-0.1 0 0.2 0.3]
Middle Trimf [0 1] [0.25 0.35 0.45]
High Trapmf [0 1] [0.4 0.5 1 1.1]
LTR
Low Trapmf [0 1] [-0.1 0 0.4 0.55]
Middle Trimf [0 1] [0.5 0.65 0.8]
High Trapmf [0 1] [0.7 0.85 1 1.1]
DoLTR
Close to local average Trapmf [0 1] [-0.1 0 0.05 0.0625] Moderate Trimf [0 1] [0.058 0.1 0.2] Far to local average Trapmf [0 1] [0.15 0.25 1 1.1]
Output
Road
True Trimf [0 1] [-0.1 0 0.5]
Probably Trimf [0 1] [0.4 0.65 0.8]
False Trimf [0 1] [0.7 1 1.1]
: Trapezoidal membership function; : Triangular membership function.
which represent fuzzy sets. The linguistic variables: Three linguistic input variables and one linguistic output variable, and their fuzzy sets, used in the investigations, for each extracted feature, are listed in Table 1. Three fuzzy sets are assigned to each input variable, which reect an interactively carried out examination of all possible values of the features. In practice, this assignment is mostly a mixture of expert knowledge and examination of the desired input-output data. Also, three fuzzy sets are chosen for the linguistic output with True, Probably and False. Widely applied membership functions are triangular and trapezoidal functions with a maximum equal to 1 and a minimum equal to 0. Sucient overlap of neigh-boring membership functions is taken into account to provide smooth transition from one linguistic label to another.
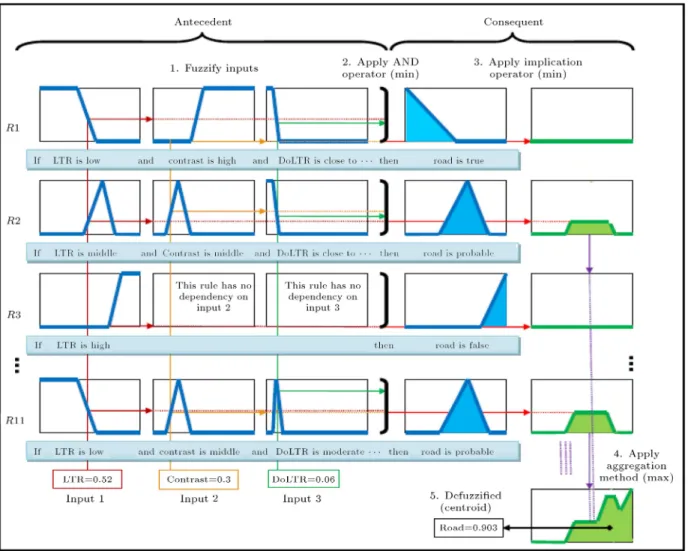
The fuzzy AND or OR operators combine the membership values of the input features in each rule, which results in one of the antecedents of that rule. The next step is the implication of the antecedent to the consequent. Implication is carried out for all rules and another step is to aggregate the output fuzzy sets over all rules. Inputs of aggregation are truncated output functions returned by the implication process for each rule. The result of the aggregation process is one fuzzy set for each output variable. What remains in the nal step is to defuzzify the fuzzy set and to produce a crisp output. A favorite defuzzication method is to calculate the center of gravity, which determines the center of the area under the aggregated output function (centroid). In our approach for fuzzy-feature fusion, as shown in Figure 4, we follow the Max-Min approach proposed by Mamdani [18], because it oers some advantages with regard to intuitive, widespread
acceptance, and is well suited to human input. As depicted in Figure 4, for three feature values of a pixel: LTR=0.52, Co=0.3 and DoLTR=0.06, as inputs to the model, the process of the fuzzy system is undertaken to make a fuzzy resonance result. This gure shows the pixel is \Road" and the corresponding defuzzied value is equal to 0.903. For a comprehensive study of fuzzy logic and Fuzzy Inference Systems (FISs), please refer to [19].
2.3. Renement
The last step of the road detection algorithm is the selection of proper road areas on the image of the features. Two criteria are utilized for this purpose, namely, spatial and spectral.
Spatial criterion: According to the ground spatial resolution of the sensors, small detected areas cannot be part of the road network. So, they are negligible enough to be ignored. To this aim, areas containing 40 pixels or less can be deleted from the road areas. Spectral criterion: Areas detected with very high average radiances cannot be part of the road network (considering the average total radiance of the image). So, they are ignored. In other words, the areas with radiances greater than a fraction of the average total radiance are deleted.
3. Results and discussion
The proposed methodology is illustrated by means of real radar images. Two test images, which were acquired by the TerraSAR sensor, with a spatial
Figure 4. Fuzzy inference system based on our approach. Table 2. Parameters of feature fusion based on fuzzy logic.
ParametersI FIS type And method Or method Implication Aggregation Defuzzication # of rules
. . . .
ValueI Mamdani min max min max Centroid 11
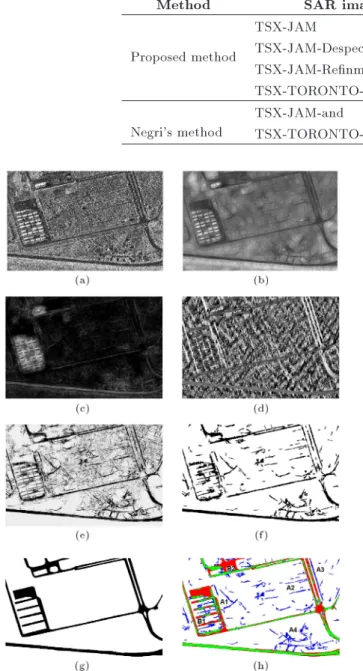
resolution of 1m, are used. The rst test image (Fig-ure 5(a)), dated 19th April, 2011, shows an area over Jam, Bushehr, in Iran, and the second (Figure 6(a)), dated 15th December, 2007, covers a part of Toronto, Canada. The rst image shows a relatively \clean" area. In the second image, a complex scene, which contains many road intersections as well as buildings, is presented.
The multiple features were obtained in the rst step according to Section 2.1. Images of each feature are illustrated in Figure 5(b)-(d) and Figure 6(b)-(d) for experimental data sets 1 and 2, respectively.
In the next step, as described in Section 2.2., the image of the features is fuzzied rst and then combined with each other by fuzzy logic. Finally, the defuzzication stage is used in the model to assign
the expected (crisp) value for the output image. All parameters are listed (with implemented values) in Table 2.
The obtained images from combining the features are shown in Figures 5(e) and 6(e).
In the following, spectral and spatial criteria were separately applied on the image in order to improve the performance and to select proper road areas. Thereby, those areas with average radiance greater than 70% of the average total radiance of the images, or the areas whose sizes are smaller than 40 pixels, were ignored. The obtained results are depicted in Figures 5(f) and 6(f).
The results of applying the above mentioned criteria are entitled \TSX-JAM-Renement" and are listed in Table 3.
Table 3. Indexes of accuracy analysis for dierent input images.
Method SAR image RCC BCC RMSC
Proposed method
TSX-JAM 0.93 0.67 0.81
TSX-JAM-Despeckled 0.93 0.72 0.83 TSX-JAM-Renmented 0.93 0.81 0.87 TSX-TORONTO-Renement 0.67 0.83 0.76 Negri's method
TSX-JAM-and 0.59 0.87 0.74
TSX-TORONTO-and 0.54 0.85 0.71
Figure 5. The experimental results on the rst TerraSAR image from Iran: (a) The testing image from Bushehr, Iran; (b) LTR image; (c) contrast image; (d) DoLTR image; (e) result of fuzzy feature fusion; (f) result of renement; (g) ground truth; and (h) classied image of detected roads (green: correctly detected areas, blue: incorrectly detected areas, red: undetected areas, white: non-road areas).
One of the basic requirements for the systems which perform a task automatically is to analyze their accuracies. Therefore, various criteria have been employed to assess the accuracy of the surveyed road. Wiedemann [20] has provided a thorough discussion in this regard.
The corresponding pixels of the road area image are compared with the pixels of the reference road
Figure 6. The experimental results on the second TerraSAR image from Toronto: (a) The testing image from Toronto; (b) LTR image; (c) contrast image; (d) DoLTR image; (e) result of fuzzy feature fusion; (f) result of renement; (g) ground truth; and (h) classied image of detected roads (green: correctly detected areas, blue: incorrectly detected areas, red: undetected areas, white: non-road areas).
image in order to numerically analyze the accuracy of the road detection obtained from a logical combination of the images related to the radar imagery features. For this purpose, a binary image of the reference road network must be created by a human opera-tor and some numerical parameters: Road detection Correctness Coecient (RCC), Background detection Correctness Coecient (BCC) and Root Mean Square Coecient (RMSC) are considered.
Multiplying pixels of the nal image by those of the binary image and calculating their average products will give a RCC. This RCC criterion can be deemed a measure of the average ability of the above mentioned algorithm in the detection of the existing pixels of the road in this image. In other words, in order to show the nature of the pixels in terms of road detection, RCC demonstrates the percentage of the acceptable results of the applied method.
For inversion of the values associated with the binary image obtained from the reference road network, and by repeating the discussed operations for calculat-ing the RCC, a similar criterion called BCC is used. This parameter acts as a criterion for showing how this algorithm performs to diagnose and distinguish the background road pixels. Also, to calculate RMSC, the following equation is dened:
RMSC = s
(RCC2+ BCC2)
2 : (5)
The optimum value for RCC, BCC and RMSC is 1. As seen in Figure 5(g), all the road pixels are labeled with 0, while all the background pixels are labeled with 1. By multiplying the corresponding pixels of the reference image in the nal binary image, the parameters of RCC, BCC and RMSC are calculated and the obtained numerical results are summarized in Table 3.
An inherent issue in all SAR imagery is speckle noise, which is a variation in backscatter from inhomo-geneous cells. This type of noise reduces the image contrast, which has a direct, negative eect on the texture based analysis of the imageries. Meanwhile, speckle noise also changes the spatial statistics of the underlying scene backscatter, which, in turn, makes the classication of imageries a dicult task.
There are dierent lters for reduction of the noise eect on the SAR images. One of the most common lters for this purpose is Gamma-MAP [21]. The Maximum A Posteriori (MAP) lter is based on a multiplicative noise model with nonstationary mean and variance parameters. This lter assumes that the original Digital Number (DN) value lies between the DN of the pixel of interest and the average DN of the moving kernel.
The equation of this lter is the following cubic
Eq. (5):
^I3 I^I2+ (^I DN) = 0; (6)
where:
^I : Sought value, I : Local mean, DN : Input value,
: The original image variance.
The ltering is controlled by both the variation coecient and the geometrical ratio operators extended to the line detection.
Moreover, ERDAS IMAGINE software with a gamma lter and a kernel size of 3 3 and 5 5 was used for studying the sensitivity of the algorithm to speckle noise. All steps of the algorithm from A to Z were applied on the above mentioned image. The obtained results are listed in Table 3, named \TSX-JAM-despeckled".
As can be seen in Table 3, no improvement was made in the RCC parameter by applying a gamma lter and/or reduction of speckle noise. Thereby, as was previously expected, it can be concluded that the abovementioned algorithm has no sensitivity to the existing speckle noise in the SAR images, and this insensitivity is due to the nature of the extracted features which use the information of neighboring pixels.
By taking into consideration the results obtained from numerical accuracy analysis, it can be concluded that the sensitivity of this algorithm is mainly focused on the detection of road areas, and that applying the spatial and spectral criteria in choosing proper road areas has added to the aforementioned sensitivity.
As usual, roads parallel to the incident direction are much more visible than the others. This inuence is particularly important in very dense urban structures, where nearly half of the road network is invisible to SAR sensors, due to shadowing and layover eects [5]. As shown in Figure 5(h), areas A1 to A4, which indicate regular rows of trees and probably traces of passing agricultural machinery, are detected as road areas. Furthermore, the algorithm is able to detect B1 to B2 areas, as previously undetected, due to one of these reasons:
Areas without suciently high contrast in compar-ison with their surroundings;
Areas completely covered by adjacent trees; or
Areas located at margins of the image.
Consequently, the results are strongly dependent on the width and visibility of roads in the input images.
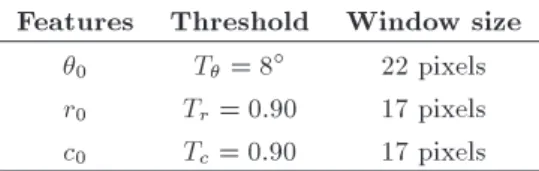
Table 4. Parameters for feature binarization. Features Threshold Window size
0 T= 8 22 pixels
r0 Tr= 0:90 17 pixels
c0 Tc= 0:90 17 pixels
The feature combination method is compared with the AND operator used by Negri [16], which was utilized considering the proper threshold values indexed in Table 4. The corresponding results are given in Table 3, under the names of \TSX-JAM-and" and \TSX-TORONTO-and".
The results of the proposed method have an improvement, in terms of RCC, as seen in Table 3. 4. Conclusion
Recovery of the road networks using the remote sensing of high resolution optical and SAR images has become a frequent application of these images. The candidate areas for roads were obtained in this study by surveying multiple feature extraction, based on the dierence between road pixels, compared to their surroundings, and then by combining them in a fuzzy method. The obtained results indicate the success of the algorithm in the detection of road areas in comparison with the method using a logical AND operator, as well as being insensitive to speckle noise. Also, the tests shown in this study allow an understanding of the potential of the presented method for applications where no detailed road extraction is required. It is, thus, possible to contribute to regularization of road areas using mathematical morphology functions and applying them to the nal image.
References
1. Henderson, F.M. and Xia, Z.-G. \SAR applications in human settlement detection, population estimation and urban and use pattern analysis: a status report", Geoscience and Remote Sensing, IEEE Transactions, 35(1), pp. 79-85 (1997).
2. Caltagirone, F., Spera, P., Vigliotti, R. and Manoni, G. \SkyMed/COSMO mission overview", in Geo-science and Remote Sensing Symposium Proceedings, IGARSS'98. 1998, IEEE International, pp. 683-685, IEEE (1998).
3. Tupin, F., Maitre, H., Mangin, F., Nicolas, J.-M. and Pechersky, E. \Detection of linear features in SAR images: application to road network extraction", Geoscience and Remote Sensing, IEEE Transactions, 36(2), pp. 434-453 (1998).
4. Jeon, B.-K., Jang, J.-H. and Hong, K.-S. \Road detection in spaceborne SAR images using a genetic
algorithm", Geoscience and Remote Sensing, IEEE Transactions, 40(1), pp. 22-29 (2002).
5. Tupin, F., Houshmand, B. and Datcu, M. \Road detection in dense urban areas using SAR imagery and the usefulness of multiple views", Geoscience and Remote Sensing, IEEE Transactions, 40(11), pp. 2405-2414 (2002).
6. Dell'Acqua, F., Gamba, P. and Lisini, G. \Improve-ments to urban area characterization using multitem-poral and multiangle SAR images", Geoscience and Remote Sensing, IEEE Transactions, 41(9), pp. 1996-2004 (2003).
7. Bentabet, L., Jodouin, S., Ziou, D. and Vaillancourt, J. \Road vectors update using SAR imagery: A snake-based method", Geoscience and Remote Sens-ing, IEEE Transactions, 41(8), pp. 1785-1803 (2003).
8. Wessel, B. \Road network extraction from SAR im-agery supported by context information", The In-ternational Archives of the Photogrammetry, Remote Sensing and Spatial Information Science, pp. 360-366 (2004).
9. Chen, Y., Gu, Y., Gu, J. and Yang, J. \Particle lter based road detection in SAR image", In Mi-crowave, Antenna, Propagation and EMC Technologies for Wireless Communications, 2005. MAPE 2005. IEEE International Symposium on, pp. 301-305, IEEE (2005).
10. Lisini, G., Tison, C., Tupin, F. and Gamba, P. \Feature fusion to improve road network extraction in high-resolution SAR images", Geoscience and Remote Sensing Letters, IEEE, 3(2), pp. 217-221 (2006).
11. Li, S.-Y., Yang, W., Yang, H. and Sun, H. \Road extraction from high resolution dual-polarization SAR images over urban areas", In International Conference on Earth Observation Data Processing and Analysis, pp. 72850Q-72850Q-72810, International Society for Optics and Photonics (2008).
12. Stilla, U. and Hedman, K. \Feature fusion based on Bayesian network theory for automatic road extrac-tion", In Radar Remote Sensing of Urban Areas, pp. 69-86, Springer (2010).
13. Hedman, K., Stilla, U., Lisini, G. and Gamba, P. \Road network extraction in VHR SAR images of urban and suburban areas by means of class-aided feature-level fusion", Geoscience and Remote Sensing, IEEE Transactions, 48(3), pp. 1294-1296 (2010).
14. Zhou, G., Cui, Y., Chen, Y., Yang, J., Rashvand, H. and Yamaguchi, Y. \Linear feature detection in polarimetric SAR images", Geoscience and Remote Sensing, IEEE Transactions, 49(4), pp. 1453-1463 (2011).
15. Liu, J., Sui, H., Tao, M., Sun, K. and Mei, X. \Road extraction from SAR imagery based on an improved particle ltering and snake model", International Jour-nal of Remote Sensing, 34(22), pp. 8199-8214 (2013).
\Junction-aware extraction and regularization of ur-ban road networks in high-resolution SAR images", Geoscience and Remote Sensing, IEEE Transactions, 44(10), pp. 2962-2971 (2006).
17. Zadeh, L.A. \Fuzzy algorithms", Information and Control, 12(2), pp. 94-102 (1968).
18. Mamdani, E.H. and Assilian, S. \An experiment in linguistic synthesis with a fuzzy logic controller", International Journal of Man-Machine Studies, 7(1), pp. 1-13 (1975).
19. Zimmermann, H.J., Fuzzy Set Theory and Its Applica-tions, Springer (2001).
20. Wiedemann, C. \External evaluation of road net-works", International Archives of Photogrammetry Remote Sensing and Spatial Information Sciences 34(3/W8), pp. 93-98 (2003).
21. Mansourpour, M., Rajabi, M.A. and Blais, J. \Eects and performance of speckle noise reduction lters on active radar and SAR images", in Proc. ISPRS, pp. 14-16 (2006).
Biographies
Mehdi Saati received his BS degree in Survey
Engi-neering and MS degree in Remote Sensing, in 2002 and 2006, respectively, from the Department of Geomatics Engineering at the College of Engineering, Tehran University, Iran, where he is currently a PhD degree candidate. His research interests include image pro-cessing, feature extraction from high resolution optical and radar images and deformable shape models. The updating of spatial data remains his greatest subject of interest.
Jalal Amini received a BS degree in Survey Engi-neering and an MS degree in Photogrammetry from K.N. Toosi University, Tehran, Iran, in 1993 and 1996, respectively, and a PhD degree in Photogrammetry and Remote Sensing from Tehran University, Iran, in 2001. He is currently Associate Professor in Remote Sensing and Photogrammetry in the Department of Geomatics Engineering at the College of Engineering, Tehran University, Iran. His research interests include auto-matic object extraction (roads) from aerial and satellite images, mathematical modeling of space images, mor-phology, neural networks, fuzzy sets, fractals, DEM, classication, alpha-shapes, oodplain delineation, and microwave remote sensing.