Sharif University of Technology
Scientia IranicaTransactions B: Mechanical Engineering www.scientiairanica.com
Energy and exergy analysis and optimization of a
-solar-driven combined ejector-cooling and power
system based on organic Rankine cycle using an
evolutionary algorithm
F.A. Boyaghchi
and P. Heidarnejad
Department of Mechanical Engineering, Faculty of Engineering & Technology, Alzahra University, Deh-Vanak, Tehran, P. Code: 1993893973, Iran.
Received 7 December 2013; received in revised form 25 May 2014; accepted 29 September 2014
KEYWORDS Energy; Exergy; CECP; Ejector; Optimization; GA.
Abstract. This paper proposes and investigates a Combined Ejector-Cooling and Power (CECP) system, using R123 as a working uid to utilize the solar energy over a low temperature range. Evacuated tube solar collectors are used to collect the solar radiation for their low costs. A thermal storage system and an auxiliary boiler are used to provide continuous cooling and power output when solar radiation is not sucient. Mathematical models are employed to simulate the system under steady-state conditions. The results obtained reveal that solar collector and auxiliary boiler are the main exergy destruction sources. Parametric analysis is conducted to examine the eects of some key thermodynamic parameters on the system performance. The results indicate that under the actual constraints, increasing turbine inlet pressure elevates system eciency while increasing turbine inlet temperature and turbine back pressure decreases that. The system is also optimized with the energy and exergy eciencies as objective functions by means of genetic algorithm under the given conditions.
© 2015 Sharif University of Technology. All rights reserved.
1. Introduction
Low temperature waste heat and renewable energies, such as solar and geothermal energies as low tem-perature heat sources are discussed extensively in the literature. These energies cannot be employed in the conventional power plants eciently. Recently, various and refrigeration cogeneration and power cycles have been proposed to utilize them in energy-ecient sys-tems. Goswami [1] proposed refrigeration cogeneration and power system for the low temperature heat sources
*. Corresponding author. Tel.: +98 21 88044040-2140; Fax: +98 21 88617537
E-mail addresses: [email protected] (F.A. Boyaghchi); [email protected] (P. Heidarnejad)
(< 200C). The proposed cycle integrated with the
Rankine cycle and the absorption refrigeration cycle. Many researchers [2-10] investigated the Goswami's proposed cycle both theoretically and experimentally. They found that the combined cycle proposed is suit-able for utilizing the low temperature heat sources eciently. However, the refrigeration capacity of the proposed cycle is relatively small, because the phase of the working uid does not change during the refriger-ation process. Various systems based on the combined power and absorption refrigeration cycle were provided by other researchers. Amano et al. [11,12] provided a hybrid power and refrigeration cycle that combined an ammonia-water power cycle and an absorption refrigeration cycle. The power cycle provided stronger solution to the refrigeration cycle rectier to elevate
refrigeration cycle performance. Zheng et al. [13,14] proposed a combined cycle using the cold water to decrease the condensing temperature of the Rankine cycle. Zhang et al. [15-18] proposed two combined power/refrigeration binary uid systems driven by the exhaust gas of a gas turbine: the parallel connected system and the series connected system. In the parallel system, and in the power subsystem, the concentration of working uid was fairly low, and the temperature match in the evaporation process was unsatisfactory. Moreover, Nord et al. [19] provided a Solar Integrated Thermal Management and Power (SITMAP) cycle, which integrates a jet pump instead of the compressor in vapor compression and a Rankine cycle. This cycle is designed for the spacecraft and driven by the solar energy collecting the solar radiation using a concentra-tion solar collector. Overall mass system is chosen as the objective function to be minimized. Wang et al. [20] analyzed and simplied Zhang's parallel connected sys-tem in Ref. [15] to make it better for low-sys-temperature heat sources. They eliminated the recuperator, high-pressure pump, and condenser in the power generation cycle. However, the turbine outlet steam still reached 97C, and a large exergy loss occurred during the
absorption-condensation process. Wang et al. [21] improved their cycle by applying an ejector between the condenser and rectier. However, the plant exergy eciency was improved by only 0.6% and the heat loss in the turbine was not recovered. Jawahar et al. [22] proposed a combined cooling and power cycle by intro-ducing an expander into the generator absorber heat exchanger cooling cycle (GAX cycle). The expander is applied between the absorber and High-Pressure-Generator-Absorber-exchanger (HPGAX). The cooling and power cogeneration cycles are parallel, using the same vapor from the HPGAX.
This study thus aims to (1) propose a combined ejector cooling and power system driven by solar energy; (2) evaluate the thermodynamic performance of the proposed system; (3) identify the main sources of exergy destruction components; (4) study the key parameters on system performance; and (5) optimize the energetic and exergetic eciencies of cycle using the Genetic Algorithm (GA).
2. System description
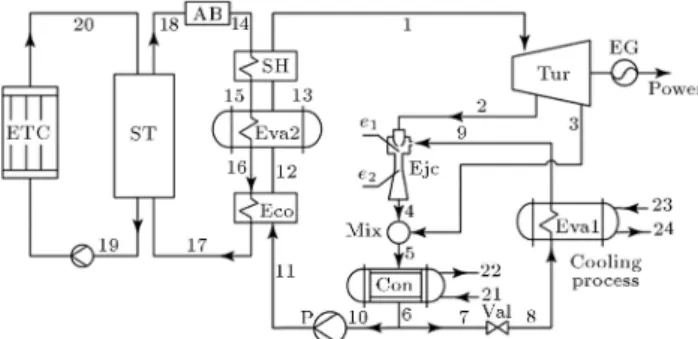
The CECP system proposed in this study is divided into two subsystems: Organic Rankine Cycle (ORC) subsystem and solar collector subsystem. Figure 1 illustrates schematic diagram of this system.
2.1. Organic rankine cycle subsystem
ORC subsystem consists of a turbine (Tur), an ejector (Ejc), two evaporators (Eva), a condenser (Con), a pump (p), an economizer (Eco) and a super heater
Figure 1. Schematic diagram of CECP system.
(SH). The saturated liquid is pumped into economizer and, after superheating in super heater, produces power in the turbine connected to the electric gen-erator. The extracted vapor of the turbine enters the supersonic nozzle of ejector. The very high velocity vapor at the exit of the nozzle produces a high vacuum at the inlet of the mixing chamber and entrains secondary vapor into the chamber from the evaporator. The two streams are mixed in the mixing chamber. Then the mixed stream becomes a transient supersonic stream. One entering the constant cross-section zone, a normal shock wave occurs, accompanied by a signicant pressure rise. After the shock, the velocity of the mixed stream becomes subsonic and decelerates in the diuser. The outlet stream from ejector is mixed with turbine outlet in mixer (Mix) and discharged to the condenser to convert to liquid by rejecting heat to cooling water.
2.2. Solar collector subsystem
The major components of solar collector subsystem are an evacuated tube solar collector, thermal Storage Tank (ST) and Auxiliary Boiler (AB). The main energy source of the whole system is evacuated tube solar collector. The auxiliary boiler is installed as the backup energy source and it is used when the temperature of the thermal storage is lower than allowable tempera-ture; on the other hand, thermal storage is used when solar radiation is insucient. Evacuated tube solar collector for its low cost and easy installation is used. 3. Simulation and analysis of the systems Thermodynamic modeling of the solar CECP system has been conducted based on simulation code in Engi-neering Equation Solver (EES) [23].
3.1. Assumptions
For simplifying the theoretical analysis following as-sumptions are made:
1. The system reaches a steady state, and pressure drops in pipes, vapor generator, evaporator and heat exchanger are neglected.
3. The condenser outlet state is saturated liquid, and outlet state of evaporator is saturated vapor. 4. The pumps and the turbine have a given isentropic
eciencies.
5. All of the potential and kinetic exergies are ignored. 6. The fuel injected to the auxiliary boiler is natural
gas.
3.2. Thermodynamic analysis
In order to simulate the system, the principles of mass and energy conservation are used. Neglecting the kinetic and potential energies, the general equations of these principles for a steady state process are specied as [24]:
Mass conservation: X
mi=
X
me: (1)
Energy conservation: X
Q XW =Xmehe
X
mihi: (2)
Here, Q denotes the heat transfer rate and W the work transfer rate. These equations are applied to each component of the systems.
3.2.1. Organic Rankine Cycle (ORC) subsystem ORC subsystem includes turbine, two evaporators, two pumps, heater, economizer, super heater, condenser, two mixers, valve and ejector. The conservation of mass and energy principle applied to each component can be expressed as follows:
Tur:
m1= m2+ m3; (3)
WTurb= m1h1 (m2h2+ m3h3); (4)
is;Turb= WWTurb
is;Turb: (5)
Eva1:
m8= m9; (6)
QCL= m8(h9 h8): (7)
Eva2:
m12= m13; (8)
m15= m16; (9)
m12(h13 h12) = m15(h15 h16): (10)
P:
m11= m10; (11)
Wp= m1010(P11 P10)=is;p: (12)
Eco:
m11= m12; (13)
m16= m17; (14)
m11(h12 h11) = m16(h16 h17): (15)
SH:
m13= m1; (16)
m14= m15; (17)
m13(h1 h13) = m14(h14 h15): (18)
Con:
m5= m6; (19)
QCond= m5(h5 h6): (20)
Mix:
m3+ m4= m5; (21)
m3h3+ m4h4= m5h5: (22)
Val:
m7= m8; (23)
h7= h8: (24)
Ejector is the signicant component in this system, and its performance is dependent upon entrainment ratio which determines the magnitude of mass ow rate of secondary refrigerant in terms of mass ow rate of primary refrigerant coming out from the turbine. Its model has been carried out based on the one-dimensional constant pressure model which is used by most researchers [25,26]. Some assumptions to model the ejector are as follows:
1. The working uid and the second uid will not mix until they reach the mixing chamber;
2. The velocity of the uid into ejector and the velocity of the uid out of diuser are neglected, because they are much lower than the velocity of the uid in mixing chamber;
3. The working uid ow is one-dimensional and ow is steady state;
4. The kinetic energy at the inlets of primary and suction ports and the exit of diuser are negligible; 5. The inner wall of the ejector is adiabatic;
6. For simplicity in deriving the model, the eects of frictional and mixing losses are taken into account by using isentropic eciencies and needs to be de-termined experimentally. The eciencies of nozzle, mixing and diuser sections eciencies are assumed to be 0.9, 0.85 and 0.85, respectively [25,26]; 7. Mixing is assumed to occur at constant pressure
over a short distance in the mixing chamber. Based on above assumptions, mass and energy equa-tions and detailed mathematical model for ejector are given by [27]:
m2+ m9= m4; (25)
m2h2+ m9h9= m4h4: (26)
It is known that the performance of ejector is evaluated by its entrainment ratio, , and given as:
=mm9
2; (27)
=qnmdif(h2 he1;s)=(h4;s he2) 1: (28)
When the inlet state parameters of primary ow, secondary ow and back pressure of the ejector are given, the value of entrainment ratio could be found using iterative calculation.
3.2.2. Solar collector subsystem
The useful heat gained by solar collector, Qu is
calcu-lated from the heat balance in the solar collector [28]:
Qu= Coll AColl Gt; (29)
where Coll is dened as the ratio of the useful heat
gain to the incident solar radiation. Solar collector eciency can be calculated using the following thermal performance equations [29]:
Coll= o
Ta T0
Gt
a1
(Ta T0)2
Gt
a2:
(30) a1 and a2 are the heat loss coecient and is adopted
from product specication sheet of the selected collec-tor [30]. To predict the performance of a solar system, instantaneous values of radiation (Gt) are required.
The total instantaneous solar radiation on tilted surface is obtained from the relations [28]:
Gt= GbRb+ GdRd+ (Gb+ Gd)RR; (31)
Gb = G Gd: (32)
Rb, Rd and RR are calculated from [28]:
Rb= sin sin(L ) + cos cosh cos(L )sin L sin + cosL cos cos(!) ; (33)
Rd= 1 + cos 2 ; (34)
RR=
1 cos 2
: (35)
The diuse to total radiation ratio for a horizontal surface is expressed with the equation [28]:
Hd
H = 1:311 3:022 KT+ 3:427 KT2 1:821 KT3: (36) For extracting hourly values from daily values, two correlations are usually used:
Liu and Jordan correlation [28]: rd = 24
cos(!) cos(!
ss)
sin(!ss) 2!360sscos(!ss): (37)
Collares Pereira and Rabl correlation [28]: r = 24( + cos(!)) cos(!) cos(!ss)
sin(!ss) 2!360sscos(!ss)(38);
= 0:409 + 0:5016 sin(!ss 60);
= 0:6609 0:4767 sin(!ss 60):
In this system, we use a sensible thermal storage system to store the collected solar energy. To simplify the model, it is assumed that the water in the insulated water storage tank is completely mixed with the water following back into the tank from the collector and the economizer. Moreover, we assume that the ambient temperature T0 is constant and the loss of the water
tank is considered. The equation for the energy balance in the tank is then [31]:
m20cp(T20 T19) = m17cp(T18 T17) + QL;ST: (39)
Mass and energy equations for auxiliary heater are:
m18= m14; (40)
mfLHVfAB = m18cp(T14 T18); (41)
QAB= mfLHVfAB: (42)
Overall system:
Welec= (WTurb Wp) gen; (43)
CECP= WQelec+ QCL
SF = Qu
Qu+ QAB: (45)
Exergy is the maximum work which can be obtained from a given form of energy using the environmental parameters as the reference state [32]. In the other words, it is an attribute of the system and environment together. In the absence of nuclear, magnetic, electrical and surface tension eects, the total exergy of a system X can be divided into four components: physical exergy, XP H, kinetic exergy, XKN, potential exergy,
XP T, and chemical exergy, XCH [33]:
X = XP H+ XKN+ XP T + XCH: (46)
In this study, the kinetic and potential exergy are assumed to be negligible as the elevation and speed have negligible changes. Applying the rst and the second law of thermodynamics, the exergy balance is obtained as [34]:
XQ+
X
i
mixi =
X
e
mexe+ XW+ XD; (47)
XQ =
1 TT0
Q; (48)
XW = W; (49)
where XQ and XW are the corresponding exergy of
heat transfer and work which across the boundaries of the control volume. The exergy destruction rate and the exergy eciency for each component for the whole system are shown in Table 1.
The exergy inputs to the system come from sun and natural gas, which is used in auxiliary boiler, given for sun as [35]:
Xs= GtAColl 1 + 13
T0
Ts
4 4 3
T0
Ts
!
; (50)
in which Tsis taken to be 6000 K, and:
Xf = mfxf; (51)
for natural gas, in which xf is considered to be 51393
kJ kg 1.
4. Inputs of the system simulation
Simulation of the solar CECP system is conducted based on some inputs which are shown in Table 1. R123 is selected as working uid because it could prove to be the suitable working uid for ORC system due to its high system performance and low operating pressure. Moreover it is nontoxic, nonammable and non-corrosive [31,36]. The Ozone Depletion Potential (ODP) and Global Warning Potential (GWP) of R123 are 0.020 and 77 years respectively [31]. Water is used as medium in evacuated solar collector and as storage liquid in heat storage tank.
In this study, electricity, cooling and heating load of a hypothetical one-oor building which is located in Urmia city (37.4N, 45.3E), Iran, is calculated. Urmia temperature is variable between -6.32C and 25.87C
in a year and maximum and minimum daily insolation on a horizontal surface is 9.13 and 0.83 kWh m 2
day 1 [37]. The modeling is conducted based on
maximum and minimum daily insolation incident on horizontal surface which occurs on July 17th. Monthly average insolation incident on horizontal surface value is shown in Table 2.
The required collector area is specied based on meteorological data extracted from NASA internet site [37].
Table 1. Exergy destruction rate and eciency for system components.
Component Exergy destruction rate Exergy eciency
Tur XD;Tur= m1x1 m2x2 m3x3 WTurb "Tur= 1 m1x1XmD;Tur2x2 m3x3
Ejc XD;Ejc= m2x2+ m9x9 m4x4 "Ejc= 1 m2Xx2D;Ejc+m9x9
Eva1 XD;Eva1= m8x8+ m23x23 m9x9 m24x24 "Eva1= 1 m8Xx8D;Eva1+m23x23
Eva2 XD;Eva2= m15x15+ m12x12 m16x16 m13x13 "Eva2= 1 m15Xx15D;Eva2+m12x12
P XD;p= Wp+ m10x10 m11x11 "p= 1 XWD;pp
Eco XD;Eco= m16x16+ m11x11 m12x12 m17x17 "Eco= 1 m16xX16D;Eco+m11x11
SH XD;SH= m14x14+ m13x13 m15x15 m1x1 "SH= 1 m13xX13DSH+m14x14
Con XD;Con= m5x5+ m21x21 m6x6 m22x22 "Con= 1 m5xX5D;Con+m21x21
AB XD;AB= Xf+ m18x18 m14x14 "AB= 1 XXDABf
ST XD;ST= m20x20+ m17x17 m18x18 m19x19 XL;ST "ST= 1 mX20DSTx20+m+XLST17x17
ETC XD;ETC= Xs+ m19x19 m20x20 "ETC= 1 XDETCXs
Table 2. Input data for the system. ORC subsystem
Dead state temperature 15C
Dead state pressure 100 kPa Turbine inlet pressure 1000 kPa Turbine inlet temperature 130C
Ejector back pressure 91.48 kPa mass ow extraction ratio 0.5 Turbine isentropic eciency 0.85 Evaporation temperature -5C
Pump isentropic eciency 0.7 Cooling water inlet pressure 300 kPa Cooling water inlet temperature 15C
Cooling water mass ow 0.4 kg s 1
Cooling load 4.5 kW
Heating load
-Power 2.7 kW
Electrical generator eciency 0.95 Pinch point temperature dierence 5C
Solar subsystem
Monthly average insolation, H 28.5 MJ m 2day 1
Monthly averaged insolation clearness index, KT
0.7
Tilt angle () 37.4
Optical eciency, 0 0.656
Coecient, a1 1.4 W m 1 K 1
Coecient, a2 0.007 W m 1 K 1
5. Results
Before starting this section, the model suggested in this study was validated with the model presented elsewhere [38]. Validation has been conducted by comparison of some important parameters such as mass ow rate, temperature and pressure as shown in Table 3. As illustrated in the table, model validation against Ref. [38] has shown a good agreement for se-lected points. Normalized root-mean-square deviation for mass ow rate, temperature and pressure of selected points was calculated and achieved 0.12%, 5.6% and 1.72%, respectively.
In this section, the result of energy and exergy modeling of the proposed CECP system are presented and discussed. In this study, the eects of the turbine inlet pressure, turbine inlet temperature and turbine back pressure on system eciencies and components exergy destruction rates are examined and discussed. Solar collector, auxiliary boiler, economizer and ejector are chosen for discussion because they have higher ex-ergy destruction rates in comparison to others. Table 4 shows the result of system simulation. Table 5 shows the performance of the system. It is found that energy
Figure 2. Components exergy destruction rate in CECP cycle.
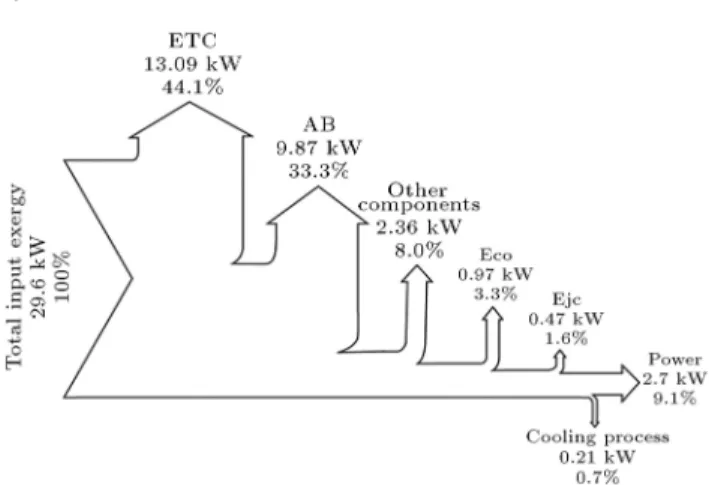
Figure 3. The Grassman diagram of components exergy destruction as a percentage of total input exergy
(Xin;t= 29:6 kW).
and exergy eciencies of the proposed CECP system are 24.4% and 9.8%, respectively.
5.1. Overall eciency and exergy destruction The solar CECP system components exergy destruction rates, exergy eciencies and their percentages as total exergy destructed and total exergy input are shown in Table 6. Table 6 and Figures 2 and 3 illustrate that solar collector and auxiliary boiler are the major sources of exergy destruction. The solar collector destroys 13.09 kW (49.9% of total exergy destruction and 44.2% of total exergy input) and the auxiliary boiler destroys 9.87 kW (37.6% of total exergy destruction and 33.3% of total exergy input). In contrast, the exergy destructed by remaining components is lower. In gure 3, the Grassmann diagram demonstrates that power and cooling load exergies are 9.1% and 0.7% of total exergy input. Moreover, it indicates that the most signicant components that have high destruction rates in system are solar collector and auxiliary boiler. Therefore, careful design and selection of these two components are essential in designing a solar CECP system. 5.2. Eect of turbine inlet pressure
The eect of turbine inlet pressure on CECP system eciencies and components exergy destruction rates is
Table 3. Comparison between the model and the literature.
m (kg s 1) T (C) P (kPa)
Literature Mo
del
Dierence
%
Literature Mo
del
Dierence
%
Literature Mo
del
Dierence
%
1 4.549 4.66 2.40% 130 130 0% 700 700 0%
2 1.765 1.817 2.95% 98.98 98.98 0% 220 220 0%
3 2.647 2.843 7.40% 78.73 84.69 7.60% 91.4 109.7 20% 4 1.902 1.959 3% 89.88 90.33 0.50% 91.4 109.7 20% 5 4.549 4.802 5.56% 83.41 87 4.30% 91.4 109.7 20%
6 4.549 4.802 5.56% 25 30 20% 91.4 109.7 20%
7 0.137 0.1418 3.50% 25 30 20% 91.4 109.7 20%
8 0.137 0.1418 3.50% -5 -5 0% 25.8 25.9 0.40%
9 0.137 0.1418 3.50% -5 -5 0% 25.8 25.9 0.40%
10 4.549 4.66 2.44% 25 30 20% 91.4 109.7 20%
11 4.549 4.66 2.44% 25.35 30.34 19.70% 700 700 0%
14 20 20 0% 140 140 0% 700 700 0%
17 20 20 0% 98.24 127 29.30% 700 700 0%
21 100 100 0% 20 20 0% 101 101 0%
22 100 100 0% 21.94 22.4 2.10% 101 101 0%
NRMSD 0.12% 5.6% 1.72%
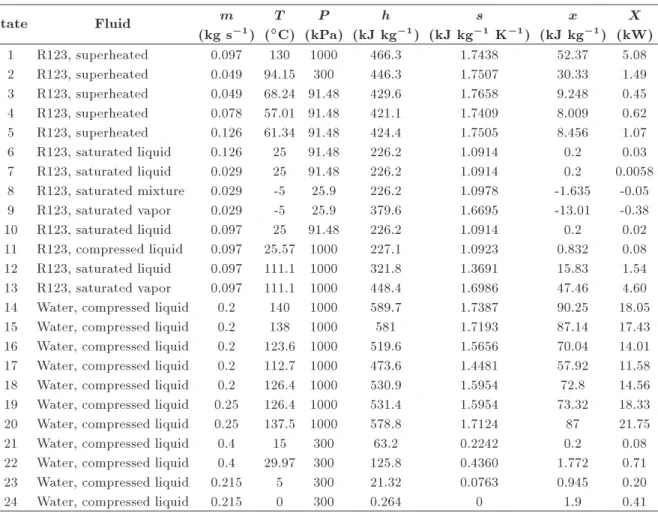
Table 4. Result of system simulation.
state Fluid m
(kg s 1)
T (C)
P (kPa)
h (kJ kg 1)
s (kJ kg 1 K 1)
x (kJ kg 1)
X (kW)
1 R123, superheated 0.097 130 1000 466.3 1.7438 52.37 5.08
2 R123, superheated 0.049 94.15 300 446.3 1.7507 30.33 1.49
3 R123, superheated 0.049 68.24 91.48 429.6 1.7658 9.248 0.45 4 R123, superheated 0.078 57.01 91.48 421.1 1.7409 8.009 0.62 5 R123, superheated 0.126 61.34 91.48 424.4 1.7505 8.456 1.07 6 R123, saturated liquid 0.126 25 91.48 226.2 1.0914 0.2 0.03 7 R123, saturated liquid 0.029 25 91.48 226.2 1.0914 0.2 0.0058 8 R123, saturated mixture 0.029 -5 25.9 226.2 1.0978 -1.635 -0.05 9 R123, saturated vapor 0.029 -5 25.9 379.6 1.6695 -13.01 -0.38 10 R123, saturated liquid 0.097 25 91.48 226.2 1.0914 0.2 0.02 11 R123, compressed liquid 0.097 25.57 1000 227.1 1.0923 0.832 0.08 12 R123, saturated liquid 0.097 111.1 1000 321.8 1.3691 15.83 1.54 13 R123, saturated vapor 0.097 111.1 1000 448.4 1.6986 47.46 4.60 14 Water, compressed liquid 0.2 140 1000 589.7 1.7387 90.25 18.05 15 Water, compressed liquid 0.2 138 1000 581 1.7193 87.14 17.43 16 Water, compressed liquid 0.2 123.6 1000 519.6 1.5656 70.04 14.01 17 Water, compressed liquid 0.2 112.7 1000 473.6 1.4481 57.92 11.58 18 Water, compressed liquid 0.2 126.4 1000 530.9 1.5954 72.8 14.56 19 Water, compressed liquid 0.25 126.4 1000 531.4 1.5954 73.32 18.33 20 Water, compressed liquid 0.25 137.5 1000 578.8 1.7124 87 21.75
21 Water, compressed liquid 0.4 15 300 63.2 0.2242 0.2 0.08
22 Water, compressed liquid 0.4 29.97 300 125.8 0.4360 1.772 0.71 23 Water, compressed liquid 0.215 5 300 21.32 0.0763 0.945 0.20
examined through Figures 4 and 5. It can be observed that both energy and exergy eciencies increase as turbine inlet pressure increases while required collector area decreases. Energy eciency improves within 53% because of decrement of heat provided by solar collector; exergy eciency has the same improvement
Figure 4. Eect of turbine inlet pressure on the energy and exergy eciencies of the system.
Table 5. Result of thermodynamic simulation. Required collector surface area (m2) 15.31
Turbine inlet mass ow rate (kg s 1) 0.097 Ejector entrainment ratio 0.6 Total heat required (kW) 23.22 Total exergy input (kW) 29.6
Thermal eciency (%) 24.4
Exergy eciency (%) 9.8
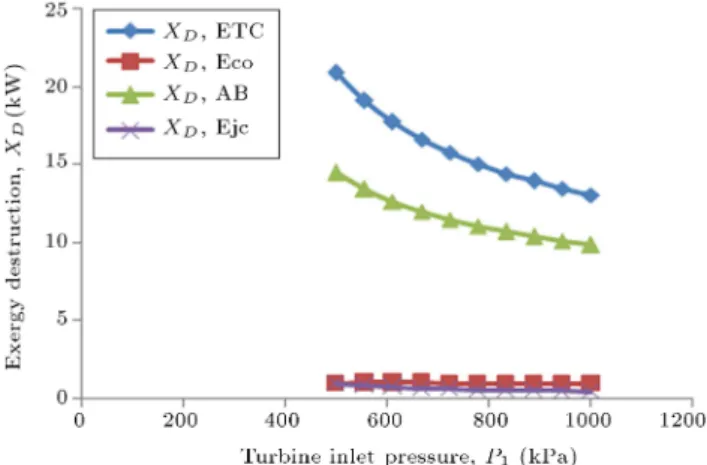
Figure 5. Eect of turbine inlet pressure on components exergy destruction rates.
due to the decrement of components exergy destruc-tions. Figure 5 demonstrates that solar collector and auxiliary boiler exergy destruction rate is more sensitive to turbine inlet pressure in comparison to economizer and ejector exergy destruction rates. The sensitivity is because solar exergy increases widely because of changes in collector area, and consequently solar collector exergy destruction rate drops from 20.9 kW to 13 kW. In auxiliary boiler, this variation is owing to decrement in auxiliary boiler inlet and outlet exergy dierence, while economizer and ejector exergy destruction rates are almost constant because of slight changes in the exergy streams.
5.3. Eect of turbine inlet temperature
The eect of turbine inlet temperature on CECP system eciencies, and components exergy destruction
Table 6. Comparative result of exergy analysis of components. Components Exergy destruction
rate, XD (kW)
Exergy eciency (%)
XD;c=XD;t
(%)
XD;c=Xin;t
(%)
Tur 0.40 87 1.5 1.4
Ejc 0.47 57 1.8 1.6
Eva1 0.13 62 0.5 0.4
Evap2 0.35 90 1.3 1.2
P 0.02 71 0.08 0.1
Eco 0.97 60 3.7 3.3
SH 0.15 77 0.6 0.5
Con 0.41 60 1.6 1.4
Mix 0.004 - 0.02 0.01
Va 0.05 - 0.2 0.2
EG 0.14 95 0.5 0.5
AB 9.87 65 37.6 33.3
ST 0.18 99 0.7 0.6
ETC 13.09 21 49.9 44.2
-Figure 6. Eect of turbine inlet temperature on the energy and exergy eciencies of the system.
Figure 7. Eect of turbine inlet temperature on components exergy destruction rate.
rates is illustrated through Figures 6 and 7. Figure 6 reveals that increment turbine inlet temperature de-creases energy and exergy eciencies of the system within 50%. Energy eciency decreases because of increasing the requirement of total heat provided, and exergy eciency decreases due to components exergy destruction rates increment. Figure 7 illustrates the eect turbine inlet temperature on components exergy destruction rates. As the turbine inlet temperature increases, auxiliary boiler exergy destruction rate in-creases. By increasing turbine inlet temperature, auxiliary boiler outlet temperature increases, therefore both outlet exergy stream of the auxiliary boiler and the amount of fuel required in the auxiliary boiler increase, but the increment in the product exergy of the auxiliary boiler is more than in fuel exergy, and as a result exergy destruction rate increases. Solar collector exergy destruction rate remains almost constant due to consistency in collector area and as a result in solar exergy. Ejector exergy destruction rates decreases within 19% due to decrement in outlet exergy stream of ejector. Economizer exergy
destruc-Figure 8. Eect of turbine back pressure on energy and exergy eciencies of the system.
Figure 9. Eect of turbine back pressure on components exergy destruction rates.
tion increases from 0.97 kW to 1.3 kW because of increasing of dierence between inlet and outlet exergy streams.
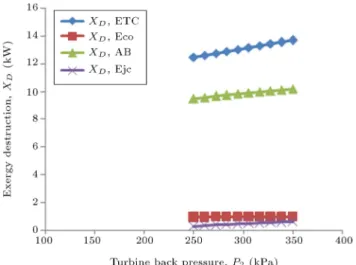
5.4. Eect of turbine back pressure
In this subsection, CECP system eciencies, required collector area and components exergy destruction rates versus turbine back pressure variations are investigated through Figures 8 and 9. The study shows that increasing turbine back pressure decreases energy and exergy eciencies slightly. Energy eciency decreases within 8% due to slight change in total heat required, and exergy eciency also decreases within 8% because of slight change in components exergy destruction rates.
Figure 9 illustrates the variation of components exergy destruction rate against turbine back pressure variation. It is revealed that increasing turbine back pressure increases all components exergy destruction rates slightly.
6. Optimization method using genetic algorithm
The genetic algorithm is based on the natural selection theory in the biological genetic progress developed by Charles Darwin and introduced rstly by John Holland [39]. In the GA, every parameter is considered as a gene and a solution is considered as a chromo-some and they are encoded as binary numbers. A population of variable chromosome like structure is built by various combinations of genes. A group of chromosomes are given, which is called the original population, before the GA theory is applying. The better approximations in the original population gen-erate a new generation and the better approximations to potential results are selected as the new population. Then the new population continues to generate next generation and stops when the population converges to the optimal result. In the GA, the tness function evaluates the tness value, and large tness value results better adaptability of the chromosome-like structure. In this investigation, the energetic and exergetic system eciencies are chosen as the tness function.
7. Optimization results
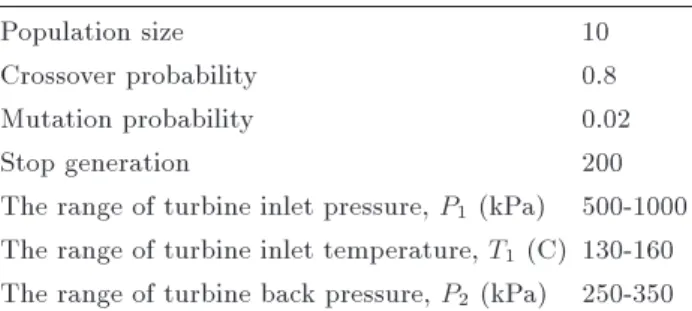
Table 7 indicates the various key thermodynamic parameters and the operation parameters of GA, in this solar-driven ejector cooling and power system. The maximum and minimum values of turbine inlet pressure is set to be 500-1000 kPa to enable the system to operate stably and the range of inlet temperature of turbine 130-160C. Table 8 represents the results
of parameter optimization for the optimum values of objective functions. It is found that to achieve the optimal energetic and exergetic eciencies, separately, turbine inlet pressure is close to the maximum value
Table 7. Parameter optimization in GA.
Population size 10
Crossover probability 0.8
Mutation probability 0.02
Stop generation 200
The range of turbine inlet pressure, P1(kPa) 500-1000
The range of turbine inlet temperature, T1(C) 130-160
The range of turbine back pressure, P2 (kPa) 250-350
Table 8. Optimization results of solar driven CECP system.
Objective function P1 (kPa) T1 (C) P2 (kPa)
CECP (%) 25.43 998.7 130.03 252.3 "CECP (%) 10.18 999.5 130.06 255.2
and turbine inlet temperature and back pressure are close to their saturated values. In the other words, under the actual constraints, a higher turbine inlet pressure with low temperature vapor state in turbine outlets could obtain a better system performance of solar driven ejector cooling and power generation sys-tem.
8. Conclusion
In this study, a solar CECP system is proposed for specied amount of electricity and cooling. Required collector area and solar fraction are calculated con-sidering day in July maximum monthly average daily radiation. Energy and exergy analysis of this system is conducted. Moreover overall exergy destruction rate of system and each component is calculated. Performance of system is examined by varying key parameters such as turbine inlet pressure, turbine inlet pressure and turbine back pressure. Finally, genetic algorithm is employed to conduct the parameter optimization with the exergy eciency as its objective function. The following remarks can be concluded from this study:
Energy and exergy eciencies of the system are calculated to be 24.4% and 9.8%, respectively. Amount of required collector area and solar fraction
are calculated to be 16.32 m2 and 0.5, respectively.
It is found that, auxiliary boiler and solar collector are the main exergy destruction sources. Thus for increasing system exergetic performance it is essential to have careful design of these components. Energy and exergy eciencies may improve up to 53% by increasing turbine inlet pressure, while they decrease down to 50% by increasing turbine inlet temperature and 8% by increasing turbine back pressure.
Exergy destruction rates of solar collector and aux-iliary boiler decreases by increasing the turbine inlet pressure, while it increases by increasing turbine inlet temperature and turbine back pressure. Optimization of the system using GA improves the
energy and exergy eciencies up to 25.43% and 10.18%, respectively.
Nomenclature
A Surface area of solar collector, m2
Cp Specic heat, kJ kg 1K 1
G Total instantaneous radiation, W m 2
h Specic enthalpy, kJ kg 1
KT Monthly average clearness index
L Latitude,
LHV Lower Heating Value, kJ
m Mass ow rate, kg s 1
N Day number
P Pressure, kPa
Q Heat, kW
R Tilt factor
W Power, kW
x Specic exergy, kJ kg 1
X Exergy rate, kW
Subscripts
a Average
b Beam
CH Chemical
CL Cooling load
D Destruction
d Diuse
dif Ejector diuser
e Exit
e1 Outlet of the ejector nozzle e2 Mixing section of the ejector
f Fuel
i Inlet
is Isentropic
KN Kinetic
L Loss
m Ejector mixer
NRMSD Normalized Root-Mean-Square Deviation
n Ejector nozzle
O Extraterrestrial
PH Physical
PT Potential
R Reected
s Sun
sc Solar constant, W/m2
SS sunset
t Tilt
u Useful
0 Dead state
Greek symbols
Ground albedo
Thermal eciency (%)
" Exergy eciency (%)
Declination angle,
Slope angle of the collector,
Specic volume, m3/kg
! Hour angle,
Entrainment ratio
References
1. Goswami, D. \Solar thermal power: Status of tech-nologies and opportunities for research, heat and mass transfer", 2nd ASME-ISHMT Heat and Mass Transfer Conference, Tata-McGraw Hill Publishers, New Delhi, India, pp. 57-60 (1995).
2. Yogi Goswami, D. \Solar thermal power technology: present status and ideas for the future", Energy Sources, 20(2), pp. 137-145 (1998).
3. Xu, F., Yogi Goswami, D. and S. Bhagwat, S. \A combined power/cooling cycle", Energy, 25(3), pp. 233-246 (2000).
4. Vijayaraghavan, S. and Goswami, D.Y. \On eval-uating eciency of a combined power and cooling cycle", ASME 2002 International Mechanical Engi-neering Congress and Exposition, American Society of Mechanical Engineers, pp. 287-295 (2002).
5. Hasan, A.A. and Goswami, D. \Exergy analysis of a combined power and refrigeration thermodynamic cycle driven by a solar heat source", Journal of Solar Energy Engineering, 125(1), pp. 55-60 (2003).
6. Lu, S. and Goswami, D.Y. \Optimization of a novel combined power/refrigeration thermodynamic cycle", ASME Solar 2002: International Solar Energy Confer-ence, American Society of Mechanical Engineers, pp. 75-82 (2002).
7. Tamm, G. and Goswami, D.Y. \Novel combined power and cooling thermodynamic cycle for low temperature heat sources. Part II: Experimental investigation", Journal of Solar Energy Engineering, 125(2), pp. 223-229 (2003).
8. Tamm, G., Hasan, A.A., Goswami, D.Y. and Lu, S. \Novel combined power and cooling thermody-namic cycle for low temperature heat sources. Part I: Theoretical investigation", Journal of Solar Energy Engineering, 125(2), pp. 218-222 (2003).
9. Sadrameli, S. and Goswami, D. \Optimum operating conditions for a combined power and cooling thermo-dynamic cycle", Applied Energy, 84(3), pp. 254-265 (2007).
10. Padilla, R.V., Demirkaya, G., Goswami, D.Y., Ste-fanakos, E. and Rahman, M.M. \Analysis of power and cooling cogeneration using ammonia-water mixture", Energy, 35(12), pp. 4649-4657 (2010).
11. Amano, Y., Suzuki, T., Hashizume, T., Akaiba, M., Tanzawa, Y. and Usui, A. \A hybrid power generation and refrigeration cycle with ammonia-water mixture",
Proceedings of 2000 International Joint Power Gener-ation Conference, Miami, pp. 23-26 (2000).
12. Takeshita, K., Amano, Y. and Hashizume, T. \Demon-stration of a hybrid power and refrigeration ammonia-water cycle", ASME Turbo Expo 2006: Power for Land, Sea, and Air, American Society of Mechanical Engineers, pp. 469-474 (2006).
13. Zheng, D., Chen, B., Qi, Y. and Jin, H. \Thermo-dynamic analysis of a novel absorption power/cooling combined-cycle", Applied Energy, 83(4), pp. 311-323 (2006).
14. Zheng, D.-X., Chen, B., Qi, Y. and Jin, H.-G. \A thermodynamic analysis of a novel absorption power/cooling combined cycle", Journal of Engineer-ing Thermophysics, 23(5), pp. 539-542 (2002).
15. Zhang, N., Cai, R. and Lior, N. \A novel ammonia-water cycle for power and refrigeration cogenera-tion", ASME 2004 International Mechanical Engineer-ing Congress and Exposition, American Society of Mechanical Engineers, pp. 183-196 (2004).
16. Zhang, N. and Lior, N. \Methodology for thermal design of novel combined refrigeration/power binary uid systems", International Journal of Refrigeration, 30(6), pp. 1072-1085 (2007).
17. Zhang, N. and Lior, N. \Development of a novel combined absorption cycle for power generation and refrigeration", Journal of Energy Resources Technol-ogy, 129(3), pp. 254-265 (2007).
18. Liu, M. and Zhang, N. \Proposal and analysis of a novel ammonia-water cycle for power and refrigeration cogeneration", Energy, 32(6), pp. 961-970 (2007).
19. Nord, J., Lear, W., and Sherif, S. \Analysis of heat-driven jet-pumped cooling system for space ther-mal management", Journal of Propulsion and Power, 17(3), pp. 566-570 (2001).
20. Wang, J., Dai, Y. and Gao, L. \Parametric analysis and optimization for a combined power and refriger-ation cycle", Applied energy, 85(11), pp. 1071-1085 (2008).
21. Wang, J., Dai, Y., Zhang, T. and Ma, S. \Paramet-ric analysis for a new combined power and ejector-absorption refrigeration cycle", Energy, 34(10), pp. 1587-1593 (2009).
22. Jawahar, C., Saravanan, R., Bruno, J.C. and Coronas, A. \Simulation studies on gax based Kalina cycle for both power and cooling applications", Applied Thermal Engineering, 50(2), pp. 1522-1529 (2013).
23. http://www.fchart.com, Engineering Equation Solver (EES).
24. Cengel, A.Y. and Boles, M.A., Thermodynamics: An Engineering Approach, McGraw Hill, New York, (2008).
25. Ouzzane, M. and Aidoun, Z. \Model development and numerical procedure for detailed ejector analysis and
design", Applied Thermal Engineering, 23(18), pp. 2337-2351 (2003).
26. Huang, B.J., Chang, J.M., Wang, C.P. and Petrenko, V.A. \A 1-D analysis of ejector performance", Inter-national Journal of Refrigeration, 22(5), pp. 354-364 (1999).
27. Dai, Y., Wang, J. and Gao, L. \Exergy analysis, parametric analysis and optimization for a novel com-bined power and ejector refrigeration cycle", Applied Thermal Engineering, 29(10), pp. 1983-1990 (2009).
28. Kalogirou, S., Solar Energy Engineering: Processes and Systems, Elsevier, UK (2009).
29. Zhang, W., Ma, X., Omer, S.A. and Riat, S.B. \Optimum selection of solar collectors for a solar-driven ejector air conditioning system by experimental and simulation study", Energy Conversion and Man-agement, 63(0), pp. 106-111 (2012).
30. http://www.apricus.com.au/downloads/, Apricus Col-lector Specications.
31. Wang, M., Wang, J., Zhao, Y., Zhao, P. and Dai, Y. \Thermodynamic analysis and optimization of a solar-driven regenerative organic Rankine cycle (ORC) based on at-plate solar collectors", Applied Thermal Engineering, 50(1), pp. 816-825 (2013).
32. Kotas, T.J., The Exergy Method of Thermal Plant Analysis, Krieger Pub., Malabar, Fla. (1995).
33. Bejan, A., Tsatsaronis, G. and Moran, M.J., Thermal Design and Optimization, John Wiley & Sons Inc., New York (1996).
34. Kaviri, A.G., Jaafar, M.N.M. and Lazim, T.M. \Mod-eling and multi-objective exergy based optimization of a combined cycle power plant using a genetic algo-rithm", Energy Conversion and Management, 58(0), pp. 94-103 (2012).
35. Al-Sulaiman, F.A., Dincer, I. and Hamdullahpur, F. \Exergy modeling of a new solar driven trigeneration system", Solar Energy, 85(9), pp. 2228-2243 (2011).
36. Wang, J., Dai, Y., Gao, L. and Ma, S. \A new combined cooling, heating and power system driven by solar energy", Renewable Energy, 34(12), pp. 2780-2788 (2009).
37. Paul W. Stackhouse, J., Ph.D., https://eosweb.larc. nasa.gov/cgi-bin/sse/sse. cgi (2013).
38. Wang, J., Dai, Y. and Sun, Z. \A theoretical study on a novel combined power and ejector refrigeration cycle", International Journal of Refrigeration, 32(6), pp. 1186-1194 (2009).
39. Holland, J., Adaptation in Natural and Articial Sys-tems, University of Michigan Press, Ann Arbor (1975). Biographies
Fateme Ahmadi Boyaghchi received her BSc degree in Mechanical Engineering, Iran, and MSc and PhD degrees in Energy Conversion all from Iran University
of Science and Technology. Her specic research interest is solar-driven energy systems, environment and conventional power plants. She has two books and numerous professional journal articles. She is currently assistant professor in the Faculty of Engineering at Alzahra University, Iran.
Parisa Heidarnejad received her BSc in Mechanical Engineering from Urmia University, Urmia Iran, in 2010, and is currently an MSc student of Energy systems in the Faculty of Engineering at Alzahra University, Iran. Her research interests include solar energy systems and optimization.