https://doi.org/10.1007/s10456-018-9613-x
REVIEW PAPER
Consensus guidelines for the use and interpretation of angiogenesis
assays
Patrycja Nowak‑Sliwinska1,2 · Kari Alitalo3 · Elizabeth Allen4 · Andrey Anisimov3 · Alfred C. Aplin5 ·
Robert Auerbach6 · Hellmut G. Augustin7,8,9 · David O. Bates10 · Judy R. van Beijnum11 · R. Hugh F. Bender12 ·
Gabriele Bergers13,4 · Andreas Bikfalvi14 · Joyce Bischoff15 · Barbara C. Böck7,8,9 · Peter C. Brooks16 ·
Federico Bussolino17,18 · Bertan Cakir19 · Peter Carmeliet20,21 · Daniel Castranova22 · Anca M. Cimpean23 ·
Ondine Cleaver24 · George Coukos25 · George E. Davis26 · Michele De Palma27 · Anna Dimberg28 ·
Ruud P. M. Dings29 · Valentin Djonov30 · Andrew C. Dudley31,32 · Neil P. Dufton33 · Sarah‑Maria Fendt34,35 ·
Napoleone Ferrara36 · Marcus Fruttiger37 · Dai Fukumura38 · Bart Ghesquière39,40 · Yan Gong19 ·
Robert J. Griffin29 · Adrian L. Harris41 · Christopher C. W. Hughes12 · Nan W. Hultgren12 · M. Luisa Iruela‑Arispe42 ·
Melita Irving25 · Rakesh K. Jain38 · Raghu Kalluri43 · Joanna Kalucka20,21 · Robert S. Kerbel44 · Jan Kitajewski45 ·
Ingeborg Klaassen46 · Hynda K. Kleinmann47 · Pieter Koolwijk48 · Elisabeth Kuczynski44 · Brenda R. Kwak49 ·
Koen Marien50 · Juan M. Melero‑Martin51 · Lance L. Munn38 · Roberto F. Nicosia5,52 · Agnes Noel53 · Jussi Nurro54 ·
Anna‑Karin Olsson55 · Tatiana V. Petrova56 · Kristian Pietras57 · Roberto Pili58 · Jeffrey W. Pollard59 · Mark J. Post60 ·
Paul H. A. Quax61 · Gabriel A. Rabinovich62 · Marius Raica23 · Anna M. Randi33 · Domenico Ribatti63,64 ·
Curzio Ruegg65 · Reinier O. Schlingemann46,48 · Stefan Schulte‑Merker66 · Lois E. H. Smith19 · Jonathan W. Song67,68 ·
Steven A. Stacker69 · Jimmy Stalin66 · Amber N. Stratman22 · Maureen Van de Velde53 · Victor W. M. van Hinsbergh48 ·
Peter B. Vermeulen50,72 · Johannes Waltenberger70 · Brant M. Weinstein22 · Hong Xin36 · Bahar Yetkin‑Arik46 ·
Seppo Yla‑Herttuala54 · Mervin C. Yoder71 · Arjan W. Griffioen11
Published online: 15 May 2018 © The Author(s) 2018
Abstract
The formation of new blood vessels, or angiogenesis, is a complex process that plays important roles in growth and develop-ment, tissue and organ regeneration, as well as numerous pathological conditions. Angiogenesis undergoes multiple discrete steps that can be individually evaluated and quantified by a large number of bioassays. These independent assessments hold advantages but also have limitations. This article describes in vivo, ex vivo, and in vitro bioassays that are available for the evaluation of angiogenesis and highlights critical aspects that are relevant for their execution and proper interpretation. As such, this collaborative work is the first edition of consensus guidelines on angiogenesis bioassays to serve for current and future reference.
Keywords Angiogenesis · Aortic ring · Endothelial cell migration · Proliferation · Microfluidic · Zebrafish · Chorioallantoic membrane (CAM) · Vascular network · Intussusceptive angiogenesis · Retinal vasculature · Corneal angiogenesis ·
Hindlimb ischemia · Myocardial angiogenesis · Recombinant proteins · Tip cells · Plug assay · Myocardial angiogenesis · Vessel co-option
Table of contents
* Patrycja Nowak-Sliwinska
* Arjan W. Griffioen
Extended author information available on the last page of the article
1. Introduction
2. Endothelial cell and monocyte migration assays 3. Endothelial cell proliferation assays
4. 3D models of vascular morphogenesis 5. Aortic ring assay
7. Assessment of intussusceptive angiogenesis
8. In vivo sprouting lymphangiogenic assay and AAV-mediated gene transfer of vascular endothelial growth factor c (VEGFC)
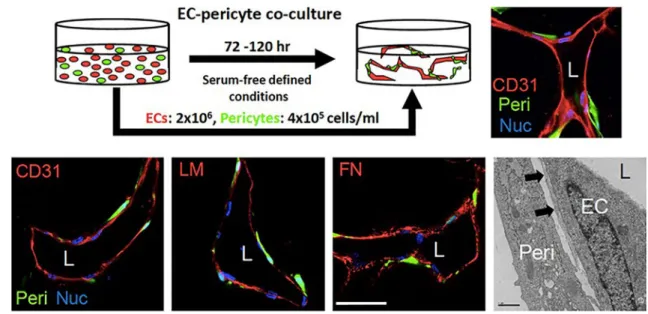
9. Assay for pericyte recruitment to endothelial cell-lined tubes, capillary assembly, and maturation
10. EC co-culture spheroids 11. Endothelial cell metabolism 12. Endothelial cell precursors 13. Microfluidic assays
14. Flow cytometry and cell sorting assays
15. Loss-of-function approaches in the developing zebrafish 16. Chorioallantoic membrane assays
17. Murine allantois assay 18. In vivo angiogenesis plug assay 19. In vivo vascular network forming assay 20. Developing mouse retinal vasculature—tip cells 21. Corneal angiogenesis assays
22. Mouse oxygen-induced retinopathy model
23. Laser-induced choroidal neovascularization mouse model 24. Transparent window preparations for angiogenesis studies in mice 25. The RIP1-Tag2 transgenic mouse model
26. The MMTV-PyMT breast cancer model 27. Tumor implantation models
28. Mouse hind limb ischemia model
29. Large animal models for myocardial angiogenesis
30. Guidelines for purity of recombinant proteins in angiogenesis assays
31. Conclusions
1 Introduction
The process of angiogenesis—the formation of new blood vessels from preexisting ones—is a hallmark of tissue repair, expansion, and remodeling in physiological processes, such as wound healing, ovulation, and embryo development, and in various pathologies including cancer, atherosclerosis, and chronic inflammation [1–5]. Many of these conditions share characteristics, for example the occurrence of hypoxia or inflammation, recruitment of inflammatory cells, angio-genic growth factor production, basement membrane deg-radation, endothelial cell (EC) migration, proliferation and differentiation, and modulation of vascular support cells. However, depending on the tissue or disease under inves-tigation, important details may differ considerably. Moreo-ver, EC in different vascular beds exhibits organ-specific heterogeneity associated with the differentiated specialized functions of the tissue. It is often not possible to accurately visualize the process of angiogenesis and its molecular players. Therefore, different in vivo, ex vivo, and in vitro bioassays and techniques have been developed to investi-gate the specific stages of the angiogenesis. However, the use of bioassays that study a part of the process, with the intention to extrapolate and understand the full process of
angiogenesis, inherently implies accepting specific limita-tions. It is therefore crucial to understand the full potential of these bioassays during their specific applications. These assays have been instrumental in the study of vascular biol-ogy in growth and development [6–8] but also play a key role in the design, development, and evaluation of drugs that positively or negatively modulate vessel function for the treatment of many diseases [9–11]. Some examples of where the use of such bioassays has been imperative are: (1) the development of angiostatic drugs for the treatment of cancer, ocular diseases, and other pathologic conditions where angiogenesis is implicated and also angiogenic treat-ment strategies in ischemic cardiovascular disease [12, 13], (2) screening of natural anti-angiogenic compounds [14], (3) the efforts to design combination therapies including angio-genesis inhibitors [15–20], (4) the unraveling of mechanisms regulating lymphangiogenesis [21, 22], (5) the interrelation-ship of angiogenesis and immunity [23–25], (6) the develop-ment of imaging as diagnostic strategy [26], (7) the study of drug resistance mechanisms [27–29], (8) development of compounds and strategies for the revascularization of ischemic injuries [30, 31], and (9) to improve the vascular fitness in aging vessels [32, 33]. The current paper describes a large collection of assays and techniques for the evalua-tion of angiogenesis and aims at explaining their respec-tive advantages and limitations. In addition, we included strategies to study angiogenesis in tissues, through means of assessing and quantifying microvessel density (MVD), vessel co-option, pericyte coverage, and tip cell behavior.
2 Endothelial cell and monocyte migration
assays
EC migration is one of the hallmarks of angiogenesis and one of the earlier steps in the angiogenic cascade. This process is characterized by cell-autonomous motility prop-erty but in some cases, it acquires the features of collective migration [34–37], in which a group of cells coordinate their movements toward a chemotactic gradient and by estab-lishing a precise hierarchy with leader and follower cells. Therefore, dissection of the molecular mechanisms of EC migration is critical to understand and to therapeutically manipulate the process to either inhibit sprouting (e.g., in tumors) or stimulate vessel formation (e.g., during tissue regeneration or wound healing).
of 2D and 3D cellular migration assays have been estab-lished as relatively simple in vitro readouts of the migratory/ angiogenic activity of EC in response to exogenous stimuli. Depending on the specific scientific question, a range of assays is available to quantitatively and qualitatively assess EC migration. The most widely employed assays include variations of the wound closure and the Boyden chamber assays.
2.1 Types of assays
Cell culture wound closure assay Lateral migration assays are performed to investigate the pro- or anti-migratory effect of compounds, as well of specific gene perturbations, or to describe phenotypes resulting from genetic manipulation of EC. Although these assays can be used to characterize chemokinesis (unidirectional migration) in response to a given compound added to the cell culture medium, they do not allow determination of directed migration rate toward or away from a compound. Assessment of chemotaxis can only be determined when a gradient is also provided.
The cell culture wound closure assay is one of the basic readouts for characterizing the migratory activity of cells. It is a measure of the lateral 2D migration of EC in cell cul-ture to test compounds for pro-migratory or anti-migratory activity. Depending on the migratory effect of the tested substances, the assay is performed over 2–4 days. ECs are grown to confluency in a cell culture dish and then scraped with a razor blade/pipette tip [41], allowing the EC at the wound edge to migrate into the scraped area. To really exam-ine the motility contribution to the healing and to exclude the component related to cell proliferation, ECs are incu-bated with the antimitotic agent mitomycin [42]. Large genome-wide screens can also be assessed with the scratch wounding technique. The use of precision wounding replica-tors with floating pins and a workstation robot enables large numbers of scratches to be made with reduced coefficients of variation [43, 44].
Wound healing assay connected with video-lapse micros-copy allows studying in 2D dimension the role of collec-tive migration in angiogenesis and vascular development [34–36]. The use of aortic rings (see below) and that of spe-cific microfluidic devices represent a further tool to describe this process in a 3D architecture [45]. For instance, wound healing assay exploited by single-cell analysis and by using chimeric EC sheets obtained by infecting cells with different fluorescent proteins [34, 45, 46] was instrumental to describe the following steps of EC collective migration: (1) In resting state, ECs undergo random cell motility in the monolayer with a regulated dynamics of homotypic cell junctions; (2) the presence of cell-free space (i.e., the wound) and a chem-otactic gradient results in the appearance at the sheet mar-gin of leader cells, which is characterized by an aggressive
phenotype with prominent stress fibers, ruffling lamellipodia and enlarged focal adhesions, formation of peripheral actin cables, and discontinuous adherens junctions, which indicate mechanical coupling between leader and follower cells in the migrating cluster [47]; (3) as leaders start to migrate in the free space, a follower phenotype appears within cells of the monolayer.
Trans-well cell migration assay—Boyden chamber assay The Boyden chamber assay is a useful tool to study chemotaxis and cell invasion. It was originally introduced by Steven Boyden in the 1960s for the analysis of leukocyte chemotaxis [48], and a modified version of the assay has recently been used extensively for the assessment of mono-cyte migration [39]. Indeed, today, a large range of Boyden chamber devices, adapted to individual needs, are commer-cially available. The assay is based on a chamber of two medium-filled compartments separated by a microporous membrane of defined pore size and can be used to distin-guish positive chemotaxis (migration toward the attractant) and negative (migration away from a repellent) chemotaxis. Briefly, ECs are placed in the upper compartment and are allowed to migrate through the pores of the membrane into the lower compartment. The chemotactic agent of interest or cells-secreting chemotactic agents are present in the lower compartment. The membrane between the fluid-filled com-partments is harvested, fixed, and stained after a defined incubation time, and the number of cells that have migrated to the bottom side of the membrane is determined by stain-ing and subsequent microscopic analysis. Because a chemi-cal gradient cannot be maintained for extended periods, Boyden chamber assays are limited to 2–6 h.
The bioactive molecules in Boyden chamber assays can be provided directly by adding recombinant proteins or small molecule compounds or by plating cells-secreting specific factors in the bottom chamber. Manipulation of test cells (gain-of-function/loss-of-function) can be introduced into the assay. Migration assays are often performed in co-culture with tumor cells, pericytes or fibroblasts.
The real-time random migration assay The use of video-lapse microscopy allows measuring migration not only as an endpoint result, but gives information on single-cell parameters, on morphological changes, and on the influence exerted by specific substratum. Subconfluent ECs are plated on plastic surface coated with specific extracellular matrix proteins (i.e., collagens, fibronectin, vitronectin) allowed to adhere and then observed with an inverted microscope equipped with thermostatic and CO2-controlled chamber (e.g., Leica, DMi8 platform; Nikon, TE microscope). Images of motile ECs are captured with a 5 min time interval over 4 h. Images were then processed with DIAS software (Sol-ltech). A recent review on tracking algorithms offers a wide and comprehensive selection of the available tools to analyze cell motility [49]. Generally, data are displayed as a centroid plot showing the location of the geometrical center of the cell as a function of time. Directional persistence was cal-culated by determining the ratio between the net path length and the total path length. Furthermore, other parameters such as the total and net distance, the speed, the feature of turning angle can be calculated. Single-cell trajectories were plotted using MATLAB software and displayed in windrose graphs [50, 51].
2.2 Limitations and challenges
Standardization of techniques is one of the most critical issues to ensure the reproducibility of experimental results, and one has to be aware that cellular in vitro systems rep-resent only a surrogate of the in vivo conditions. Neverthe-less, compared to in vivo experiments, in vitro assays are relatively simple to perform and they offer the possibility to pursue high-throughput screens of compounds or tants of tumor cells affecting EC migration, e.g., superna-tants of tumor cells. Nonetheless, the assay has limitations. The cell culture conditions must be standardized, and pure populations of EC are required. More frequently than not, human umbilical vein ECs (HUVECs) are used for these assays; however, these are derived from a large vessel, whereas angiogenesis occurs in microvessels. HUVECs are primary cells and are only viable for a limited time, and like other cells in culture, they change their expression profile and therefore their phenotype and behavior over time and through repeated passage events. Furthermore, reproducibil-ity of scratch assays relies strongly on the initial degree of confluency [52]. In addition, scratch assays must be carefully
evaluated to rule out the possibility that experimental condi-tions have influenced proliferation of EC, rather than their migration (this can be easily done using cell proliferation assays such as expression of pHH3, see below). Another important consideration is that ECs in vivo are exposed to shear stress as well as hypoxia gradients, i.e., the drag force induced by blood flow to the endothelium, which are absent in the standard static cell culture models. While the scratch assay is a straightforward cell culture assay to analyze EC chemokinesis, it does not have a high degree of sensitivity, but it is a useful tool to perform large-scale screening experi-ments. One downside of this method is that the width of the scratch introduced into the cell layer is difficult to control and cannot be easily standardized. Moreover, wounding of the monolayer with a sharp object may scratch the surface of the cell culture dish and additionally damage the EC at the migration front.
To obtain more reliable and reproducible results, fenc-ing techniques that allow for controlled release of a conflu-ent monolayer have been developed. These enable lateral migration without wounding of the cells or the underlying matrix [53]. Cells are grown as a monolayer in a culture dish containing a silicon template of defined size prior to seeding the cells. Once the culture reaches confluency, the silicon template is removed, thus allowing the cells to migrate lat-erally into the area previously occupied by the silicon tem-plate. Precise microscopic quantification of lateral migration is then possible over 2–4 days. Ideally, the duration of the assays should be kept under 2 days, because over longer incubation times, cell proliferation will contribute to wound closure, thereby confounding the migration effect.
scratches using the robot over manual wounding replica-tors makes the latter instrument the method of choice when performing the scratch wound assay for large-scale screens on drug or genome-wide siRNA/sgRNA screens [43, 44].
It should be stressed that the Boyden chamber assay is somewhat delicate and it requires experience in handling. The most critical issue is the possible trapping of air bub-bles in the lower and upper chambers during assembly. Air bubbles appear as empty spaces on the filter at the conclu-sion of the assay, because they hinder cell migration. For manual analysis, this may not be of major importance, but it becomes relevant if an automated analysis is performed since trapped cells would be undistinguishable from the absence of migration. It is important to invest substantial time into the setup and troubleshooting of the assay in order to yield robust and reliable results. It is also recommended to include a checkerboard analysis to distinguish between chemotaxis and chemokinesis effects. To this end, different dilutions of the compound to be tested should be titrated in the upper and lower chamber. Equal concentrations in the upper and lower chamber should lead to the same migra-tion behavior as in the control for a compound that strictly responds to a gradient (i.e., chemotaxis).
2.3 Concluding remarks
In summary, the lateral scratch wound assay [55] and the Boyden chamber assay are both robust and reliable platforms to study EC migration. They are suitable for scaled-up pur-poses in order to perform manual or automated large-scale compound screens. Various vendors provide scratch and transwell assay systems. Although these systems offer good reproducibility and adequate throughput capacity, variation between individual EC isolations can occur resulting in vari-able results. Pooling several EC isolates may reduce this variability. In combination with time-lapse microscopy, it is also a powerful tool for tracing the migratory behavior of individual EC.
3 Endothelial cell proliferation assays
Many regulators of angiogenesis have been identified, vali-dated, and developed based on their effects on EC prolifera-tion. ECs are among the most quiescent cells in the body, with proliferation rates approaching zero under steady-state conditions. Only after stimulation, usually as a consequence of injury, inflammation, or pathological processes such as malignant growth, can they initiate cell cycle entry [56, 57]. The ideal assay to measure EC proliferation should be rapid, reproducible, and reliable and wherever possible should exclude inter-operator variability, for example through quantitative computational readout rather than qualitative
researcher-dependent observations [57]. This section pre-sents different methods and elaborates on problems and pitfalls.
3.1 Types of proliferation assays
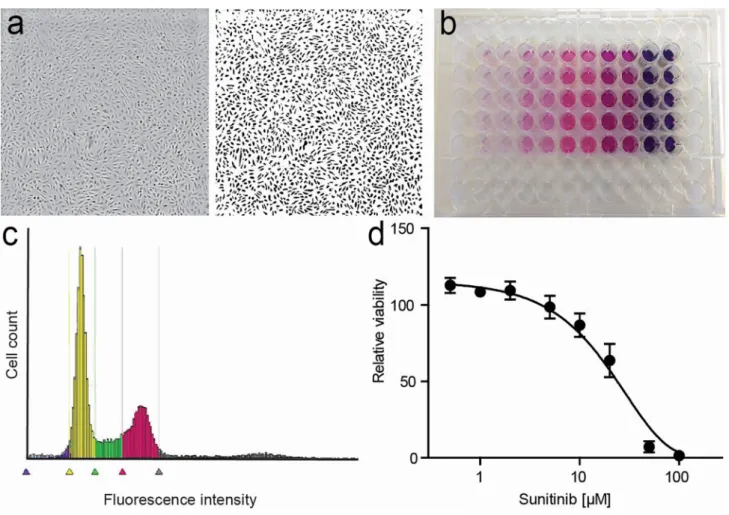
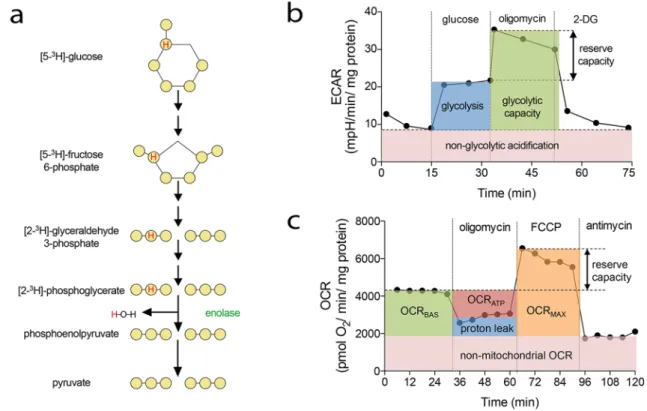
A number of different approaches to address cell prolifera-tion have been developed in the last decades. In general, these include assessment of cell number, detection of DNA synthesis by incorporation of labeled nucleotide analogs, measurement of DNA content, detection of proliferation markers and metabolic assays (Fig. 1). Depending on the broadness of the definition of cell proliferation, which can range from the narrow description, for example, “the frac-tion of cells dividing over time” to the more general “the doubling time of a population,” several different assays may be pursued. Apart from that, means and equipment avail-able will also dictate the choice of a particular method. As all methods focus on a particular aspect of the process, it is highly recommended to verify results with a complementary assay.
Cell counting Cell counting is considered the gold stand-ard for proliferation. Moreover, at least in theory, it is one of the most straightforward procedures for measuring prolif-eration of a cell population. It can be done using automated cell counters (e.g., Beckman Coulter) or by using a hemo-cytometer after removal of the cells from the culture vessel [57, 58]. More recently, different automated platforms have entered the market that allow analysis of cells while present in microplates, such as plate cytometers, automated micro-scope, or high-content screening platforms, that are compat-ible with cell counting-like procedures. With these, cells can be monitored over time but frequently require staining for detection, calibration, and (computation-assisted) quantifica-tion by, for example, staining of nuclei. Moreover, real-time cell analysis (referred to as RTCA) platforms have emerged that allow label-free, automated, real-time monitoring of cel-lular properties during incubation based on electrical resist-ance measurements. The equipment, however, requires con-siderable investment, beyond reach for many laboratories.
DNA labeling During S phase of the cell cycle, DNA is synthesized and subsequently divided between the daugh-ter cells (2 N → 4 N → 2 N; N = number of a complete set of chromosomes). Addition of modified nucleotides to the culture medium will result in their incorporation into the newly synthesized DNA. Adhering to the narrow defini-tion of proliferadefini-tion as stated above, this type of assay most closely reflects a means of measuring the fraction of actively dividing cells. It should be noted that this technique does not directly measure cell division or population doublings, but exclusively incorporation of a tracer into DNA synthesis.
3H-thymidine has been used in proliferation assays for
3H-thymidine for several hours and radioactivity is
meas-ured by liquid scintillation counting. This provides a very accurate representation of DNA synthesis and it is highly sensitive since the amount of incorporated 3H-thymidine is
directly proportional to the rate of DNA synthesis [57, 58]. Constraints on using radioactive compounds and the rise of alternative methods have limited its use. In a similar man-ner, the incorporation of 5-bromo-2′-deoxyuridine (BrdU) or EdU (5-ethynyl-2′deoxyuridine) can be measured. BrdU or EdU can be (in)directly detected and subsequently be (semi-) quantified using ELISA, flow cytometry, or immunohisto-chemistry [57, 58, 60]. The latter two quantification tech-niques allow one to determine the fraction of dividing cells. These uridine analogs can be combined with DNA dyes (see below) to gain additional cell cycle information [57].
Another approach is the measurement of cellular DNA content using intercalating dyes such as PI (propidium iodide) or DAPI (4′,6-diamidino-2-phenylindole). Using flow or plate cytometry, a profile of the distribution of cells over the different phases of the cell cycle can be visualized, represented by DNA contents of 2 N (G1/0), 4 N (G2/M),
or mixed (S). In addition, this method allows for the detec-tion of apoptotic cells that would exhibit a subG1/0 (< 2 N) DNA content.
An alternative method to study EC cycle is based on the use of Fucci (fluorescent, ubiquitination-based cell cycle indicator) technology (Thermo fisher). It consists of a fluo-rescent protein-based system that employs both a red and a green fluorescent protein, respectively, fused to cdt1 and geminin, which are two regulators of cell cycle. These two proteins are ubiquitinated by specific ubiquitin E3 ligases in a specific temporal sequence. In the G1 phase, geminin is degraded; therefore, only cdt1 is present and appears as red fluorescence within the nuclei. In the S, G2, and M phases, cdt1 is degraded and only geminin remains, resulting in cells with green fluorescent nuclei. During the G1/S transition, when cdt1 levels are decreasing and geminin levels increas-ing, both proteins are present, giving a nuclear yellow fluo-rescence. More recently, Fucci probe was reengineered to generate a triple color-distinct separation of G1, S, and G2 phases extending the use of this technology to quantitative analyze the interphase of cell cycle [61].
Fig. 1 Endothelial cell proliferation assays. a Phase-contrast image (left) and binarized image of HUVEC grown in a regular 96-well plate. Simple software solutions can be used to count features in the image. b Example of MTT assay, with color intensity correlating with
Proliferation markers Cell division is a highly coordi-nated process in which specific proteins act in concert with allow progression through different stages of cell division. Detection of these proteins, usually through immunochemi-cal procedures, allows the estimation of the fraction of divid-ing cells. This approach can be used in in vitro endpoint assays, but can additionally be used to evaluate active EC proliferation in tissue sections (see separate section). The most frequently used markers are phosphorylated histone H3 (PH3), which marks cells in S phase, or PCNA and KI67, which label cells in all cell cycle stages except G0.
Metabolic assays Gradually, the use of cell viability assays has taken a dominant position in addressing cell pro-liferation [62]. While not reflecting this property in its nar-rowest sense, if properly conducted, these assays accurately represent the number of live cells. They are readily available and require minimal handling and infrastructure. The most well known is the MTT assay (3-(4,5-dimethylthiazol-2-yl)-2,5-diphenyltetrazolium bromide), in which this yellow salt is taken up by metabolically active cells and converted by mitochondrial dehydrogenase to insoluble purple formazan crystals. As the amount of the converting enzyme is highly stable in a given cell population, the generation of formazan (and hence color intensity) is proportional to the number of viable cells. This is subsequently quantified by solubi-lization of the crystal-containing cells and spectrophotom-etry [63]. Variations in this method, for example, involving less toxic reagents, simplified reaction steps, or alternative readouts such as cellular ATP levels, have also been widely used [54, 58, 64]. In particular, the water-soluble tetrazo-lium salts, such as MTS (3-(4,5-dimethylthiazol-2-yl)-5-(3-carboxymethoxyphenyl)-2-(4-sulfophenyl)-2H-tetrazolium), allowing the detection of the colored product directly in cell culture media without solubilization, facilitate high-through-put and pharmacological screenings [65].
3.2 Limitations and challenges
Endothelial cell culture considerations Studying EC pro-liferation in vitro requires a purified population of EC compatible with the assay setup. As already mentioned before, HUVECs are a widely available source, but have limitations regarding phenotype and life span in vitro. There-fore, other sources of EC are necessary for confirmation of results. Foreskin-derived human dermal microvascular ECs (HDMECs) or human dermal blood microvascular ECs (HDBECs) are good alternatives; however, the user should be aware that they represent mixed populations of blood and lymphatic endothelial cells [66].
It is essential to standardize the protocol of cell culture and propagation, by adhering to a fixed scheme of passaging, in order to use passage number as a surrogate for popula-tion doublings [67]. In all cases, cell density needs to be
carefully controlled. Assay linearity can be compromised when cells are plated at too high (e.g., 50,000 cells/cm2) or
too low (e.g., 5000 cells/cm2) a density. Loss of cell–cell
contact is a potent stimulus for EC to proliferate, whereas ECs enter a quiescent state upon confluency, a process known as contact inhibition [57, 58, 63]. Optimization of the dynamic performance should involve synchronization of cells by exposure to low serum conditions (when study-ing pro-angiogenic molecules), or by stimulation prior to the addition of angiostatic factors or anti-angiogenic drugs [6]. Though immortalized EC can pose a helpful alterna-tive, it should be recognized that the immortalization itself will likely alter growth control and survival mechanisms in these cells [67]. As such, care must be taken to address the generalizability of assay outcome.
from human, mouse, and viral sources that stimulate the VEGFR-2 and VEGFR-3 pathways [69, 70].
3.3 Concluding remarks
The choice for a particular EC proliferation assay is deter-mined by a number of considerations. Endpoints, test com-pounds, laboratory infrastructure, scale, required through-put, convenience, and cost all influence the applicability of an assay system. The growth of a cell population is influ-enced by both cell division and death, which are difficult to monitor simultaneously. Most important is the researchers’ awareness of strengths and weaknesses of each individual assay. Importantly, interpretation of data must be done with care, and whenever possible, results are validated with an alternative method.
4 3D models of vascular morphogenesis
The emergence of vascular networks either through vascu-logenesis or angiogenesis requires the association of cells into stable 3D tubes in a process that involves differentiation, migration, proliferation, aggregation, and rearrangement of these cells to form cords that then undergo lumen forma-tion. Taken together, this process is referred to as vascular morphogenesis. Subsequently, ECs recruit perivascular stro-mal cells (pericytes) to stabilize this newly formed network and minimize leakage upon blood perfusion. Importantly, not all sprouts become functional vessels. Pruning serves to selectively remove redundant or non-functional vessels to optimize fluid flow through the network [71].
In vitro assays have played a valuable role in our under-standing of vascular morphogenesis. These assays provide a simpler platform than animal models for dissecting indi-vidual steps within the process while also incorporating 3D matrix to mimic native in vivo tissues. Here, we present several of the most reliable and informative assays devel-oped to date and highlight the strengths and limitations of each (Table 1). While many types of EC can be used in these assays, the most commonly used are HUVEC and human endothelial colony-forming cell-derived EC (ECFC-EC), which generally have a higher proliferative potential. Mouse ECs are not generally used in these assays as they are notori-ously difficult to maintain in culture. While we use “EC” to reference to cells derived from both species, assays using a specific EC source are annotated accordingly.
4.1 Types of assays
Fibrin Bead Assay Traditional Matrigel cord-forming or collagen I angiogenic invasion assays are insufficient to mimic the complexity of angiogenesis, as these assays are
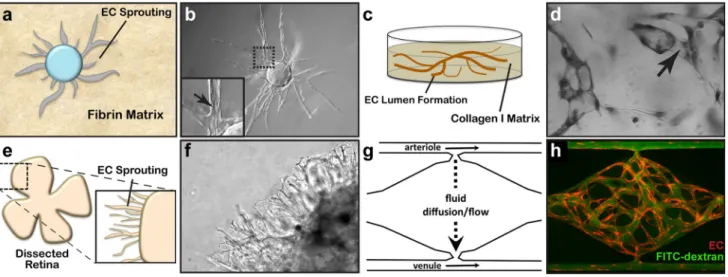
two-dimensional and ECs in these assays often form incom-plete lumens. Moreover, lumen formation in Matrigel is not unique to EC as several non-EC cell types (e.g., human prostate carcinoma and glioblastoma cells) also form cords, complicating the interpretation of results from these assays [57]. By contrast, the fibrin bead assay provides a plat-form for testing EC sprouting and lumen plat-formation over an extended period (2–3 weeks) and incorporates a 3D, ECM, and multiple cell types (i.e., stromal pericytes) to model native angiogenesis. ECs (HUVECs) are first allowed to adhere to collagen I-coated Cytodex beads to generate an EC monolayer that mimics the vessel wall of native vessels. These EC-coated beads are then embedded into a fibrin gel with human stromal cells either embedded within the gel or plated as monolayer on the surface of the gel. Tip cells are observed 2–3 days post-plating, and elongating sprouts appear 2–4 days thereafter (Fig. 2a, b). When maintained in pro-angiogenic EGM-2 medium (Lonza), lumens form within a week and the cells remain viable up to 3 weeks, at which point anastomoses between sprouts are often appar-ent [72]. A detailed, video protocol of this assay is available [73].
Angiogenic sprouting from individual beads is evalu-ated by phase-contrast microscopy allowing for quantifi-cation of sprout number, length of sprouts, percentage of sprout lumenization, and number of anastomoses. Genetic approaches (siRNA, lentiviral transduction, CRISPR/Cas9) [74] can modify gene expression in individual cell types to dissect cell-autonomous components of the angiogenesis process. Protein expression and localization are measured by fixing bead assays and using modified immunofluorescent staining techniques. More detailed gene expression analyses are made possible by harvesting individual cell types to track RNA expression changes over time through various stages of sprouting angiogenesis.
stromal cells (and EC) can significantly affect assay results. To partially overcome these issues, it should be appropriate to use ECs pooled from 5 to 10 umbilical cords. Generally, it is crucial to identify stromal cell-HUVEC pairs that yield optimal angiogenic sprouts.
Collagen Lumen Assay To investigate EC lumen forma-tion mechanisms, early assays seeded EC in monolayers on plastic dishes coated with ECM proteins (i.e., collagen I, collagen III, fibrin, or Matrigel). While these 2D assays are sufficient to induce EC cord formation [76–78], they cannot reproduce the necessary cues for true lumen formation found in native, 3D tissues. Collagen sandwich assays surround EC within a 3D matrix by seeding the cells in monolayer on collagen I matrix and then covering them with a second layer of collagen [79]. Nevertheless, tube formation fails to occur in a random, 3D growth pattern, forming only in the
X–Y plane of the initial gel layer and not in the z-axis. As this does not adequately recapitulate normal vessel growth in a true 3D environment, George Davis and others further
optimized these assays, opting instead of embedding single EC (HUVEC) randomly throughout a collagen I matrix. In the simplest version of these assays, HUVECs are seeded at low density (7 × 10⁵ cells/ml) under serum-free growth
conditions and with the addition of minimal growth fac-tors (phorbol ester, VEGF), and fibroblast growth factor-2 (FGF-2). After 48 h, the embedded ECs form intact tubes throughout the gel, with clearly demarcated lumens (Fig. 2c, d). Several variations on this assay have since enhanced and optimized lumen formation. First, the addition of several other growth factors, including a cocktail of stem cell fac-tor (SCF), IL-3, stromal-derived facfac-tor-1α (SDF-1α), and FGF-2, further promotes lumen formation while maintain-ing serum-free growth conditions. Second, when simulta-neously seeded within the same matrix, stromal pericytes are recruited by EC, recapitulating a key step in vascular morphogenesis. Lastly, to understand the process of EC sprouting and angiogenesis, EC can be seeded on top of a 3D collagen gel containing the same growth factors and
Table 1 Comparison of 3D models of vascular morphogenesis
Assay Process
Sprouting Lumen
formation Anastomosis Pericyte recruitment Perfusion Pruning
Fibrin bead assay ✓ ✓ ✓ ✓
Collagen lumen assay ✓ ✓
Retina explant assay ✓ ✓ ✓
Vascularized micro-organ ✓ ✓ ✓ ✓ ✓ ✓
Fig. 2 Three-dimensional assays of vascular morphogenesis. a A fibrin bead assay uses collagen I- and EC-coated Cytodex beads embedded within a 3D fibrin gel matrix to measure EC sprouting and lumen formation. b These features are readily resolved using phase-contrast microscopy. c EC tube formation can be measured by embed-ding EC within a collagen I matrix. d Once formed, these tubes can be visualized by toluidine blue staining and bright-field microscopy. e Whole-mount, dissected retinas from postnatal mice are mounted
invasion of the underlying gel layer can be quantified. A detailed protocol of the collagen lumen assay and its varia-tions is available for further reading [80].
Real-time imaging of tube formation can be achieved using fluorescent protein-transduced EC. Alternatively, fixed vessels can be stained with 0.1% toluidine blue and imaged using bright-field microscopy (Fig. 2d). More in-depth anal-yses can be carried out on these fixed vessels using immu-nofluorescence staining of relevant protein markers or trans-mission electron microscopy to resolve structural details of formed lumen and remodeled ECM.
Regular users of collagen gels will note that the viscos-ity, pH, and contraction of these gels can hinder successful execution of assays in the hands of new users. As a result, special care should be taken when pipetting (such as when mixing cells and growth factors) and plating gels to ensure even gel coating of the bottom of the well plate. Perhaps most significantly, early gel contraction can limit the use-ful length of these assays. Users will note that plating gels only in wells within the center of the 96 half-area wells and adding medium or water to the outer wells of the plate will minimize gel contraction, by maintaining local humidity levels. Additionally, seeding fewer ECs within the collagen (1.5 × 10³ cells/ml) can minimize gel contraction and
pro-long the assay.
Retinal Explant Assay Although in vitro assays are high throughput and can mimic major steps in vascular morpho-genesis, they do not fully recapitulate the in vivo, whole-organ environment [72]. Several in vivo animal models, such as mouse retina or zebrafish fins, are valuable tools for studying vascular (re)-establishment in a physiologically relevant context [57, 81]. However, the added complexity of these systems makes it more difficult to ascertain the role of individual proteins and growth factors and cell types in the vascular morphogenesis process, relying on genetic manipulations or system-wide administration of pharma-cologic inhibitors to dissect molecular pathways [57, 82]. As such, there is a need to increase assay complexity and physiological relevance while developing platforms amena-ble to ex vivo study in the laboratory. Retina explant assays are one such ex vivo platform, whereby dissected retinas are maintained and observed for vascular morphogenesis over several weeks in the laboratory. While multiple ver-sions of this assay have been published, a protocol published by Sawamiphak et al. is most widely used for the study of endothelial sprouting [83]. Briefly, retina cups from embry-onic, postnatal, or adult mice are harvested and cut radially to allow flat mounting of the retina interior surface onto a membrane insert. After recovery in media for 2–4 h, the explants can then be treated with stimulatory or inhibitory agents for up to 4 h, followed by whole-mount microscopy analysis to evaluate the (anti-) angiogenic effect of these agents on vessel sprouting (Fig. 2e). A trained researcher
can harvest and dissect each pair of retinas within minutes. Unfortunately, without the support of a 3D matrix, retinal cells cannot survive for long periods, thus making studies of later stages of angiogenesis impossible. To overcome this, Rezzola et al. have improved the assay by embedding the retinas in different matrices after dissection [84]. In this approach, retinas can be crosscut into four equal pieces and left in serum-free media overnight. The retina fragments are then embedded in Matrigel, collagen I, or fibrin matrix and fed every 2–3 days. Depending on the age of the mice and the matrix used, sprouts can be observed between days 3 and 6 and anastomosis of neighboring sprouts similar to what occurs in vivo can be observed in 10–14 days [85] (Fig. 2f). These explants can be maintained up to 3 weeks before the vessels eventually regress. When cultured for a longer period however, vascular sprouts also start to form toward the cho-rioidea and not only in the retinal plane, making analysis more complex.
Vessel formation can be analyzed in real time using time-lapse imaging or immunofluorescence microscopy of fixed explants at established experimental time points [85, 86]. Gene expression can be manipulated by genetic crossing of the donor mice or, more transiently, by treating retinas with lentivirus or siRNA or Crispr-Casp9 technology. Moreover, embedded retinas can be treated with drugs over extended periods to dissect individual signaling pathways.
Several factors are critical to consistently achieve sprout-ing from dissected retina explants. Firstly, the matrix pro-teins in which retinas are embedded can greatly influence how vessels sprout. Matrigel is far superior to single matrix proteins in inducing sprouting. However, the addition of 10–20% Matrigel in collagen I matrix is sufficient to stimu-late sprouting compared to pure collagen I matrix. Secondly, the use of pro-angiogenic EGM-2 medium yields more sprouts as compared to basal medium alone. Lastly, as with any tissue explant, the age of the mouse can influence the degree of vessel sprouting. As such, special care should be taken to select mice appropriate for the experimental ques-tion at hand. There are many similarities between the mouse retinal explant assay and the traditional mouse/rat aortic ring angiogenesis assay or rat vena cava explant assay [87–89]. However, retinal explant models more closely model true capillary sprouting as the vasculature in these explants is actively developing and remodeling. This makes the retinal explant model uniquely suited to studying microvessel for-mation and its underlying mechanisms.
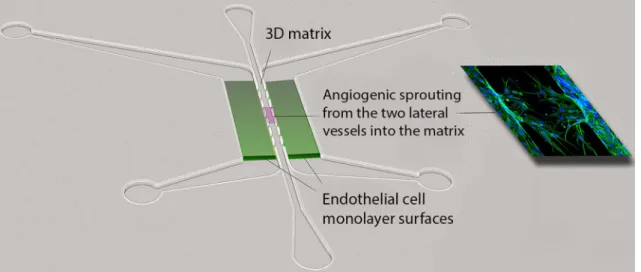
are perfused with a blood-substitute medium that delivers nutrients to tissues within the matrix, just as in the body. Specifically, this platform utilizes “arteriole” (high pressure) and “venule” (low pressure) microfluidic channels that are joined by a living microvascular network that forms by vas-culogenesis in an intervening tissue chamber (Fig. 2g). A pressure differential between the two channels is used to drive interstitial flow through the fibrin gel matrix during vessel development, induce vessel formation (through shear-sensing), and drive convective flow through the mature vas-culature once formed and anastomosed to the outer channels. This pressure difference is induced by varying the level of medium within fluid reservoirs at either end of the micro-fluidic channels, thereby creating hydrostatic pressure heads that ensure continuous fluid convection across the cell cham-ber. To form vessels, human ECFC-EC and human lung stromal cells are co-loaded within a fibrin matrix into the central cell chamber through an independent loading tun-nel. When maintained in pro-angiogenic EGM-2 medium, vessels form within 4–6 days post-loading (Fig. 2h). When perfused with 70 kDa rhodamine dextran, a molecule similar in size to albumin, these vessels demonstrate minimal vessel leakage—comparable to in vivo microvasculature. For read-ers interested in more information, a detailed protocol for loading and maintaining the VMO platform is available [90].
The VMO platform is fabricated from polydimethylsilox-ane (PDMS), an optically clear, biologically inert polymer widely used in the microfluidics field [91]. The use of this polymer and the dimensions of the platform ensure that live, GFP-transduced endothelial progenitor cells (ECFC-EC) can be imaged and quantified throughout vessel formation. Spe-cific parameters such as vessel network length, branching, and anastomosis can be measured in real time as can ves-sel permeability by perfusion with fluorophore-tagged dex-tran molecules of various molecular weights. Additionally, immunofluorescent staining can be used to quantify expres-sion of specific molecular markers or RNA can be collected to measure changes in gene expression. Lastly, gene expres-sion can be manipulated by treating individual cell types with lentivirus or siRNA prior to loading in the platform.
To ensure robust and reproducible vascular network for-mation, several steps are critical. First, the fibrin gel matrix must be consistently loaded within the VMO cell chamber. During normal loading, perfusion burst valves at the inter-face between the tissue chamber and the microfluidic chan-nels ensure a gel/air interface (later a gel/fluid interface) is formed. To simplify loading and minimize specialized training for new users of the platform, current iterations of the VMO platform incorporate a pressure release valve at the loading tunnel that minimizes unintended gel bursting [92]. Second, robust vascular network formation requires that vessels within the chamber anastomose with the outer microfluidic channels. To facilitate the formation of these
anastomoses, EC can be either seeded directly within the microfluidic channels or induced to migrate from the gel by coating the external channels with ECM [93]. As with the fibrin bead assay, optimal stromal cell–EC pairs should be validated to ensure assay reproducibility.
4.2 Limitations and challenges
With all EC assays, the source of EC is critical to assay suc-cess. Although commercial versions of HUVEC and ECFC-EC are available, cells from these sources show limited util-ity in many 3D assays, likely due to a larger than optimal number of cell doublings prior to shipment and use in the laboratory. As a result, the use of freshly isolated EC will provide the most consistent results and is strongly encour-aged. Readers will note that isolation protocols for both cell types are available [94, 95]. Additionally, patient-to-patient variation between different EC isolations can lead to incon-sistent assay results, an issue that may be avoided by pooling several EC lines prior to use.
Given the many differences between the assays described here, the useful length of these assays varies considerably. Even in well-trained hands, the contraction of gels in the collagen lumen assay effectively limits the useful time frame of assays to 72 h or less. However, the other assays described here can continue for much longer periods of time, with the fibrin bead assay, retinal explant assay, and VMO platform all suitable for time points up to 3 weeks under appropriate conditions.
Lastly, the majority of these assays can be run in a rela-tively high-throughput manner, thereby accelerating the speed with which genetic, molecular, or pharmacologic screens [96] can be conducted to understand vascular mor-phogenesis. This is especially true with the fibrin bead and collagen lumen assays, which utilize multiple beads or multi-well culture plates to increase assay throughput. Simi-larly, while initial versions of the VMO platform were cum-bersome to load in high-throughput numbers, this platform is now used in an optimized configuration that incorporates up to 16 individual VMO devices within a standard 96-well plate [97]. This design simplifies translation to outside labo-ratories and interfacing with existing microscope and plate reader infrastructure. Of all the assays described in this sec-tion, retinal explants are most adversely affected by delays between initial dissection, mounting, and plating of tissue samples. This inherently limits the number of animals that can be dissected at once and, for now, limits the number of retinas that can be screened simultaneously.
4.3 Concluding remarks
microenvironment. The 3D vascular morphogenesis mod-els described here provide unique in vitro culture systems that recapitulate this complex multi-step process. At the same time, the simplicity and consistency of these assays compared to in vivo models allow them to be conducted in a high-throughput fashion. Finally, the use of human cells in these assays improves the clinical relevance of such models, making them readily amenable to drug discovery applications.
5 Aortic ring assay
Explants of rat or mouse aorta have the capacity to sprout and form branching microvessels ex vivo when embedded in gels of ECM. Angiogenesis in this system is driven by endogenous growth factors released by the aorta and its out-growth in response to the injury of the dissection procedure. This property of the aortic wall was first described in the early 1980s [98] and led to the development of the aortic ring assay [99], which is now widely used to study basic mechanisms of angiogenesis and test the efficacy of pro-angiogenic or anti-pro-angiogenic compounds [100].
5.1 Benefits and strengths of the aortic ring assay
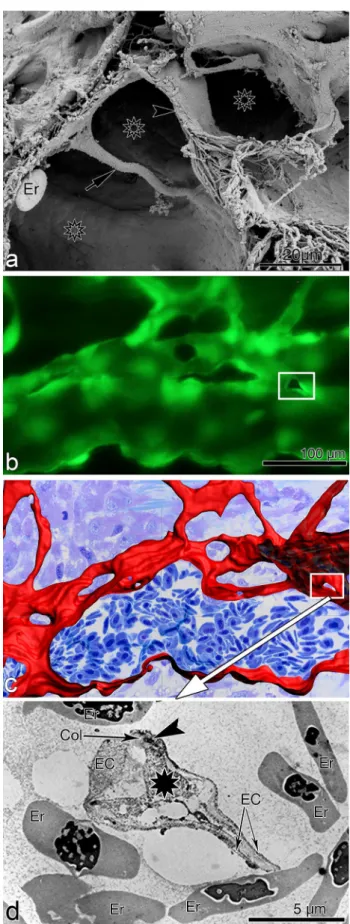
The aortic ring assay offers many advantages over exist-ing models of angiogenesis. Unlike isolated EC, the native endothelium of the aortic explants has not been modified by repeated passages in culture and retains its original proper-ties. The angiogenic response can be inhibited or stimulated with angiogenic regulators and analyzed by molecular or immunochemical methods without the confounding effects of serum (Fig. 3a, b). Angiogenic sprouting occurs in the presence of pericytes, macrophages, and fibroblasts, as seen during wound healing in vivo [100]. The ultrastructure of neovessels at different stages of development can be evalu-ated by electron microscopy (Fig. 3c). The different cell types can be identified with specific cell markers by immu-nostaining whole-mount preparations [101] of the aortic cultures (Fig. 3d–g). Many assays can be prepared from the thoracic aorta of a single animal (approx. 20–25 cultures/rat aorta; approx. 10–15 cultures/mouse aorta). The angiogenic response can be quantitated over time, generating curves of microvascular growth. Aortic cultures can be used to study mechanisms of vascular regression, which typically follows the aortic angiogenic response as seen during reactive angio-genesis in vivo. Aortic rings transduced with viral constructs or obtained from genetically modified mice can be used to study the role of specific gene products in the regulation of the angiogenic response [100].
Recently, rat aortic ring assay was adapted to human arteries by using matrigel as 3D hydrogel [102].
5.2 Assay overview
A detailed description of the aortic ring assay protocol is available in previous reports [103, 104]. We provide here a summary of key steps for the preparation of the assay. Aortic rings are prepared from the thoracic aorta of 1–2-month-old rats or mice. After excision from the animal, the aorta is transferred to a Felsen dish containing serum-free Endothe-lial Basal Medium (EBM). Under a dissecting microscope, the aorta is cleaned of blood and fibroadipose tissue using Noyes scissors and microdissection forceps. Care is taken not to stretch, cut, or crush the aortic wall during the isola-tion and dissecisola-tion procedures. As the dissecisola-tion progresses, the aorta is rinsed in the four compartments of the Felsen dish. Using a scalpel blade, the aortic tube is then cross-sectioned into 0.5–1-mm-long rings. The most proximal and distal rings which may have been damaged during the dissection procedure are discarded. The remaining rings are washed through sequential transfers into eight consecu-tive baths of serum-free medium, using compartmentalized Felsen dishes. Aortic rings are then embedded individually into thin collagen, fibrin, or basement membrane gels as described. Once the gel has set, 500 μl of serum-free EBM is added to each culture. Each experimental group comprises quadruplicate cultures in four-well NUNC dishes. Aortic ring cultures are incubated in a humidified CO2 incubator at 37 °C for 7–21 days.
5.3 Quantitative analysis of angiogenesis in aortic cultures
The angiogenic response of the rat (or mouse) aorta can be quantitated by visual counts or by computer-assisted imag-ing. For visual counts, cultures are examined every 2–3 days and scored for angiogenic sprouting by using an inverted microscope with bright-field optics equipped with 4× to 10× objectives and a 10× eyepiece. Angiogenesis is scored by counting microvessel sprouts, branches, and loops accord-ing to previously published criteria [99]. Aortic outgrowths can also be quantified by image analysis using low power images of the cultures thresholded to highlight the vascular outgrowths [105–108]. Standard statistical methods are used to analyze data and determine levels of significance between control and treated cultures. An internal control group with untreated aortic rings must be included in each experiment to mitigate the effect of possible interassay variability.
5.4 Critical points
variability in the angiogenic response. Injury to the aortic endothelium may be an additional cause of uneven sprouting from different rings. Therefore, special care must be taken not to damage the aorta by stretching or letting it dry dur-ing the isolation and dissection procedures. Dissection of the aorta and preparation of the aortic ring cultures are best performed in a tissue culture room with HEPA-filtered air to avoid microbial contamination. Best results with this assay are obtained using interstitial collagen or fibrin gels. Col-lagen can be produced in-house, as described [103, 104], or purchased from commercial sources [109]. Fibrinogen and thrombin for the fibrin gel are commercially available. Matrigel, a basement membrane-like matrix of tumor origin, can also be used [110]. Matrigel cultures, however, require
growth factor supplements due to the limited ability of the aortic rings to sprout spontaneously in this dense matrix. The growth medium used for the assay should be optimized for the growth of EC in the absence of serum. Optimal results in collagen and fibrin cultures can be obtained with EBM. When preparing individual collagen gel cultures, given the small volume of gel (20–30 µl), it is important to remove excess growth medium from the aortic rings when they are transferred into the collagen, fibrinogen, or Matrigel solu-tion. This is accomplished by gently streaking the aortic ring onto the bottom of the culture dish while holding it from the adventitial side with microdissection forceps. When work-ing with fibrin gels, which set rapidly, no more than four cultures at a time should be prepared, to avoid disrupting
the developing gel while positioning each ring. In addition, for fibrin cultures, the culture medium should include a plas-min inhibitor such as epsilon aplas-minocaproic acid to inhibit fibrinolysis by the aortic rings, which would rapidly destroy the matrix needed for EC to sprout.
The rat aortic ring assay is robust and very reproducible when performed by an experienced operator. The mouse aor-tic ring assay is more variable than the rat aoraor-tic ring assay, likely because of the small size of the rings. For this reason, at least twice as many aortic rings should be used for this assay. Miniaturization of the assay using IBIDI microcham-bers [104] and a smaller volume of growth medium (50 µl) are recommended for the mouse aortic ring assay to ensure spontaneous sprouting under serum-free conditions [104]. In all cases, experiments should be repeated 2–3 times to obtain sufficient number of data points for statistical analysis. The growth medium can be replaced on a regular basis (3 times/ week) or left unchanged for the duration of the experiment. If the medium is not replaced with fresh medium, the angio-genesis response and the stability of neovessels are enhanced due to accumulation of endogenous growth factors in the system. For immunohistochemical evaluation of the aortic cultures, biomatrix gels should not exceed 20–30 µl and should be well spread as a thin wafer around each ring. For-malin fixation should be limited to 10 min to avoid excessive cross-linking of proteins. In addition, overnight incubation may be needed for optimal penetration of the primary anti-body into the gel.
5.5 Limitations and challenges
The main limitation of the aortic ring assay is the lack of blood flow, particularly for angiogenesis-related genes that are regulated by mechanochemical mechanisms. An addi-tional potential limitation is the source of angiogenic ECs, which are arterial and not venous, as neovessels in vivo primarily sprout from postcapillary venules. Many studies performed with this assay, however, have shown good cor-relation of results obtained with the aortic ring assay and in vivo models of angiogenesis. If needed, the aortic ring assay methodology can be applied to veins as reported [89]. Some investigators have described variability of the angio-genic response in different aortic cultures. This is due to the delicate nature of the endothelium, which can be damaged because of inadequate handling of the aorta or the aortic rings, drying of the explants, or their excessive exposure to alkaline pH. Suboptimal preparation of the gels resulting in a defective matrix scaffold can also result in a poor angio-genic response. In addition, the age and genetic background of the animal significantly affect the capacity of the aortic rings to sprout spontaneously or in response to angiogenic factors. Aortic outgrowths in Matrigel are much denser than in collagen and fibrin and more difficult to quantitate by
visual counts due to the intricate branching pattern of the endothelial sprouts and the tendency of mesenchymal cells to arrange in confounding networks, which mimic angio-genic sprouts. Immunostaining of the aortic outgrowths with endothelial markers followed by image analysis may overcome this limitation. For quantitative analysis of the angiogenic response, the visual count method (described in detail in Ref. [104]), becomes challenging when cultures stimulated by growth factors produce 250–300 or more ves-sels. Since the outgrowths of rings oriented with the lumi-nal axis parallel to the bottom of the culture dish (recom-mended orientation) are typically symmetrical, angiogenesis in these cases can be quantified by counting the number of microvessels in half of each culture and then doubling the score. Alternatively, these cultures can be measured by image analysis [105–108]. Finally, for the whole-mount immunohistochemical stain, gel thinness is critical for opti-mal antibody penetration.
5.6 Concluding Remarks
Many of the molecular mechanisms orchestrating angiogen-esis have been discovered, but many others remain to be identified, studied, and evaluated as targets for the devel-opment of new therapies. The aortic ring assay reproduces ex vivo cellular and molecular mechanisms that are essential for the regulation of the angiogenic process. As such, this assay provides an invaluable platform to test new hypotheses and analyze the efficacy of the next generation of angiogen-esis-targeting drugs.
6 Tumor microvessel density
and histopathological growth patterns
in tumors
defined by systematic uniform random sampling (SURS) [112]. These IHC staining assays are robust, fast, and easy to perform and to automate. Although results in individual studies are highly variable, meta-analyses have confirmed the prognostic value of MVD, for example in breast cancer [113] and isolated reports support the predictive value of MVD for anti-VEGF treatment [114, 115]. However, the inter-observer variability of the vessel counting algorithm presents a significant barrier to the use of MVD as a bio-marker [116]. Inter-observer variability can be reduced by applying strict counting rules and by consensus training of individual observers [112].
Although the importance of angiogenesis to tumor biol-ogy is well-established, multiple observations that primary and metastatic tumors develop and progress in the absence of angiogenesis suggest that other mechanisms are frequently involved in tumor vascularization [117]. This represents a challenge to Folkman’s hypothesis that the growth of a tumor is only possible when accompanied by angiogenesis [118]. Moreover, MVD cannot distinguish angiogenic and non-angiogenic tumors. In addition to the high numbers of blood vessels in angiogenic tumor hot spots, high MVD is indeed also observed in non-angiogenic tumors which have co-opted vessels in organs with extensive microvasculature, such as the liver and the lungs [117]. The differentiation of angiogenic and non-angiogenic tumors is, therefore, not related to the absolute number of vessels per surface area but to the growth pattern of a tumor.
6.1 Histopathological growth patterns
Histopathological growth patterns (HGPs) are defined according to the morphological characteristics of the tumor at the interface with the surrounding normal tissue. HGPs are identified by light microscopy in standard hematoxylin-and-eosin stained tissue sections, and distinct HGPs have been described for tumors that grow in the lung, liver, skin, brain, and lymph node [117]. Recently, international consen-sus guidelines for scoring these HGPs have been described [119, 120]. One of the important differences in the biology of tumors with specific HGPs is their means of vasculariza-tion. Liver metastases may present with one of two com-mon HGPs, replacement or desmoplastic. In the replacement HGP, cancer cells “replace” the hepatocytes while co-opting the sinusoidal blood vessels at the tumor–liver interface. Patients with colorectal cancer (CRC) liver metastases with a replacement HGP respond poorly to the anti-VEGF-A treat-ment, bevacizumab, likely because these tumors utilize ves-sel co-option instead of angiogenesis [119]. By contrast, in desmoplastic liver metastases, the cancer cells are separated from the liver by a rim of desmoplastic tissue in which new blood vessels are formed by sprouting angiogenesis. Des-moplastic CRC liver metastases showed a better response
to bevacizumab [119]. Taken together, these observations strongly suggest that HGPs can be used to guide the choice of treatment for individual patients with liver metastases.
Across studies, approximately 50% of patients with CRC liver metastases present with a predominant replacement growth pattern and this proportion extend to 95% when patients with breast cancer liver metastases are considered [119, 120]. This clearly demonstrates that non-angiogenic tumor growth is not a rare phenotype. The same applies to primary lung carcinomas and lung metastases for which angiogenic and non-angiogenic HGPs have also been described [121, 122]. In the non-angiogenic, alveolar HGP, cancer cells fill the alveolar spaces and incorporate the capil-lary blood vessels of the alveolar walls. Approximately, 40% of the lung metastases from clear cell renal cell carcinoma (ccRCC) present with a non-angiogenic HGP despite the fact that nearly all primary ccRCC relies on sprouting angiogen-esis, driven by loss of VHL protein function [122].
The prevalence of non-angiogenic tumors and their resistance to anti-VEGF treatment require the identification of a biomarker that accurately reflects this type of tumor growth. HGPs constitute a good candidate biomarker. The vascular pattern in a tumor section immunostained with pan-endothelial antibodies and the use of antibodies that mark EC participating in sprouting angiogenesis are other poten-tial histopathological methods to distinguish non-angiogenic from angiogenic tumors. Indeed, when the number of hot spots is determined by nearest neighbor analysis in whole-slide digital images of liver metastasis tissue sections stained for CD31, the non-angiogenic, replacement-type metasta-ses clearly resemble normal liver tissue. This contrasts with angiogenic, desmoplastic liver metastases, which show a sig-nificantly higher number of vascular hot spots than normal liver tissue and their non-angiogenic counterparts (Fig. 4).
vessels, with an LH39-positive basal membrane and weak or absent αvβ3 integrin, and arising from the alveolar septa entrapped by the neoplastic cells, were observed [128].
The HGP is not a static phenotype: Systemic treatment of patients with CRC liver metastases can alter the HGP [119]. The fact that the HGPs can change in response to treatment reflects the dynamic nature of tumor vascularization driven by either angiogenesis or vessel co-option. This illustrates the necessity for longitudinal assessment of vascularization mechanisms in tumors during treatment and follow-up of individual patients. In order to achieve this, the histopatho-logical evaluations of the tumor vasculature as described here must be supplemented by medical imaging techniques and/or assays, which utilize small biopsies, circulating tumor cells, endothelial cells, or circulating tumor deriva-tives. Moreover, the importance of an accurate biomarker of ongoing sprouting angiogenesis or non-angiogenic vessel co-option is corroborated by the extensively documented
and strong link between angiogenesis and immune sup-pression [129–131] and the surge of clinical studies that combine anti-VEGF and immunotherapy strategies [132]. In this regard, studies suggested that interactions between endogenous galectins and glycans may link tumor immu-nosuppression and angiogenesis, conferring resistance to anti-VEGF treatment [133].
6.2 Concluding remarks
Although the assessment of MVD has a prognostic value in many different tumor types, this parameter cannot distin-guish angiogenic and non-angiogenic processes of vascu-larization. However, the histopathological growth patterns of, for example, lung and liver tumors accurately reflect the means of vascularization, being sprouting angiogenesis or non-angiogenic co-option of existing blood vessels. We therefore propose to determine both the HGP and MVD when studying the vascularization of tumors. In addition, noninvasive surrogate markers of the HGP should be devel-oped, for example medical imaging parameters, and these markers should be integrated in clinical oncology trials.
7 Assessment of intussusceptive
angiogenesis
Angiogenesis is the de novo formation of blood vessels and can follow either a sprouting or a non-sprouting course. One important non-sprouting mechanism is intussuscep-tion (growth within itself; known also as vascular splitting). Although both sprouting and intussusception lead to an expansion of the capillary network, the processes involve different cellular mechanisms, which are presumably regu-lated by different molecules. Sprouting angiogenesis (SA) is characterized mainly by local vasodilatation, increased vascular permeability, and cell proliferation. It is initiated by proteolytic degradation of the basement membrane, which is followed by migration of proliferating EC into the ECM. The sprouts reorganize internally to form a vascular lumen and to finally connect to other capillary segments [134]. Intussusceptive angiogenesis proceeds through translumi-nal tissue pillar formation and subsequent vascular splitting. The direction taken by the pillars delineates intussusceptive angiogenesis into its overt variants, namely: (1) intussuscep-tive microvascular growth (expansion of capillary surface area), (2) intussusceptive arborization (remodeling of the disorganized vascular meshwork into the typical tree-like arrangement), and (3) intussusceptive branching remodeling (optimization of local vascular branching geometry), includ-ing intussusceptive vascular pruninclud-ing. It has been shown that intussusceptive angiogenesis takes place not only dur-ing physiological processes, but also under pathological
Fig. 4 Microvessel density and histopathological growth patterns. a Unsupervised spatial modeling of the blood vessel pattern in normal liver shows a low number of clusters per number of vessel profiles. A selected region of interest (ROI) at the tumor–liver interface of normal liver in CD31-stained tissue is shown (left). The Blood Ves-sel Analysis algorithm of Definiens™ segments and classifies blood vessel objects (orange) and nuclei (blue) (mid). The Cartesian coordi-nates (x, y) of the centroids of all vessel objects in one ROI were used in a simplified “SeedLink” clustering method [646] (right). Centroids with the same color (e.g., red) belong to the same cluster. b Unsuper-vised spatial modeling of the blood vessel pattern in a colorectal can-cer liver metastasis with a replacement growth pattern shows a low number of clusters per number of vessel profiles. A selected region of interest (ROI) at the tumor–liver interface of replacement growth pattern in CD31-stained tissue is shown (left). The Blood Vessel Analysis algorithm of Definiens™ segments and classifies blood ves-sel objects (red) and nuclei (blue) (mid). The Cartesian coordinates (x, y) of the centroids of all vessel objects in one ROI were used in a simplified “SeedLink” clustering method [646] (right). Centroids with the same color (e.g. red) belong to the same cluster. c Unsuper-vised spatial modeling of the blood vessel pattern in a colorectal can-cer liver metastasis with a desmoplastic growth pattern shows a high number of clusters per number of vessel profiles. A selected region of interest (ROI) at the tumor–liver interface of desmoplastic growth pattern in CD31-stained tissue is shown (left). The Blood Vessel Analysis algorithm of Definiens™ segments and classifies blood ves-sel objects (red) and nuclei (blue) (mid). The Cartesian coordinates (x, y) of the centroids of all vessel objects in one ROI were used in a simplified “SeedLink” clustering method [646] (right). Centroids with the same color (e.g., red) belong to the same cluster. d Tukey boxplots of the normalized number of clusters of blood vessel objects for the desmoplastic growth pattern, the replacement growth pat-tern, and normal liver. There was a statistically significant difference between the growth patterns as determined by one-way ANOVA [F(2,22) = 10.8, p < 0.001]. A post hoc Tukey test showed that the number of clusters divided by number of vessel objects was signifi-cantly different between the desmoplastic growth pattern and the replacement growth pattern (p < 0.05, ‡), but also between the des-moplastic growth pattern and normal liver (p < 0.001,‡). However, no difference was found between the replacement growth pattern and normal liver (p > 0.05). Outliers are plotted as points (·) and extreme values are plotted as asterisks (*)