Ferry–Based Directional Forwarding Mechanism
for Improved Network Life-Time in Cluster-Based
Wireless Sensor Network
Ali Eyadeh and Mohammad Bani Amerah
Communication Engineering Department, Yarmouk University, Jordan
Abstract: Considerable energy saving can be achieved with mobility-based wireless sensor networks (WSN's), where a mobile node (ferry) visits sensing nodes in a network to collect sensed data. However, the critical issues of such WSN's are limited networks lifetime and high data latency, these critical issues are due to the slow mobility and relatively long route distance for ferries to collect and forward data to the sink. Incorporating ferries in WSNs eliminates the need for multi-hop forwarding of data, and as a result, reduce energy consumption at sensing nodes. In this paper, we introduce the One Hop Cluster-Head Algorithm (OHCH), where a subset of ferries serves as cluster heads (CH), travel between nodes with short distance mobility, collect data originated from sources, and transfer it to the sink with minimum hop count possible, this approach can achieve more balance between network energy saving and data collection delay, also, it is an efficient design to combine between ferries and noise.
Keywords: WSN, mobile nodes (ferries), network lifetime, energy saving, data latency.
1.
Introduction
Wireless Sensor Networks (WSN's) consist of large number of small size low power low cost microelectronic devices named sensors that collectively sense, collect, and analyze data. Sensors are used in various applications like surveillance and security, environmental monitoring, traffic monitoring, precision agriculture, smart spaces, manufacturing and inventory control, health monitoring, tracking, and other specialized tasks.
A sensor node is a battery-powered device that includes a combination of micro-electromechanical systems (MEMS), sensor nodes in wireless networks are made up of three units, a transceiver unit that alternate messages with the other sensors, a sensing unit that senses physical events and a processor unit that makes computations on the collected data. Sensors need to work for a long time with a limited battery sources. Routing algorithms have been introduced for prolonging network lifetime. Recent researches showed that hierarchical routing and nodes clustering used as effective approach to save energy.
In addition, recent researches introduce mobility in WSN’s in a hopeful way to reduce consumption in energy in the message transfers between nodes. Mobile node moves through the network to collect sensed data from other sensor nodes, the consumption in energy will be less than before, because a smaller number of devices used for that communication.
Mobile node takes long time to collect data in large networks; hence, not obtaining the delay requirement for
most applications, some applications require more coverage on field, which needs more nodes and hence larger number of transmissions.
Most approaches for data collecting used a mobile sink which makes a tour between sensor nodes and collects data, [1, 2], another approach used rendezvous points (RPs), they collect data and forward it to the mobile nodes when they arrive, [3, 4, 5, 6]. In [7, 8, 9, 10] ferries were used with fitted paths through the network, the ferry stops to buffer data at checkpoints on its planned route trip, but the data latency is very high.
In this paper, we propose a ferry-based approach with a new short distance movement approach, to prolong the network lifetime and to reduce the data latency, using ferries that operate as cluster heads beside static sensing nodes. Instead of large route trip, ferries stay only one hop away from the cluster nodes, ferries change their locations to minimize the network latency, and network lifetime, by reducing the time and transmission energy needed for the static nodes, to transfer collected data. Ferries buffer and aggregate the generated data from nodes and transfer it between other ferries to the sink using a minimum hop procedure.
This paper has five sections: Section 2 reviews some of the related work. Section 3 introduces the proposed algorithm; One Hop Cluster-Head (OHCH), and the synchronization between ferry routes. Section 4 shows the analysis and simulation results and the performance evaluation. Finally, section 5 presents the conclusions and future works.
2.
Related Work
Many researchers have developed a new approaches, schemes and algorithms for mobile nodes and clustering techniques in the wireless sensor network.
Low-Energy Adaptive Clustering Hierarchy (LEACH) is a clusters-based approach in wireless sensor networks that regulates the random reciprocity of network cluster-heads for adjusting the distribution of the energy consumption in network sensor nodes [11]. The LEACH algorithm has invented to decrease the number of data packets that have be transferred to the sink in such network. This algorithm uses topicality adjustments that make the network more scalable and reliable for changes in network typologies, also this algorithm can be used to offer data buffering and aggregation in routing protocols.
proper cluster head in wireless sensor networks, and this selection process depends on some mobility matrices. Authors proved that this approach gives better results compared to the previous random clustering approaches. The authors showed reduction in the number of cluster head changes.
In [1], the authors computed the life time in multiple routing algorithms in three scenarios, all static nodes, only mobile sink, and using a relay. They find that maximum enhancements in life time achieved using mobile sink. Mobile relay must be within a two hop of sink, they assume that all sensors in the network have the location address of the mobile node.
The authors in [4] maximize the life time of the network by exploring the idea of mobility in data collection points (sinks), the authors model, produces sink movement routes that prolonging the network life time five times more, compared with the life time with a static sink.
In [5], the authors introduce a rendezvous based algorithm where a group of nodes acts as a rendezvous points (RP’s), these nodes collect data sensed from sensor nodes and send it to mobile elements when they become near. The RP enables mobile elements to buffer too much amount of data, without go a long route trip. They developed two rendezvous planning approaches, RPCP (Rendezvous Planning with Constrained Path) and RPUG (utility-based greedy heuristic). The RPCP finds the optimal RPs, while RPUG greedily selects the RP to save a maximum amount of energy to collect data with some distances.
Same authors in [6], combined the leads in controlled mobility and data buffering in the network, then balancing the network energy consumption and data latency, the RP's now buffer and aggregate data, authors proposed efficient design algorithms for mobile element with variable and fixed tracks.
In [9], the authors introduce a better data collecting method with the use of a ferry node; named Ferry-based Node Ranking Clustering Algorithm (FNRCA), the authors choose a better method to select cluster heads, depending in distances and the remaining energy in the nodes, they restrict the number of rounds that nodes can be cluster heads for. They studied the scenarios of diagonal paths, fitted diagonal paths, the centerline, and the (NRCA), and these scenarios have been evaluated.
Same authors in [3], improved their approach in [9], the NRCA algorithm now chooses the ferries checkpoints locations in a better way in the network grid, they divided network sensing field area into virtual grids, and the ferries now collect data when they visit the checkpoints only. Authors use TSP approach and a specific algorithm to choose the best ferry nodes path, where checkpoints are listed in a specific sequence.
In [2], the authors study the load balance problem, they improved the collection process for data in wireless sensors network, they propose a mobile base station, to change the nodes that are near to the base station, with the fact that nodes near base station consume more energy than far nodes, they also mention that following the circumference gives an efficient mobility technique in such networks. Results
showed that the mobile station extends the life of the network over three times and decreases the average load in the network.
The authors in [10], compared the uncontrolled mobility of data MULEs with the controllable mobility in sink, where message routing follows multi-hop paths, they conclude that MULEs has preferably used in such networks that built for applications that tolerate delay, but the data latency was very high. In the other hand, the controlled mobility of the sink showed a much better balance between network latency and the lifetime of the network.
In [13], the authors study a multi-objective optimization problem; the data mule path planning optimization (DMPPO) problem, to plan the path for the data mule, and to adjust the sensor nodes transmission ranges, that is to minimize the total energy depletion at sensor nodes, and to minimize the data latency.
In [14], the author proposes an adaptive mechanism called Reliable and Energy Efficient Routing (REER) to ensure the reliability and efficiency of routing data transmission by introducing a new method to create alternative paths together with the routing information obtained during the route detection stage.
In [7], the authors propose a mobility system to collect data packets in the wireless sensor nodes in large environments, they study the problem of initiating paths of multiple mobile elements. They study two versions, the 1D restricted motion in a curve, where the base station is located at one side, and the 2D motion where the mobile element was not attached to a curve. However, it can be attached to any path on the plan. The problem is not like the (TSP) problem because collecting data packets takes time. So, cost is affected by the collecting time, the number of collections and the travel time.
The authors in [8] focus on path selection problem, to minimize the data transfers latency, and they present new methods for the one data mule and the case where many data mules are used. They mention that controlled mobility is more effective. They study the problem of path selection in a form of a graph problem, where they finally show the minimum cost for mobile path with respect to the transfer ranges.
Due to constraints of the communications range, the authors in [15] propose an approach to forward packets from the collection area to the sink by multiple hops and paths to reduce energy consumption.
Mobility-based algorithms have been penetrated in most wireless sensor networks due to their large benefits on reducing the data latency, communication energy consumption, and reduce the total number of transmission relays in communications. New mobility approaches have been proposed to overcome WSN's constraints.
very high.
In this paper, a new algorithm is proposed, in this algorithm, we aim to increase the WSN lifetime, decrease the data latency, and decrease the number of sensor nodes, using mobile nodes (ferries) approach.
In addition, a new approach to imply synchronization between mobile nodes is proposed.
Since the sensor nodes of a wireless sensor network operate using limited sources of energy, and they are made to work in harsh environments in places that cannot be reached easily by humans, it is very hard to change their batteries, so, it is important to minimize the energy consumption of such networks, and prolonging the network lifetime [16].
In addition to saving energy, the use of ferries in WSN’s eliminating the inappropriate use of sensors close to the sink. Using ferries in such networks decreases the message transfer distances, because messages are not alternated throw the whole network [17].
Decreasing the number of sensing nodes reduces the cost of the wireless sensors network implementation, also, decreasing the number of transmissions in such wireless sensors network leads to improvements in terms of increase power saving, and prolong network lifetime. In this paper, we provide algorithmic solution to improve the use of multiple mobile nodes (ferries).
3.
One Hop Cluster-Head Algorithm
The traditional WSN has a single sink; multiple sinks in the network will decrease or sometimes eliminates the presence of uncovered clusters in the network where nodes cannot deliver their data, which leads to a complete disruption of these nodes. Outwardly, using more sinks in WSN can be scalable. Moreover, when the number of nodes increased, this performance can be achieved also. But using a one sink only did not achieve the same performance [18], nodes can select between multiple sinks depends on several factors, like, lower delay, more throughput, lower number of hops. Therefore, the use of multiple sinks in such networks gives better performance in that network compared to the use of single sink and with the same nodes density in the network area [18].
Nowadays, the use of ferry nodes is much better. Ferries are mobile nodes that travel to collect data from sensor nodes and transport it to the base stations. Ferry nodes approach has proposed to save as much as possible energy of the network sensor nodes, but the most disadvantage of the data collecting approach using the ferries is the high data latency, which depends on the network layout, speed and direction of the ferries. The algorithm proposed in this paper gives a solution to decrease the data latency while prolonging the network lifetime.
In this paper, we propose a proactive network that can adapt itself, via physical movement, to meet the needs of several applications. In this network a subset of ferries serves as cluster heads (CH) travel between nodes with short distance mobility, ferries buffer and aggregate data originated from sources and transfer it to the sink with minimum hop count possible. This approach can achieve more balance between network energy saving and data collection delay. In this paper, an efficient design algorithm to combine between ferries and nodes has proposed, with a new short distance
movement approach for ferries that operate as cluster heads, beside static sensing nodes instead of large route trip.
3.1 System model
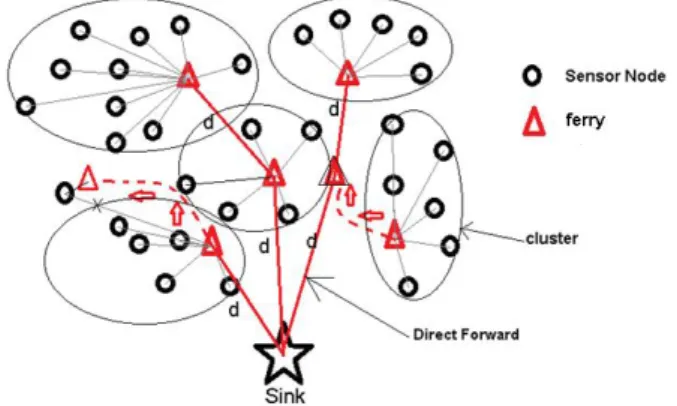
The proposed system model is illustrated in figure 1. We determine a number of sensing nodes and ferries, and their locations. Static nodes deployed randomly over the observation area, while ferries deployed with control of their locations, the sink will be on the edge of the observation area.
Figure 1. Testing data- load current (amperes) 3.2 Algorithm's concept
Energy saving is an important issue in all networks; the mission of some applications lasts for several months or years. Efficient energy saving can prolong the wireless sensor network lifetime. In addition, decreasing the data latency increases the accuracy of an application.
In this paper, we propose a One-hop Cluster-Head (OHCH) algorithm to investigate these challenges. Where the use of the short distance movement in ferries with the one hop transmission between ferries and static nodes instead of large tour mobility improves the network latency and the network lifetime, and reduces the cost of the implementation of the WSN because the OHCH algorithm reduces the number of nodes needed. Ferries stay only one hop away from the cluster nodes, ferries change their locations to minimize the network latency and increase the network lifetime by reducing the time and transmission energy needed for the static nodes to transfer collected data.
In addition, this algorithm reduces the transmission period between sensing nodes and sink, reduces the number of nodes participate in the transmission procedure and eliminates the need for a gateway points, in other words it reduces the number of transmissions. Ferries buffer and aggregate the generated data from nodes and transfer it between other ferries to the sink using a minimum hop procedure. In this paper, we assume that static sensor nodes are homogeneous; all nodes have same sensing, computation, and communication abilities, with same battery power. Ferries are location aware nodes that have movement ability and rechargeable batteries, and have all properties of static sensor nodes, transmission range of ferries are farther than static nodes transmission range.
network leads to improvement in terms of increase power saving and prolong network lifetime, OHCH algorithm provide algorithmic solution to improve the use of multiple ferries in wireless senor network.
3.3 Algorithmic approach
The One Hop Cluster Head (OHCH) algorithm divides the network into clusters and assigns a ferry for each cluster as cluster head for the nodes in cluster. Ferry moves between cluster nodes, while preserving the one hop transmission distance from nodes, ferries do not exceed the cluster borders, but they stay in locations where traffic exist. A node may be assign to multiple ferries. When a ferry goes away from a node more than the distance allowed for the one hop transmission, node inters a sleep mode until a ferry be close enough, data is buffered in the ferries for a sufficient period of time before it can be transmitted to another ferry. OHCH minimizes the delay in the network nodes through direct interaction between ferries. The energy model that used is given by the following Equations [19]:
E residual, j (t) = E initial, j (t-1) – E TX, j (t), for every node j (1) E r
(0)
= E initial (2) We will use Eq. 1 to calculate the network lifetime from time (t=0) until the residual energy vanish (E residual = 0), Eq. 2 indicates the initial energy at time (t=0), with the assumption that the time between (t -1) and (t) is continuous for the energy consumption measurement. By using the proposed algorithm, the consumed energy of wireless sensor network will be reduced. The minimum Euclidean distance of node (i) to the ferry path is given below in Eq. 3:
|D (I, Route)|=√ ((Nodex(i) - Rx)2 + (Nodey(i) - Ry)2) – c (3) Where Nodex(i) and Nodey(i) are x and y location for node
(i) respectively, and Rx and Ry are the x and y location for
the center of the route respectively, cr is the radius of the ferry route.
The proposed algorithm must be explained in step by step. It determines the location of the sink at the edge of the network and the borders of the network, then divides the network into grid, and specifies the clusters in the network, and then deploy the static nodes randomly in each grid. The algorithm specifies the radius of the ferries routes in each cluster in order to minimize the distances between sensor nodes and the ferry. The algorithm calculates the minimum distances between each static sensor node and the ferry route using Eq.3, to be used in Eq.1 later to calculate the dissipated energy, specifically shown below in Eq. 4:
E residual, j (t)
= E initial, j (t-1)
– (((E TX, j (t)
+ ERX,j (t)
) * pct) + ( Eamp * d(i)2 )) (4) Where the ETX, ERX and Eamp are the transfer energy, the
receive energy and the amplification energy respectively, and the pct is the packet size in bit, d(i) is the distance between ferry route and the node (i). If the radius of the ferry route is cr, see figure 2, then we can calculate the distance that a ferry travels, which is equal to:
Distance = 2 * pi * cr (5) The route distance for all ferries in the network are same, the total distances that all ferries travel in the network can be calculated by multiplying the distance for each ferry with the number of ferries in the network.
Figure 2. Radius of ferry route
Moreover, the total travel distance for a ferry in cluster will be:
Total distance = (Distance * number of routes) (6) In addition, if the ferry travels in a speed of 1 m/s, then, the round time will be equal to:
Round time = Distance (m) / 1 (m/s) (7) The energy emitted from the sensors at transmission and receives follow the power model that is distance dependent:
Pr = Pt * (d0 / dr)n (8) Where Pr, Pt, d0, dr and n are the received power, transmitted power, distance at a reference point, receive distance and the path loss exponent respectively, in this paper, the path loss exponent n is equal 2.
3.4 Synchronization between ferry routs
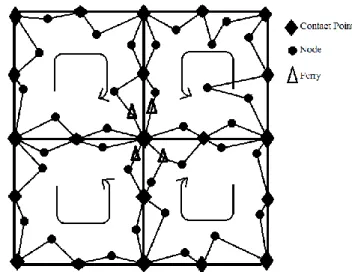
To achieve synchronization between ferry routes we have used a synchronization scheme inspired by [20] with the assumption that all routes have the same length. Network divided into a grid of L1 * L2 clusters. Ferries coincide with each other at several contact points of the boundary between clusters; ferries in adjacent clusters move in reverse direction and different timing, for the case with a two-dimensional grid, each route have eight contact points, see figure 3.
A new method, to balance between the network data latency and the network lifetime, is shown in figure 4 below, in this figure; ferries are meeting to exchange data in a reciprocity manner, here, the upper six ferries are meeting to exchange data, then after a half-cycle the lower six ferries meet to exchange data. This method differs from the synchronization scheme in [20] by decreasing the ferry route distance and reducing the number of contact points for each ferry. Ferries travel in the cluster in a circular way between sensor nodes without moving towards each node to collect data. This decrement in the ferry route distance decreases the data latency in the network in a noticeable way. In addition, reducing the number of the contact points where ferries do not need to touch numerous contact points frequently, decreases the ferry route distance and saves energy.
Figure 4. Reciprocity synchronization method Now if we change the starting point for ferries, we can make them meet in different order, depend on the object of the application, as shown in figure 5.
Figure 5. Synchronization way for ferries
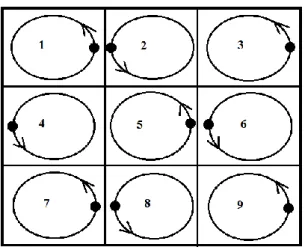
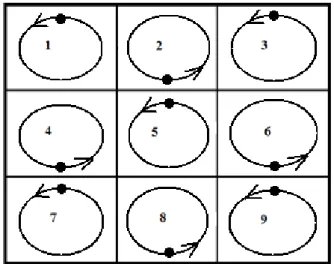
In figure 6, ferries in adjacent clusters 2-3, 4-5 and 8-9, are meet periodically to exchange their data, however, ferries in cluster 1,7 and 6 are still have their data. When ferries complete one-quarter cycle, different ferries will meet in different clusters, see figure 6 below, ferries in adjacent clusters 1-4, 3-6 and 5-8, are meeting to exchange their data where ferry in cluster 7 still not linked to another ferry. In the next one-quarter cycle, ferry in cluster 7 meet with ferry in
cluster 8, also ferries in adjacent clusters 1-2 and 5-6 are meet again to exchange their data, then routes continue, as shown in figure 7, this method is a one-quarter cycle synchronization.
Figure 6. Synchronization between ferries 1-4, 3-6, 5-8
Figure 7. Synchronization between ferries 1-2, 5-6, 7-8 However, instead of synchronizing ferries in clusters 7 and 9 with the adjacent clusters, they can also transfer their data directly to the sink in the situation shown in figure 6. With the assumption that the distance between the sink and the ferry is less than the maximum transmission range for ferries, messages can be transmitted directly between ferries in clusters 7 and 9 and the sink. To prove this, let the distance from the sink to the center of the clusters 7 or 9 be d, and the ferry cycle radius is cr, then by using simple calculations and Pythagoras theorem, the minimum distance between the ferry and the sink will be equal to d-cr, as shown in figure 8. If we assume a 100*100 meter square network area and each of the cluster side is 33.3 meter with a 60-meter transmission range, then the distance d-cr is equal to 25.2 meter, which is less than the transmission range.
In the one-quarter cycle synchronization, we can reduce the number of transmissions between ferries by increasing the period between the ferries synchronization to be in the method of one-half cycle synchronization. In the one-half cycle synchronization method, the first synchronization occurs in the figure 6, where ferries in the adjacent clusters 1-4, 3-6 and 5-8 are meeting to exchange their data. The next synchronization is occurring after a one-half cycle of the ferries route, as shown in figure 9, where ferries in the adjacent clusters 2-5, 4-7 and 6-9 are meeting to exchange their data.
Figure 9. Synchronization between ferries 2-5, 4-7, 6-9 The one-half cycle synchronization method makes data flow in the network from the distal clusters from the sink 1, 2 and 3, through clusters 4, 5 and 6, then to clusters 7, 8 and 9 toward the sink in a columnar way, as shown in figure 10. The network is divided vertically with three columns 1-4-7, 2-5-8 and 3-6-9. In each column, ferry meets his lower adjacent ferry to exchange data in the one–half cycle synchronization method. By using the data ferries to collect data from the static sensor nodes, the energy consumption can be reduced, and hence increase the network lifetime. The one-half cycle synchronization method decreases the transmission distance between ferries and reduces the delay between message exchanges. In this paper, the one-half synchronization method will be simulated and analyzed
Figure 10. Data flow in a columnar way
4.
Analysis and Simulation Results
Now, we present the experimental results that evaluate the performance of the proposed algorithms and systems. Experimental results obtained using MATLAB simulator, the problem is a NP-hard problem, to verify the improvement in data latency and energy consumption compared to other algorithms in the related work. Variant simulation results will be present, discussed and compared in this section.
In this simulation, 90 and 135 static sensor nodes were deployed randomly within a two-dimensional network area of 100 * 100 meter square, as shown in figure 11. The sink is located at the edge of the network, the network is divided into 9 clusters and 9 ferries attached to these clusters as cluster heads. Ferries travel in clusters circularly, each in same direction with respect to the neighbor ferry, ferries travel with the speed of 1m/s in order to collect data from static sensor nodes using only one hop transmission, then ferries buffer and aggregate data and exchange the data with the specific neighbor ferry.
Figure 11. Random deployment of sensors The radius for ferry route (cr) is 12 m in default for the dimensions used in this simulation. The maximum transmission range of sensor nodes is 40 m and 60 m for ferries, 100 runs was considered to evaluate the performance of this method. The energy consumption model used in this paper is the classical energy consumption model proposed in [11], with the assumption that the energy consumption is most likely dominated by the communication subsystem, this model is illustrated in Table 1 below. This classical model is commonly used in the simulation scenarios in various applications of WSN’s to compare their results.
Table 1. The Classical Model For Energy Consumption
The processor unit and the sensing unit energy consumption are neglected. In addition, the time needed to transfer data between sensors and ferries is neglected. The initial energy in
Operation Mode Energy Consumption
Transmitter Electronics (ETX-elec)
Receiver Electronics (ERX-elec)
(ETX-elec = ERX-elec = Eelec)
50 nJ/bit
Transmit Amplifier (Eamp) 100 pJ/bit/m2
the static sensor nodes is 0.5 J, and 50 J for the ferry with 0.0753j per round movement energy, the packet size for sensor nodes is 256 bits and for ferries is 10240 bits, these values are chosen depends on standard values, to compare with the related works and previous works. In this simulation different scenarios are evaluated and compared to obtain the best result in achieving our goal in decreasing the data latency and increasing the network lifetime.
Network Lifetime can be explained as the maximum time for the network to become disconnected, sometimes it is defined as the time as the first sensor dies in the network, and sometimes it is defined as the time as the last sensor dies in the network. Some others define the network lifetime as the time until the network efficiency goes under a specific level. In this simulation, the lifetime as the first sensor node dies was significantly increased, and the lifetime until the last sensor dies is also increased.
In figure 12, the maximum number of rounds, when the last sensor dead in the network, is an average of 19531 rounds, which is about 1757790 packets transfer to the sink, where an average of 17526 rounds done until the first sensor node dead in the network, which is about 1577340 packets transfer to the sink. The 2005 rounds difference between first node dead and last node dead, is due to the small distance between sensor nodes and ferries.
Figure 12. Number of dead nodes versus number of rounds for 90-node
However, for the 135-node network, simulation shows that changing the number of static sensor nodes in a same network area, does not make a noticeable change in the number of rounds, as shown in figure 13.
Figure 13. Number of dead nodes versus number of rounds for 135-node
Changing the ferry speed, by decreasing or increasing it, with the same movement energy values and the same round-trip distance, makes a noticeable change in the number of ferry rounds, as shown below in figure 14. As a result, for a short distance movement, keeping the ferry speed in low ranges shows enough ferry rounds.
Figure 14. Varying the ferry speed
In addition, changing the message rate in each round in the network has a very useful impact in changing the network lifetime. When the message rate decrease, the network lifetime will noticeably increase, and vice versa. In this simulation, the message rate was varied from 1 to 90 messages per round for the 90-node network and varied from 1 to 135 messages per round for the 135-node network, as shown in figures 15 and 16, respectively.
Figure 15. Varying message rate in 90-node network
To study our method clearly, we must analyze the results in a long-term analysis, and study the impact of the simulation on sensor nodes even if they already consumed their energy or dead. In figure 17, we study the total energy consumption of each static sensor node in the network by observing the different amount of energy consumption for each node after all nodes consumes their energy and dead.
From figure 17, the vast majority of nodes save energy in their lifetime and did not consume large amount of energy in their positions, these nodes are close to the ferry route, while the minority of sensor nodes consume larger amount of energy in their positions, and these nodes are far from the ferry route. Figure 18 also shows the energy consumption of each static sensor node in the network when the first node dead. Figures 19 and 20 show the energy consumption in a 135-node network for last node dead and first node dead respectively.
Figure 17. Total energy consumption in sensor node
Figure 18. Energy consumption when first node dead
Figure 19. 135-node energy consumption for the first node dead
Figure 20. 135-node energy consumption for the last node dead
This variation in the amount of energy consumption depends on the distance between the sensor nodes and the ferry route, ferry travles in the cluster circularly with a specific radius (cr) from the center of the cluster, increasing or decreasing this radius, changes the nodes that are exposed to loss more enrgy. A future work soultion that can solve this problem and make a better energy consumption distribution, is to make ferries change their radius (cr) depend on the remaining energy in sensor nodes.
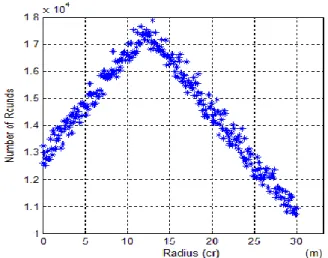
Figure 21 ilustrates the ferries route model in the clusters for efficient covarege. Figure 22 shows the impact of changing the ferry route radius (cr) on the maximum number of rounds until the first sensor dead in the 90-node network, the figure shows that the effictive radius is between 10 and 15 meter from the center of the cluster. However, excelent covarege in clusters can be achived at 12 meter radius. Figure 23 shows no change in the effect of cr on number of round when we increase the number of nodes to 135-node.
Figure 21. Coverage in the network
Figure 23. Impact of changing cr on total number of rounds in 135-node
Data Latency is the amount of time it takes a packet of data to move across a network connection. Latency determines the network connection speed. Incorporating ferries in WSNs eliminates the need for the traditional multi-hop transferring of data, also decreasing the data latency in the network. In other words, the use of the short distance movement in ferries with the one hop transmission between ferries and static nodes instead of large tour mobility improves the network data latency. The proposed algorithm reduces the number of nodes participate in the transmission procedure and eliminate the need for a gateway points, in other words it reduce the number of transmissions.
In this paper, the ferry speed is 1 m/s and the ferry route radius is 12 m. If we neglect any halts, breakdowns, synchronizations and transfers time, the minimum amount of time for a packet of data to move from the sensor node and the sink is 75.4 seconds for the sensors in the first layer of clusters, and a maximum of 226.2 seconds for last cluster. Figure 24 shows the impact of increasing the ferry speed on decreasing the packet delay if we neglect the transmission and synchronization times. However, increasing the ferry speed in a short route distances as proposed in this paper does not make sense, because the delay at low speeds is sufficient for most applications.
Figure 24. Ferry speed versus packet delay
OHCH algorithm reduces the cost of the implementation of the WSN because the algorithm decreases the number of nodes needed. In the other hand, increasing the number of sensor nodes in the network, does not increase the data latency in a noticeably way, but, increases the lifetime. In the dynamic clustering Low-Energy Adaptive Clustering Hierarchy (LEACH) [11], for 100 sensor nodes and 100*100 meter square network area, the network lifetime was improved compared to other algorithms like Direct, Minimum-Transmission-Energy (MTE) and Static Clustering. The lifetime was increased to reach 2608 round for the last node dies, and 1848 round for first node dies for a 1 joule per node. When they use 0.5 joule per node the number of rounds was 1312 and 932 respectively. In this paper the algorithm improves the lifetime compared to (LEACH) in very noticeably way.
In [9] the proposed algorithm extends the lifetime by increase the number of check points in a ferry-based data gathering approach, this approach was used to eliminate or minimize the use of multi-hop forwarding, the lifetime reaches 3910 rounds for the last node to die.
In [2] the algorithm improves the lifetime 400% using mobile base station over the static base station, unfortunately, it is not a noticeable percentage and the data latency was very high because of the large tour of the base station used in the approach.
In [10] the data latency was very high using the data mules for a minimum of 7245.28 seconds using 4 data mules, network lifetime was increased using the mobile sink for a maximum of 512% over the static sink. In this paper the improvement over the static network is more than 1200% which is a noticeably percentage compared to the previous algorithms.
5.
Conclusions
In this paper, we proposed an algorithm to solve the data latency and network lifetime problems, the One Hop Cluster-Head (OHCH) algorithm. In this algorithm, the use of the ferries in the clusters as cluster heads between the static sensor nodes with the techniques proposed shows better performance than the previous algorithms in prolonging the network lifetime and reducing the network data latency. In addition, simulation results show that keeping the radius of the ferry tour between 10 and 15 meters from the center of the cluster increases the network lifetime compared of being at the center of the cluster or at the periphery of the cluster. In this paper, the performance of the proposed algorithm was compared to multiple algorithms, we observed that using ferries in circularly tour in clusters is significantly improves the performance of the network.
The analysis also showed that increasing the number of sensor nodes in the network does not increase the total tour length of the ferries unless the area of the network increased, which reduce the data latency even in a dense network. The use of ferries in WSN’s prolongs the network lifetime in a noticeable way. In addition, the short distance mobility of the sink shows great improvements in reducing the data latency and saving energy.
applications require more evolution, specifically in reducing the delay and data latency and increasing the network lifetime and response time to an event.
A future work scenario can be applied to this work to extend the network lifetime, is to make the sensors that are near to the ferry, work and send their data only. On the other hand, the sensors that are distant from the ferry, take a sleep mode until all near sensors deplete their energy, then the distant sensors will work and send their data, until they deplete their energy.
Another method that will be effective in saving sensor nodes energy is to make the ferries adaptive to change their tour radius heading towards specific sensor nodes that have less amount of energy.
In addition, with the fact that ferries near the sink consume more energy than ferries distant from the sink, because they transfer larger number of packets. Ferries can change their clusters through the network to balance the energy consumption between them.
References
[1] W. Wang, S. Vikram, and C. Kee-Chaing, "Using mobile relays to prolong the lifetime of wireless sensor networks," Proceedings of the 11th Annual International Conference on Mobile Computing and Networking, pp. 270-283, 2005.
[2] J. Luo,.and J. P. Hubaux, "Joint mobility and routing for lifetime elongation in wireless sensor networks," Proceedings of the 24th IEEE Conference on Computer Communications. Vol. 3, pp. 1735-1746, 2005.
[3] M. Alnuaimi, et al. "Data gathering in delay tolerant wireless sensor networks using a ferry,"Sensors, Vol. 15, No. 10, pp. 25809-25830, 2015.
[4] Z. M. Wang, S. Basagni, E. Melachrinoudis, C. Petrioli, "Exploiting sink mobility for maximizing sensor networks lifetime," System Sciences, 2005. HICSS '05. Proceedings of the 38th Annual Hawaii International Conference, pp. 287a-287a, 2005.
[5] X. Guoliang, W. Tian, X. Zhihui, J. Weijia, "Rendezvous planning in mobility-assisted wireless sensor networks," Real-Time Systems Symposium, 2007. RTSS 2007. 28th IEEE International, pp. 311-320, 2007.
[6] X. Guoliang, L. Minming, W. Tian, J. Weijia, and H. Jun, "Efficient rendezvous algorithms for mobility-enabled wireless sensor networks," IEEE Transactions Mobile Computing, Vol. 11, No. 1, pp. 47-60, 2012.
[7] D. Bhadauria, T. Onur, and I. Volkan, "Robotic data mules for collecting data over sparse sensor fields,"Journal of Field Robotics, Vol. 28, No. 3, pp. 388-404, 2011.
[8] R. Sugihara, and G. K. Rajesh, "Path planning of data mules in sensor networks,"ACM Transactions on Sensor Networks (TOSN), Vol. 8, No. 1, 2011.
[9] M. Alnuaimi, et al. "Ferry-based data gathering in wireless sensor networks with path selection." Procedia Computer Science, Vol. 52, pp. 286-293, 2015.
[10]S. Basagni, A. Carosi, and C. Petrioli, “Controlled vs. uncontrolled mobility in wireless sensor networks: some performance insights,” Proc. IEEE Vehicular Technology Conference, pp. 269–273, 2007.
[11]W. R. Heinzelman, A. Chandrakasan, and H. Balakrishnan, "Energy-efficient communication protocol for wireless microsensor networks," in System Sciences. Proceedings of the
33rd Annual Hawaii International Conference, Vol. 2, pp. 10, 2000.
[12]P. Basu, N. Khan, and T. D. C. Little, "A mobility based metric for clustering in mobile ad hoc networks," Distributed Computing Systems Workshop, 2001 International Conference, pp. 413-418, 2001.
[13]Y. Lai, and J. Jehn-Ruey, "A genetic algorithm for data mule path planning in wireless sensor networks,"Appl. Math. No. 1, pp. 413-419, 2013.
[14]I. Aloui, O. Kazar, L. Kahloul, and S. Servigne, "A new itinerary planning approach among multiple agents in wireless sensor networks, (WSN) to reduce energy consumption,"International Journal of Communication Networks and Information Security, Vol. 7, No. 2, pp. 116-122, 2015.
[15]A. Saleh, "Bio-inspired technique: An adaptive routing for reliability and energy efficiency method in wireless snsor networks," International Journal of Communication Networks and Information Security, Vol. 9, No.2, pp. 247-252, 2017.
[16]Y. S. Yun, and X. Ye. "A method for deciding node densities in non-uniform deployment of wireless sensors,"Modeling & Optimization in Mobile, Ad Hoc & Wireless Networks (WiOpt), 11th International Symposium on IEEE, pp. 264-271, 2013.
[17]I. Jawhar, et al., "Ferry-based linear wireless sensor networks,"IEEE Global Communications Conference (GLOBECOM), pp. 304-309, 2013.
[18]C. Buratti, et al. "An overview on wireless sensor networks technology and evolution,"Sensors, Vol. 9, No. 9, pp. 6869-6896, 2009.
[19]N. Kamyabpour, and D. B. Hoang. "Modeling overall energy consumption in wireless sensor networks," arXiv preprint arXiv: 1112.5800, 2011.