TiSEFE: Time Series Evolving Fuzzy Engine for
Network Traffic Classification
Shubair A. Abdullah
1and Amaal S. AL-Hashmi
21
Sultan Qaboos University, College of Education, Department of Instructional & Learning Technology, Oman
2
Sultan Qaboos University, College of Science, Department of Computer Science, Oman
Abstract- Monitoring and analyzing network traffic are very crucial in discriminating the malicious attack. As the network traffic is becoming big, heterogeneous, and very fast, traffic analysis could be considered as big data analytic task. Recent research in big data analytic filed has produced several novel large-scale data processing systems. However, there is a need for a comprehensive data processing system to extract valuable insights from network traffic big data and learn the normal and attack network situations. This paper proposes a novel evolving fuzzy system to discriminate anomalies by inspecting the network traffic. After capturing traffic data, the system analyzes it to establish a model of normal network situation. The normal situation is a time series data of an ordered sequence of traffic information variable values at equally spaced time intervals. The performance has been analyzed by carrying out several experiments on real-world traffic dataset and under extreme difficult situation of high-speed networks. The results have proved the appropriateness of time series evolving fuzzy engine for network classification.
Keywords: high-speed networks, network traffic analyzing, network traffic classification, big data, fuzzy logic, time series
1.
Introduction
Network traffic monitoring and analysis (NTMA) is a process of capturing and analyzing network traffic data to take a clear picture of what is going on the network. NTMA is a critical and demanding task because it makes the network administrators acting in advance to deal with unexpected security breaches, which are often, dangerous and sophisti-cated in nowadays [1]. Network traffic monitoring approaches can be classified into two categories: active and passive. Active approaches involve injecting traffic into a network to perform different types of measurements and usually done by employing some network tools such as Ping and Traceroute. Passive approaches involve capturing network packets or network flows to perform further analysis. Such approaches are not viable in high-speed networks as they require substan-tial hardware for storage and analysis [2].
Recent networks have witnessed some sophistication such as cloud services, content delivery networks (CDN), and the high bandwidth video-streaming services. The network traffic is becoming extremely big, heterogeneous, and very fast. The data carried out by the traffic contains several types of meas-urements originated from different types of logging systems [3]. Therefore, the NTMA faces big difficulties to monitor and analyze the network traffic. Such huge traffic data which passes network nodes in a very short time makes the NTMA a kind of big data analytics. The concept of Big Data (BD) is interpreted as “too big, too fast, or too hard for existing tools to process” [4] which is exactly the nature of nowadays network
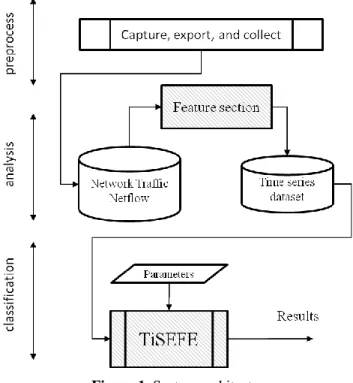
traffic data. The progress achieved in the BD analytic research field has led to new inventions of large-scale data processing systems. However, producing a benchmark network traffic big data analytic approach is a big challenge for the large-scale networks [5]. There is needed for a comprehensive data processing system able to extract valuable insights from the live, big, and heterogeneous network traffic data. The system should offer possibility to learn the normal network situation and to detect malicious attacks and intrusions [6]. In addition to the BD characteristics, the network traffic has uncertainty nature. The traffic volume between each source-destination is very high. It is not easy to capture traffic data and extract the characteristics of traffic. The network traffic big data, either in normal or attack situation, is unknown and not predictable. The goal of this research paper is to use the time series and the fuzzy logic for online detecting anomalies. It contributes to the filed by introducing the Time Series Evolving Fuzzy Engine (TiSEFE). TiSEFE is a new fuzzy engine to detect anomalies in networks by inspecting the Network Traffic Time Series Data (NTTSD). NTTSD is a network traffic big time series data where a sequence of values of traffic information is indexed at equally spaced time intervals. The network traffic data could be obtained from any modern flow export protocols, such as NetFlow [7]. The network traffic data passes through two stages before running TiSEFE. In the first stage, the network traffic data is captured, exported, and collected, while in the second stage, the features are selected to produce NTTSD. Then the training phase is applied on the NTTSD for modeling normal network traffic in order to spot abnormal behaviors in the real-time environment. The main advantage of TiSEFE is the ability to cope with the uncertainty nature of network traffic. This is done by evolving the knowledgebase using the fuzzy logic.
The remainder of this paper is structured as follows. Section 2 provides background information and reviews related work. The TiSEFE is explained in Section 3. After that, Section 4 presents and discusses the experimental results. Finally, the paper is concluded in Section 5.
2. Background and Related Work
accurately and (ii) to gain insight into the relationship between the features and the required response [10].
Since the beginnings of the emergence of BD, several novel large-scale data processing systems have been developed based on the concept of Data Stream Management Systems (DSMSs), such as Gigascope [11], Borealis [12], Esper [13], and Streambase [14]. A common feature of many systems is that they do not meet the requirements of NTMA applications, e.g. performing continuous analytics, dealing with high-volume data stream, and supporting analytics over historical data [15]. Another noted research trend is the emergence of big data analysis open source systems. Hadoop [16] and Hive [17] are two popular examples. The DBStream is another more recent example of open source systems that is designed based on traditional database techniques [3]. These systems have a chance to be better quality, more secure and less prone to bugs than proprietary systems because they are available as open source. Also, these systems can be employed in NetFlow-based network traffic analysis systems as most of them able to collected and analyzed. However, analyzing NetFlow big data requires development of more adaptive and robust approaches and could create issues of experimental variations, and statistical biases.
The NTMA has witnessed applying machine learning techniques for detecting network anomalies. Systems published in [18, 19] are good examples that might be used in NTMA applications due to their accuracy and computational efficiency on large datasets. Many supervised and unsuper-vised machine learning based approaches are proposed using different techniques e.g. Bayesian classifiers, nearest-neighbors, decision trees, support vector machine, and k-means. Interested readers may refer to [20] for a detailed overview of the machine learning techniques applied to NTMA. Despite the noticed achievements in the field of NTMA research, the uncertainty of network traffic is still big challenge. The volume of traffic is highly volatile and unpredictable either in normal or attack situation. In both situations there is a high possibility that a large number of packets initiated in the network over a short amount of time and exhibit normal behavior [21]. This makes it difficult for statistical schemes that work based on traffic data to differentiate between normal and attack traffic. Although the fuzzy logic has been presented relatively a long time ago as quite distinct theoretical foundations for decision making in situations of uncertainty [22], the need for research to
characteristics in addition to the incorporation of fuzzy inference methodologies into the classification process. Conventional classification methods use static, un-growing, not refined knowledgebase to classify network traffic big data. It has been approved that the complexity of network security problems, particularly the detection of active attacks, e.g. botnets and DoS, requires on-line adaptive classification systems able to increase their knowledgebase as they operate.
Figure 1. System architecture
3.1 Preprocess Stage
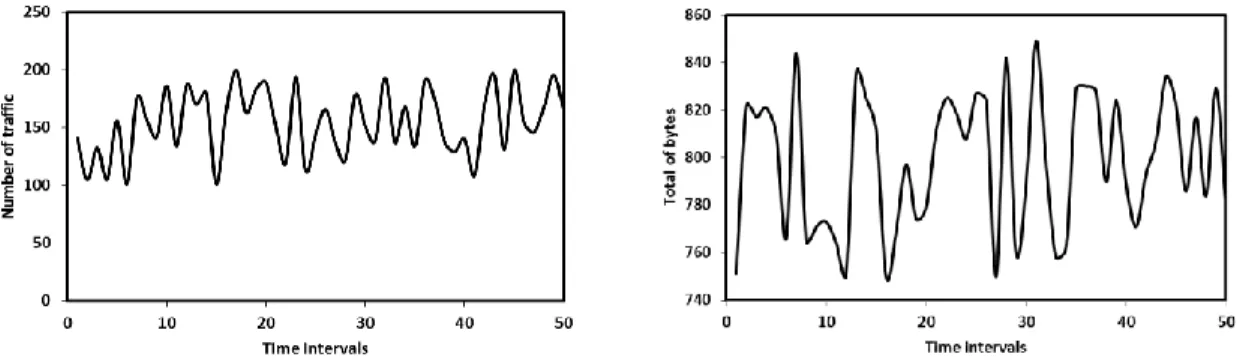
Figure 2. Time series example, number of traffic initiated (left) and number of bytes sent (right) per 1 second interval
3.2 Analysis Stage
The analyze stage performs the construction of time series network traffic data, the NTTSD. Firstly, the intervals must be fixed and determined, e.g. 1 second, to allow the system to collect the flow data per identical time intervals. Secondly, the features selection task is performed to select one or more features from the NetFlow records. The features and the number of features are set depending on their influence. In this research, two features are selected: number of traffic and total bytes. Information on the number of traffic and total bytes is not directly available from the NetFlow records collected. To approximate these two metrics, some aggregation functions must be used such count and sum. The result of this stage is a time series data of two metrics per time interval. Figure 2 shows two examples of time series.
3.3. Classification Stage
The classification stage is the final stage where TiSEFE classifies the traffic flows into normal or attack by taking the NTTSD constructed into account. The classification stage involves three phase: training, evolving, and classification. In the first phase, the training phase, a trained model for identifying the attack network traffic is generated offline using NTTSD. The evolving phase is an optional phase. It aims at evolving the model’s knowledgebase to get more accurate classification results. In the third phase, the model is used for
classifying the network traffic into normal and attack in the real-time environment.
3.3.1 Training Phase
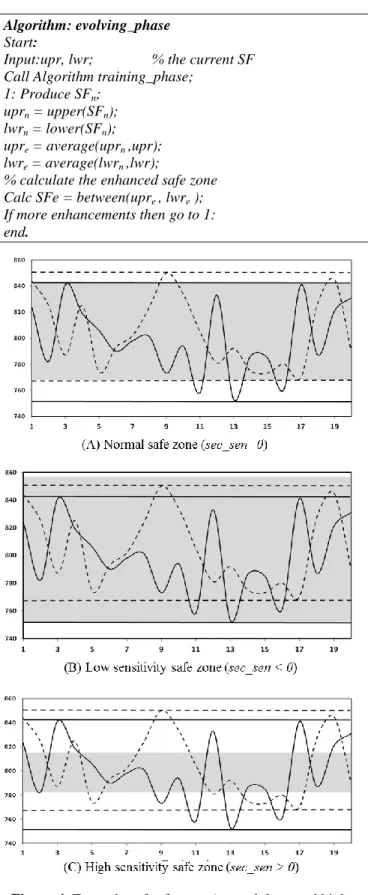
Like any other fuzzy inference system, TiSEFE needs to be trained. The main goal of the training phase is to model the normal behavior of the network traffic from NTTSD. Anything that does not correspond to the normal behavior model will cause an alarm. Advantages of the normal behavior model are: (1) it is easy to extract, (2) has low computational cost and complexity, and (3) can be set to high level of sensitivity against attacks, i.e. everything which has not been seen previously is attack or at least suspicious. Figure 3 explains the training phase. Two NTTSDs for two traffic features (number of traffic and total bytes) are constructed. The first feature is showed by dashed line time series (dashed curve) and the second feature is showed by solid line time series (solid line curve). The modeling process creates the normal behavior following simple, straight throw subprograms. For better understanding the training phase, a description of the terms and symbols used is given. The upr_1 and upr_2 represent the upper values of first and second features respectively. They are showed in Figure 3 by the upper horizontal dashed and solid lines respectively. Lower values of the features are represented by lwr_1 and lwr_2 which are showed in the figure by the lower horizontal dashed and solid lines respectively.
positive, the SF will be larger than the normal setup which means low sensitivity against the malicious traffic, and if it is negative, the SF will be smaller than the normal setup which means high sensitivity against the malicious traffic. Figure 4 shows examples of SFs formed using different values for sec_sen variable. The training phase of TiSEFE is achieved by supervised learning algorithm, which is described in the pseudo code, training_phase algorithm.
3.3.2 Evolving Phase
One aspect that makes TiSEFE more resilient to the uncertainty of network traffic is its ability to enhance the trained model. The evolving phase is taken place online as the system operates and aims at evolving the knowledgebase used in the classification phase. Once the training phase finish, the trained model could be enhanced by integrating new different models that are produced under different conditions, for instance, producing trained models for the network during the busy hour traffic and non-busy hour traffic. The evolving phase involves three steps. In the first step, it constructs a new NTTSDn for the same features. The second step forms new SFn that is defined by uprn and lwrn. Finally in the third step, the enhanced SFe is formed between the average of uprn and upr at the top and the average of lwrn and lwr at the bottom, where the upr and lwr are parameters of the current SF. The evolving_phase algorithm describes the evolving phase of TiSEFE.
Algorithm: training_phase Start:
Input: fdts; % features data time series Input: sec_sen; % security sensitivity set counter = 0;
do
% find the max and min values of the time series calc max(fdts(counter));
calc min(fdts(counter)); until no fdts
% calculate the safe zone calc sz = (min(max), max(min)); end.
Calc SFe = between(upre , lwre ); If more enhancements then go to 1: end.
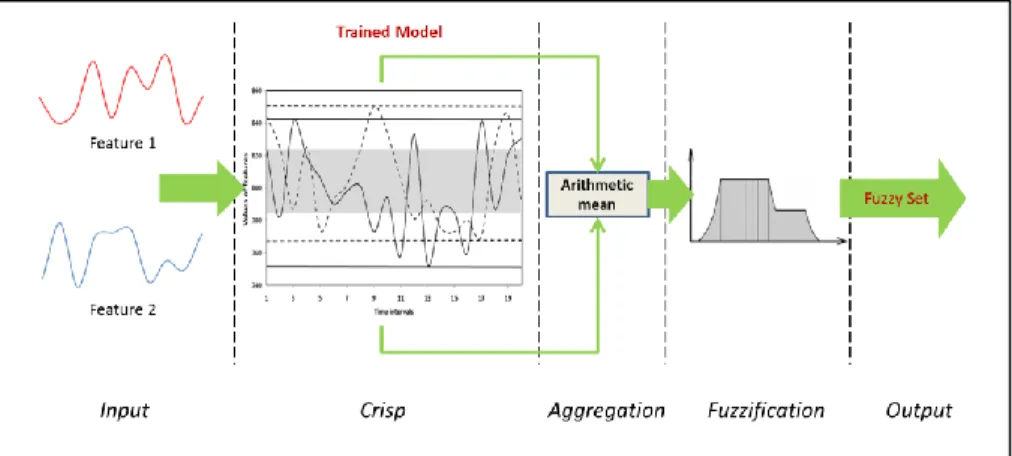
Figure 5. Classification phase of TiSEFE
3.3.3 Classification Phase
Figure 5 describes the classification phase as a fuzzy inference system. It involves five layers: input, fuzzification, aggrega-tion, defuzzificaaggrega-tion, and output. The first layer receives the input features. Each feature is a time series that represents a sequence of data elements measured over a time interval. The features received should match the features used in the training phase in terms of number of features and time intervals. The second layer, crisp layer calculates the rate of elements for each input feature that fall outside the SF in the trained model and passes the results as crisp values to the next layer. The number of crisp values passed equivalent to the number of input features. The aggregation layer combines the crisp values into one single representative crisp set by finding the mean. The fourth layer, fuzzification layer calculates the fuzzy membership degrees to which the input aggregated crisp value belongs to predefined fuzzy membership functions, e.g. attack and normal. The fifth layer outputs the final fuzzy set. The number of neurons in the first and the second layers depends on the number of input features while there is only one neuron in each of the third, fourth, and fifth layer. The membership function (MF) used in TiSEFE to represent crisp values is of Gaussian type. Figure 6 depicts an example of MF with 3 fuzzy sets. The curve represents the Gaussian MF (µ). This curve defines the transition from “Normal” to “Attack”. One of three fuzzy sets will be set as final output: “Normal” if µ < 0.3, “Suspicious” if µ between 0.3 and 0.6, and “Attack” if µ > 0.6.
Figure 6. Three fuzzy sets MF
4. TiSEFE Evaluation
This section describes the evaluation results. It starts with providing details on the prototype built to evaluate preprocess and analysis stages in Section 4.1. Section 4.2 describes the results of measuring packet loss in NTTSD construction. The dataset used to evaluate the classification stage is detailed in Section 4.3. Because of the fact that a network traffic classification system with a poor accuracy would be useless, the validation of accuracy is presented firstly, in Section 4.4, after which the impact of running the evolving phase on the classification accuracy is measured in Section 4.5. Finally, the TiSEFE is verified as multiclass classifier in Section 4.6.
4.1 Prototype
A prototype has been built to construct the NTTSD and to perform training and evolving phases using GNS3 and Oracle VM Virtual Machine simulation software packages. Five virtual machines of different OS, Win 2012 server, Win 7, and Ubuntu OS have been created. The network traffic capturing and analysis tasks are simulated using NetFlow simulator on Cisco Router C3600. Traffic information gathered by the router is sent to the NetFlow monitor to construct the NTTSD. Two features are selected from the records of NetFlow, number of traffic and total bytes, and the time interval to collect the features was fixed to 1 second. Upon finishing the process of NTTSD construction, the training part was applied to develop a model of normal network traffic. As the TiSEFE develops model of the normal network traffic, no anomaly NetFlow records have been deployed on the prototype.
4.2 Capturing Rate
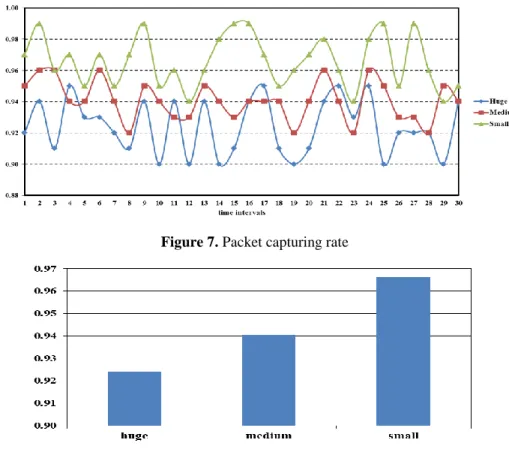
Figure 7 shows the results of calculating capturing rate for 3 different situations, huge amount of traffic (more than 106 packets per 0.5 minute), medium amount of traffic (less than 106 and more than 5×10⁵ packets per 0.5 minute), and small amount of traffic (less than 5×10⁵ packets per 0.5 minute). The results clearly show that the largest capturing rates are produced when the system deals with packets less than 5×10⁵ packets per 0.5 minute. The capturing rates produced convergent results in the situation of huge amount and medium amount, 6 out of 30 rates (20% overlapping) are overlapped between the two situations.
Comparatively, the results indicate that the system works less efficiently in the situation of huge and medium amount of traffic. The proportion of the capturing rates in 3 situations are calculated and depicted in Figure 8. By looking at the figure, two facts could be noticed. Firstly, there are no big differences in the proportions. Secondly, the packet loss increases when the network traffic increases because of the higher load caused by the huge amount of packets. However, the rate of packet
Project that is responsible for making long-term captures of both malware and normal data [24]. The dataset consists of 13 different malware captures done in a real network environment plus normal captures. The attack traffic comes from infected hosts and the normal traffic coms from uninfected hosts. The dataset samples are labeled in flow basis into malicious and normal. Details about the attack and normal records are shown in Table 1.
Table 1. Dataset Attack Records
Period 5/9/2013 15:40 CEST to 1/10/2013 13:38 CEST
Duration 26 days
Flows 10,845,500
Packets 48,187,308
Bytes 6,333,858,732
Infected Machines Two (Win 8 and Win 12)
Research Project CVUT University, Prague, Czech Republic
Figure 7. Packet capturing rate
4.4 Accuracy Experiment
The TiSEFE classification experiment conducted off-line using the NTTSD constructed. The dataset detailed in the previous section is utilized to verify the accuracy of the classification stage. Two features are adopted in the experiment which will be referred to as experiment#0: number of traffic and total bytes. Each feature is a time series that represents a sequence of data elements measured over 1 second time interval. Not all the dataset elements are used in experiment#0, random 300 seconds (5 minutes) of different classes (normal and attack) have been used only. The application of aggregating traffic is applied at each time interval (1 second) to extract the two features. The aggregated information is passed then to the classification stage to produce the output fuzzy set. Since the main focus of this experiment is the accuracy, the outputs are limited to two fuzzy sets only, “attack” and “normal”, i.e. “Normal” if µ < 0.5 and “Attack” if µ ≥ 0.5. Ultimately, the output of the system is registered along with targeted real class of the traffic.
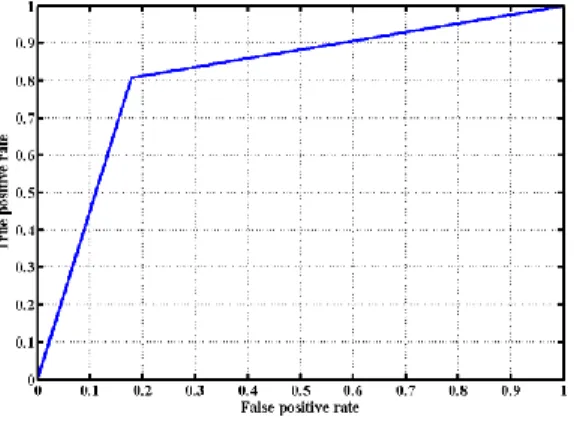
The accuracy is visualized by the Receiver Operating Characteristics (ROC) curves, which is a metric used to test the quality of classifiers. ROC curve is a plot of the False Positive Rate (FPR) against the True Positive Rate (TPR). The FPR is the ratio between the number of dataset elements incorrectly flagged as “attack” and the number of dataset elements labeled as “normal”, and the TPR is the ratio between the number of dataset elements correctly flagged as “attack” and the number of dataset elements labeled as “attack”. The FPR features on X axis and the TPR features on Y axis. This means that the top left corner of the plot is the “ideal” point, where the FPR equals to zero and the TPR equals to 1. The ROC curve is shown in Figure 9.
Figure 9. ROC for experiment #0
The figure indicates that the TiSEFE is an accurate classifier as the curve close to the left-hand border and the top border of the ROC space. Table 2 shows the confusion matrix to present the results numerically. The accuracy achieved is as high as 81%. The metrics showed in the confusion matrix are identified as follows [25]:
Accuracy: the proportion of the total number of classifi-cations that were correct.
Positive Predictive Value (Precision): the proportion of attack cases that were correctly identified.
Negative Predictive Value: the proportion of normal cases that were correctly identified.
Sensitivity (Recall): the proportion of actual attack cases which are correctly identified.
Specificity: the proportion of actual normal cases which are correctly identified.
Table 2. Confusion Matrix (n=300) for experiment #0 Classified
Attack Normal
A
ct
u
al Attack 143 34 Attack Predictive Value 0.80
Normal 22 101 Normal Predictive
Value 0.82
Sensitivity Specificity
Accuracy = 0.81
0.87 0.75
4.5 Impact of Evolving Phase
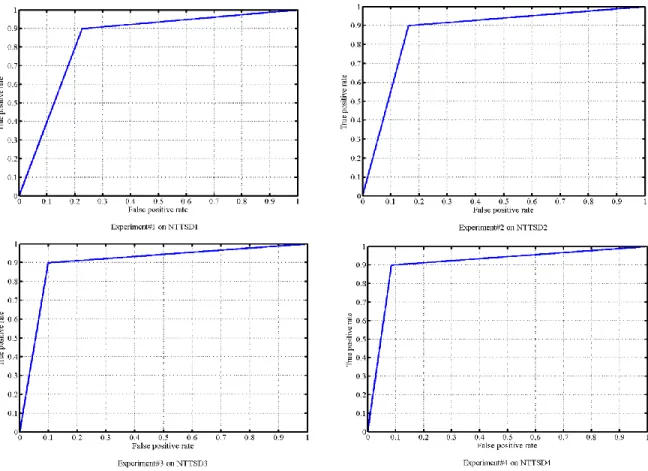
The experiments in this section are devoted to investigate impact of the evolving phase on the classification accuracy. The evolving phase is performed four times on the NTTSD that has been used in experiment #0. Each session of evolving phase produced an enhanced version of NTTSD that possesses an evolved knowledgebase. The new versions of NTTSD will be denoted in the forthcoming paragraphs as NTTSD1, NTTSD2... NTTSD4 while the original one will be denoted as NTTSD0. Four experiments were conducted separately using one evolved version of NTTSD. Figure 10 visualized the ROC curves of the experiments. The results obviously indicate that the evolving phase affects positively the classification accu-racy. By repeating of evolving session, the curve tends to be close to the “ideal” point at the top left angle of the ROC space. In order to quantify the performance of TiSEFE in each experiment, the area under curve (AUC) in the ROC space is calculated. The AUC represents numerically the accuracy of classifiers. The more the curve is lifted up toward the “ideal” point at the top left angle, the more AUC will be closer to 1. An AUC of 1 represents a perfect classifier and an AUC of 0.5 represents a worthless classifier. Table 3 shows the results of calculating AUC of ROC plots produced by all experiments along with the metrics of attacks and normal predictive values.
Table 3. Results of experiments in terms of predictive values and area under curve (AUC)
Experiment# Attack
Predictive Value
Normal
Predictive Value AUC
0 0.81 0.82 0.815
1 0.90 0.77 0.836
2 0.90 0.84 0.868
3 0.90 0.90 0.901
4 0.90 0.91 0.907
Figure 10. ROCs for four evolving sessions Two observations can be made from the table regarding the
performance of TiSEFE. First, the experiment#4 yields the optimum AUC, which means performing evolving phase affects the accuracy positively. This is because the evolving phase enriches the NTTSD and increases the classification knowledgebase. Second, evolving phase increases the normal predictive value significantly. This because the resulting evolved NTTSD is saturated by new samples, and provides the classification engine more power to discriminate accurately the normal traffic.
4.6 Three Fuzzy Sets Experiment
The last identified requirement for TiSEFE is that its ability to behave as multiclass classifier. To verify whether this requirement is fulfilled, an experiment has been conducted using the same training model built in the previous experiments. The goal is to classify randomly selected 300 samples of the dataset (detailed in Section 4.3). To establish ground truth for validation, manual labeling for samples is performed, “attack”: high intensity in number of packets (more than 106 packets); “suspicious”: medium intensity in number of packets (less than 106 and more than 5×10⁵ packets); “normal”: small intensity in number of packets (less than 5×10⁵ packets). Three fuzzy sets MF is used: “Normal” if µ < 0.3, “Suspicious” if µ between 0.3 and 0.6, and “Attack” if µ > 0.6. The accuracy is visualized in Figure 11. The AUC achieved is 0.889 which reflects good performance of TiSEFE with 3 fuzzy sets. For deep investigation, Table 4 shows the confusion matrix resulted. Despite the low attack predictive
value achieved, out of 81 attack samples only 1 attack has been incorrectly flagged as normal and most attack samples are flagged either attack or suspicious. Moreover, the suspicious predictive value is the highest predictive value; however, 25% of normal samples have been flagged as suspicious, and this rate needs to be considered.
Figure 11. ROC results of 3 fuzzy sets experiment
Table 4. Confusion matrix of 3 fuzzy sets experiment
Classified
Att Sus Nor
A
ct
u
a
l Att 54 26 1
Attack Predictive
Value 0.667
Sus 0 113 6 Suspicious
Predictive Value 0.950
Nor 0 25 75 Normal
5. Conclusion
The goal of this research paper is to investigate the use of time series and the fuzzy logic for online detecting anomalies in networks. The idea of this research is inspired by two attributes of nowadays network traffic: the big data and the uncertainty nature. The system presented, TiSEFE constructs NTTSD to model normal network traffic and spot anomaly behaviors in the real-time environment. Several experiments have been conducted to evaluate the classification system. The results showed that TiSEFE can classify network traffic into normal and attacks rapidly and effectively overcoming the detection delay incurred in traditional flow-based anomaly systems. Deployment of TiSEFE in virtual network has proved its applicability and successfulness. Evaluation of the system has shown that capturing rates as high as 92% in the situation of huge amount of traffic (more than 106 packets per 0.5 minute) can be achieved, which fulfills the task of capturing a sufficient amount of traffic for modeling the normal behavior of network. Another advantage for TiSEFE is the ability to work efficiently in the case of binary classification, i.e. normal and attack, as well as the case of multi classification, i.e. normal, suspicious, and attack. TiSEFE has shown 81% accuracy in binary classification and 80% accuracy in multi classification. Finally, the knowledgebase evolving feature has big positive impact on the classification accuracy. This shown that the system easily enhances the knowledgebase used in the classification phase.
References
[1] I. D. Irawati, A. B. Suksmono, and I. I. Y. M. Edward, "Missing Internet Traffic Reconstruction using Compressive Sampling," International Journal of Communication Networks and Information Security (IJCNIS), vol. 9, 2017.
[2] R. Hofstede, P. Čeleda, B. Trammell, I. Drago, R. Sadre, A. Sperotto, et al., "Flow monitoring explained: From packet capture to data analysis with netflow and ipfix," IEEE Communications Surveys & Tutorials, vol. 16, pp. 2037-2064, 2014.
[3] A. Bär, A. Finamore, P. Casas, L. Golab, and M. Mellia, "Large-scale network traffic monitoring with DBStream, a system for rolling big data analysis," in Big Data (Big Data), 2014 IEEE International Conference on, 2014, pp. 165-170. [4] S. Madden, "From databases to big data," IEEE Internet
Computing, vol. 16, pp. 4-6, 2012.
[5] A. Al-Fuqaha, M. Guizani, M. Mohammadi, M. Aledhari, and M. Ayyash, "Internet of things: A survey on enabling technologies, protocols, and applications," IEEE Communications Surveys & Tutorials, vol. 17, pp. 2347-2376, 2015.
[6] P. Casas, A. D'Alconzo, T. Zseby, and M. Mellia, "Big-DAMA: Big Data Analytics for Network Traffic Monitoring and Analysis," in LANCOMM@ SIGCOMM, 2016, pp. 1-3. [7] N. Brownlee, "Flow-based measurement: IPFIX development
and deployment," IEICE transactions on communications, vol. 94, pp. 2190-2198, 2011.
[8] B. Claise, B. Trammell, and P. Aitken, "Specification of the IP flow information export (IPFIX) protocol for the exchange of flow information," RFC 7011, 2013.
[9] W. John, S. Tafvelin, and T. Olovsson, "Passive internet measurement: Overview and guidelines based on experiences,"
Computer Communications, vol. 33, pp. 533-550, 2010. [10] J. Fan, F. Han, and H. Liu, "Challenges of big data analysis,"
National science review, vol. 1, pp. 293-314, 2014.
[11] C. Cranor, T. Johnson, O. Spataschek, and V. Shkapenyuk, "Gigascope: a stream database for network applications," in
Proceedings of the 2003 ACM SIGMOD international conference on Management of data, 2003, pp. 647-651. [12] D. J. Abadi, D. Carney, U. Çetintemel, M. Cherniack, C.
Convey, S. Lee, et al., "Aurora: a new model and architecture for data stream management," The VLDB Journal—The International Journal on Very Large Data Bases, vol. 12, pp. 120-139, 2003.
[13] E. Inc. (2017). Esper: Event Processing for Java. Available: http://www.espertech.com/products/esper.php
[14] I. StreamBase, "Streambase: Real-time, low latency data processing with a stream processing engine," ed, 2006. [15] A. Baer, P. Casas, A. D’Alconzo, P. Fiadino, L. Golab, M.
Mellia, et al., "DBStream: A holistic approach to large-scale network traffic monitoring and analysis," Computer Networks,
vol. 107, pp. 5-19, 2016.
[16] T. White, Hadoop: The definitive guide: " O'Reilly Media, Inc.", 2012.
[17] A. Thusoo, J. S. Sarma, N. Jain, Z. Shao, P. Chakka, S. Anthony, et al., "Hive: a warehousing solution over a map-reduce framework," Proceedings of the VLDB Endowment, vol. 2, pp. 1626-1629, 2009.
[18] T. Bujlow, T. Riaz, and J. M. Pedersen, "A method for classification of network traffic based on C5. 0 Machine Learning Algorithm," in Computing, Networking and Communications (ICNC), 2012 International Conference on, 2012, pp. 237-241.
[19] M. Abdel-Azim, H. E.-D. Salah, and M. Ibrahim, "Black Hole attack Detection using fuzzy based IDS," International Journal of Communication Networks and Information Security, vol. 9, p. 187, 2017.
[20] T. T. Nguyen and G. Armitage, "A survey of techniques for internet traffic classification using machine learning," IEEE Communications Surveys & Tutorials, vol. 10, pp. 56-76, 2008. [21] S. Yang and F. A. Kuipers, "Traffic uncertainty models in network planning," IEEE Communications Magazine, vol. 52, pp. 172-177, 2014.
[22] L. A. Zadeh, "Fuzzy sets as a basis for a theory of possibility,"
Fuzzy sets and systems, vol. 1, pp. 3-28, 1978.
[23] F. Schneider and J. Wallerich, "Performance evaluation of packet capturing systems for high-speed networks," in
Proceedings of the 2005 ACM conference on Emerging network experiment and technology, 2005, pp. 284-285. [24] S. Garcia, "Modelling the Network Behaviour of Malware To
Block Malicious Patterns. The Stratosphere Project: a Behavioural Ips," Virus Bulletin, number September, pp. 1-8, 2015.
[25] R. Hofstede, V. Bartos, A. Sperotto, and A. Pras, "Towards real-time intrusion detection for NetFlow and IPFIX," in