AbstractThe development of biofuel as an ecofriendly energy alternative has a value chain problem in alignment policies between related parties. Identifiying its alignment, we make a strategic mapping by building integrated base scorecard, so the strategic target in the subsequent perspec-tive layer can be developed more realistically. Structural Equation Modeling (SEM) modeling was used to examine horizontal connection validity to show strong relation between objectives strategy, and it will be measured of constructed component on the internal process by Technology Coefficient Contribution indexes.
KeywordsValue chain, structural equation modeling, BSC, technology coefficient contribution
I.INTRODUCTION
he development of biofuelas one of energy alternatives along with other renewable energy sources such as wind, sun, and water can be viewed as a strategic endeavor. More recently, this effort has taken place intensively worldwide not only in the developed countries with the largest energy consumption such as the United States of America and China, but also in the developing countries such as Brazil, India, and Indonesia. One of the renewable energy sources to be developed is agricultural product or commodity.
Each country has its own biofuel development characteristics defers from that of the other countries depend on the agricultural sources used. Renewable Fuels Association report on 2005 explain that USA and Brazil as the largest ethanol producers with their contribution about 35% each use corn and sugar cane respectively.
In the selection of agricultural commodities to be used as raw material for biofuel, all of the concerning countries face a common multi criteria problem in which they have to balance between the priority of using those commodities for food as well as for energy. Therefore, it is necessary to avoid any mistake in choosing a strategy since such a mistake can lead to another problematical situation, such as lack of food supply. For Indonesia and for most of Asian countries, the development of biofuel is in the first stage or first generation of development, in which biofuel will be obtained by utilizing sources currently used as food supply. As a result, there is a
11Sukardi is with Agroindustrial Technologi Department, FTP, Institut
Pertanian Bogor, 16680, Indonesia. E-mail: [email protected].
2Arman Hakim Nasution is with Department of Industrial
Engineering, FTI, Institut Teknologi Sepuluh Nopember, Surabaya, 60111, Indonesia. E-mail: [email protected].
need to formulate a mechanism for choosing an appro-priate strategy matched with food security program as well as in line with the development program for plant-based sources at the upstream level.
The objectives of this research are to:
1. Study the policy synchronization between institutions or departments involved in the development of national biofuel,
2. Mapping of biofuel development strategy using balanced score card (BSC) model approach,
3. Validate the relationship between parameters of strategic objective in the BSC model using structural equation modeling (SEM),
4. Measure the four elements of technological coef-ficient contribution (TCC) index,
5. Analyze the gaps between existing TCC in Indonesia compared to those of benchmarked countries,
6. Set the target of key performance index (KPI) in the development of biofuel strategy in Indonesia.
The main problem of bioenergy development in Indonesia lies on the way how to balance the use of the renewable energy sources, i.e. agricultural products, for food and for energy, e.g. biofuel. According to Asosiasi Produsen Biofuel (Aprobi) (2007) most of 22 biofuel producers in Indonesia with production capacity of 3.2 million tons annually use a variety of agricultural products-based sources, such as crude palm oil (CPO), corn, sugar cane, soybean, cassava, jatropha or castor, and arenga. Another problem is that the upstream activities at the Department of Agriculture that acts as a strategy control for supplying agricultural products unpa-rallel with the downstream activities for producing biofuel at the Department of Industry. In addition, the research results resulted from related institutions, such as the Ministry of Research and Technology, the Board for Technology Assessment and Application (BPPT) as well as Universities are as yet matched with the national bio-fuel development program.
Based on those perceptible above problems, Plant-based Fuel National Team (TNBBN) must formulate a planning strategy for biofuel development taking account strategic perspectives of related technical department, such as Department of Agriculture, Department of Industry, Mi-nistry of Research and Technology, and BPPT and the perspective of the Department of Finance as the authority for fiscal policies. In such situation, if the TNBBN will
Sukardi
1and Arman Hakim Nasution
21Integrated Model of Balanced Score Card and
Technology Component Measurement:
A Strategic Perspective in Indonesia Biofuel
Engineering Development
develop biofuel strategic planning using the balanced scorecard model, the strategic perspectives of the tech-nical department as well as those of non-techtech-nical depart-ment must be set as a perspective base of the TNBBN scorecard.
The perspective base of the TNBBN scorecard will consist of policy synchronization of four departments, namely the Department of Agriculture (DEPTAN), the Department of Mineral and Energy (ESDM), the Department of Industry (DEPPERIN), and the Ministry of Research and Technology (RISTEK). Each depart-ment will play its own role and responsibility. The DEPTAN will have a responsibility in the area of policy alternatives selection and the provider of plant-based biofuel raw material that has no conflict whether in terms of utilization for food or in terms of productive land use. The ESDM will take a responsibility in the area of licensing policy and incentive giving policy for the use of the renewable alternative energy. The DEPPERIN will take the role in the area of policy regulation for emission of factory machineries and automotives that comply with the use of biofuel.The RISTEK will take a role in the area of research of plant-based raw material productivity as well as their production machineries and facilities.
The relationship between strategic objectives in the BSC model generally is causal vertical relationship in which the achievement of the strategic objectives in the previous layers will determine the achievement of the strategic objectives in the subsequent layers. By building the integrated scorecard base, where the relationship between strategic objectives is set horizontally, it is expected that the achievement of the strategic objectives in the subsequent layer can be reached more realistically. Therefore, this research is aimed at developing an integrated BSC model as well as measuring the level of technology to establish strategical steps in developing biofuel in Indonesia.
II.LITERATURE REVIEW
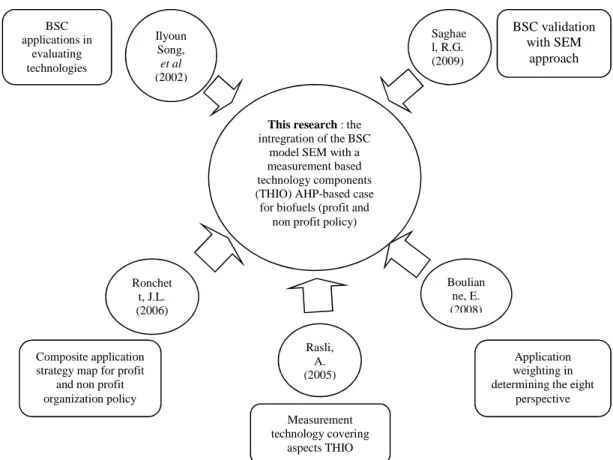
A. Inspiring Previous Works
There are five works of expert opinions that support this research Ilyoun Song, et al [2] shows how a BSC model can be applied to evaluate the implementation of technology for a commercial purpose. In evaluating a technology for such a purpose, they put an emphasis on the value of technology. In order to give a better evaluation of a possible successful of the implementation of technoloy transfer, it was suggested to evaluate not only the economical value of the technology, but also the feasible company’s production capacity or the company’s necessary condition in achieving the successful technology transfer criteria [2]. Therefore, this literature also shows how to test such a necessary condition for the success of the implementation of technology transfer by using BSC mapping. This literature provides benefit to this research in terms of idea of the possibility use of BSC model in technology evaluation.
Saghaei, R. G. shows that in building relationships between causal relation in the BSC mapping researchers normally start generating idea from their experience [5]. In order to develop more accurate causal relationships, this article shows how to measurethe level of interdepen-dence between strategy map of one perspective to the others vertically by using SEM. The article argues that
SEM was choosen for its powerful capabilities compared to another tools, such as regression model. By using SEM approach, it can be shown that researchers experience can be combined with comprehensive and scientific method to design the strategy map. Consequent-ly, the SEM approach is considered more appropriate compared to the experience approach. This article gives the idea to this research in the form of preliminary validation to the developed BSC model using SEM approach so that the obtained model will be valid and accurate.
Some outcomes that when several developed strategies had been carried out, some unique characters and organization mission direct organization toward achieving its mission. The BSC model provides inno-vation alternatives for non-profit organization that may be different when applied to the profit or private organi-zation. It was concluded that by using BSC, strategic planning complies with the unique commitment of the organization [4]. This article provides benefit to this research in distinguishing and combining strategy map of the policies of profit organization and non-profit organi-zation.
The test performance whether or not the performance measurements of the four perspectives of BSC outper-form the financial perspective alone. By using the four perspectives, the manager subjective judgment to each perspective weight needs to be determined to prevent its quality. The result shows that each perspective can maintain its quality by setting their weight equally, i.e. 25% [1]. Nevertheless, this article suggests for future research to replicate the research for a business unit of different business setting due to large sample and low response from respondents. This literature gives a benefit to this research in the idea of application of weighting procedure to determine the level of perspective and sub perspective importance in the strategy map of BSC. In this research the weighting will be carried out by using Multi Attributes Decision Making method, i.e. an analy-tical hierarchy process ( AHP).
Rasli, A. studies the seven conditions influencing knowledge transfer of information technology (IT) training based on analysis of expert opinions [3]. The seven conditions are management organization, trainees or recipient characteristics, IT facilities, trainer compe-tences, training methodology, systems organization, and work culture. The Pearson correlation of the seven para-meters of the conditions was determined by mapping the technoware, orgaware, humanware, and infoware from which the rank of descending correlation was set. Although each of the seven parameters has equal importance, it contributes impact to the IT competency. Therefore, the construction of the seven parameter in building competency must be viewed comprehensively in the integrated manner [3]. The article provides idea to this research in terms of a method for measuring technology which includes aspects of technoware, hu-manware, infoware, and orgaware. In this research the value creation of those aspects will be measured at each perspective learning and growth of the BSC model. B. Research Roadmap Based on Previous Works
described in the previous Fig 1. III.METHOD
This research follows the stages described in the following Fig. 2. Based on Fig 2, the present research follows the following stages:
1. Framework setting (preliminary scorecard model) was done based on literature review and field survey. The preliminary framework that has been set in the beginning of the research through proposal has been modified and validated using SEM.
2. Data collection was done with four data sources of four related departments including ESDM, DEPTAN, DEPKEU and RISTEK/BPPT/Industries to strengthen vision, mission, and strategic objectives. During data collection the preliminary model has also been verified to check its correctness.
3. Inter department policies comparisons was done to ensure the harmony of the policies of each department in the national biofuel development program.
4. Initial KPI formulation and SEM validation was done through formulation of KPI candidates in order to obtain feasible KPIs so as to ensure the success of biofuel development program. The formulated and selected KPIs subsequently were validated by using SEM to get the optimal KPI for biofuel development. 5. TCC measurement was done involving four
techno-logy components which include technoware, human-ware, inforhuman-ware, and orgaware to determine value creation.
6. The TCC outputs are the input for gap analysis in which TCC outputs were compared to those of selected benchmark or the state of the art.
7. Consequently, the overall above research stages are expected to conclude the optimal KPI for biofuel development program in Indonesia.
IV.MODEL DESIGN AND ANALYSIS
A. Inspiring Previous Works
In the methodology section it has been described the preliminary model for intended scorecard, called the framework. Based on this framework, the process for re-setting and validating for perspective base scorecard as well as subsequent perspectives have been done. The validity test for perspectives of base scorecard has been done based on the results from focus group discussion of stakeholders, while the other next perspectives have been tested for their model validity and respective KPI by using SEM.
The resulted preliminary base scorecard model consists of three department policy clusters, namely DEPTAN policies, ESDM policies, and RISTEK/BPPT/ Industries policies. In the updated model, the base scorecard model was modified resulting four policy clusters with the order starting from ESDM, DEPTAN, DEPKEU to RISTEK-/BPPT/Industries.
The ESDM policies were set at the first layer of the base scorecard since these policies are the main driven for other strategic or blueprint policies of the other layer of the national energy, including biofuel, development as mentioned in the President Decree No. 5/2006 Chapter 4. Biofuel development policies of the department of ESDM
must be supported by biofuel raw material supply program set by the DEPTAN. The strategic policies of biofuel supported by the policies of DEPTAN must then be supported also by industrial incentive policies of DEPKEU whetherfor biofuel manufacturing process or for supplying biofuel raw material as well as the incentive support in the form of rule and regulation and budgetting policies for the Ministry of RISTEK/BPPT and DEPPERIN. By using the above mentioned logic, the base scorecard model for the development of biofuel in terms of value chain can be established with the order of policies of ESDM, DEPTAN, DEPKEU and RIS-TEK/BPPT/Industries as shown in Fig. 3.
B. Comparison of Inter Departement Biofuel Deve-lopment Policies
Eventhough Instruction of President in Inpres 1/2006 stated the spirit on harmony or synchronization, in the implementation at the department level there are found some government rules and programs that are dishar-mony or discord with the spirit of this instruction. This disharmony, of course, will deviate the achievement of the designated objectives such as that of stated in the President Decree in Perpres 5/2006 Chapter 2 with the detailed objectives found in the blueprint of National Energy Management of year 2006 to 2025.
In the following are four categories of disharmony found in the government rules and programs at the level of inter department implementation:
1. Disharmony between DEPTAN and DEPKEU in the incentive for supplying raw material for biofuel energy.
2. Disharmony amongs DEPPERINDAG, RISTEK/ BPPT, and DEPKEU in the incentive for engineering equipment.
3. Disharmony amongs the department of ESDM, RIS-TEK/BPPT, and DEPKEU in the incentive for mixing composition target of biofuel use in industrial and transportation sectors.
4. Disharmony between the department of ESDM and DEPKEU in the incentive for biofuel selling price. Disharmony between the department of ESDM and DEPKEU in the incentive for procuring the imported biofuel.
C. Initial KPI Formulation and Its Validation Using SEM
SEM method was used in this research as an integrated approach of factor analysis, structural model, and path analysis.
SEM method makes it possible to conduct activities concurrently, i.e. validity equation and reliability instru-ment (equal to confirmatory analysis), modeltesting in relation to relationships between latent variables (equal to path analysis), and obtain a model useful for estimation (equal to structured model).
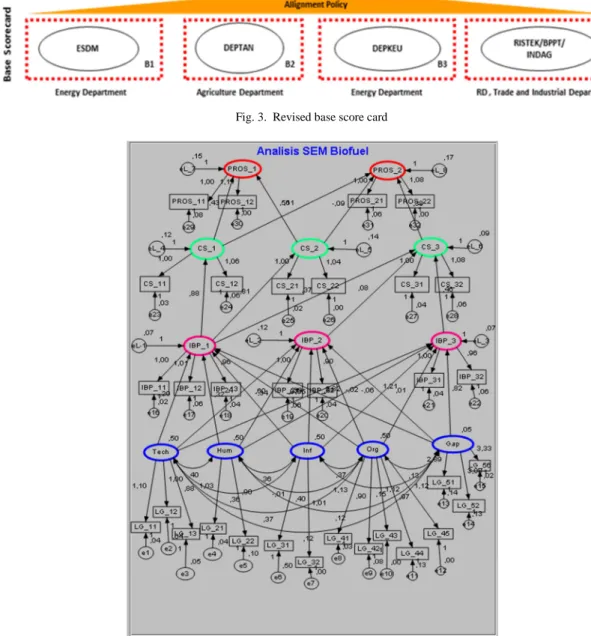
In this research, SEM model was developed by utilizing AMOS™ software version 16. Strategic objective [SO] in the developed model is latent variable (unmeasured) and so must be explained by indicator variable (measured) to result an expalined variable called initial KPI or KPI candidate. In the following are recapitulations of initial KPI at each perspective:
1. SO Sustainable Revenue APBN : 2 initial KPIs 2. SO International Emission Incentive : 2 initial KPIs 3. SO Increase Cost Efficiency of Fuel Consumption : 2
initial KPIs
4. SO Decrease of Air Pollution : 2 initial KPIs
5. SO Increase Contribution on World Air Clean : 2 initial KPI
6. SO Increase Productivity Resources : 3 initial KPIs 7. SO Operating and Process Excellences : 2 initial
KPIs
8. SO Increase Renewable Energy Competitiveness : 2 initial KPIs
9. SO Increase Technology Infrastructure : 3 initial KPIs
10.SO Increase Human Resources Quality : 2 initial KPIs
11.SO Information Readiness and Socialization : 2 initial KPIs
12.SO Integrated Organization : 5 initial KPIs
13.SO Gap Analysis on Value Creation : 3 initial KPIs In SEM model, latent variable is represented by an elliptical shape while indicator variable is represented by a rectangle. The SEM model resulted from AMOS™ software is depicted in Fig. 4.
The terms of standardized regression weights describes a direct influence magnitude of inter latent variables relationships. Based on standardized regression weights some significant latent variables directly influenced the prospectives are identified as follows:
1. Increase technology infrastructure [LG_1] directly influences the operating and process excellences [IBP_2] at the weight of 0.23
2. Increase human resources quality [LG_2] directly influences the increase productivity resources [IBP_1] at the weight of 0.321.
3. Increase human resources quality [LG_2] directly in-fluences theoperating and process excellences [IBP_2] at the weight of 0.508.
4. Increase technology infrastructure [LG_1] directly influences theincrease renewable energy competitiveness [IBP_3] at the weight of 0.383. 5. Increase human resources quality [LG_2] directly
influences the increase renewable energy compe-titiveness [IBP_3] at the weight of 0.405.
6. Information readiness and socialization [LG_3] directly influences the increase productivity resources [IBP_1] at the weight of 0.342.
7. Gap analysis on value creation [LG_5] directly influences the increase productivity resources [IBP_1] at the weight of 0.732.
8. Increase technology infrastructure [LG_1] directly influences the increase productivity resources [IBP_1] at the weight of 0.201.
9. Increase productivity resources [IBP_1] directly influences the increase cost efficiency of fuel consumption [CS_1] at the weight of 0.875.
10.Increase productivity resources [IBP_1] directly in-fluences the decrease of air pollution [CS_2] at the weight of 0.838.
11.Increase productivity resources [IBP_1] directly influences the increase contribution on world air clean [CS_3] at the weight of 0.377.
12.Increase renewable energy competitiveness [IBP_3] directly influences the increase contribution on world air clean [CS_3] at the weight of 0.475.
13.Increase cost efficiency of fuel consumption [CS_1] directly influences the sustainable revenue of APBN [PROS_1] at the weight of 0.422.
14.Increase cost efficiency of fuel consumption [CS_1] directly influences the international emission incentive [PROS_2] at the weight of 0.592.
15.Decrease of air pollution [CS_2] directly influences the sustainable revenue of APBN [PROS_1] at the weight of 0.487.
16.Increase contribution on world air clean [CS_3] directly influences the international emission incen-tive [PROS_2] at the weight of 0.357.
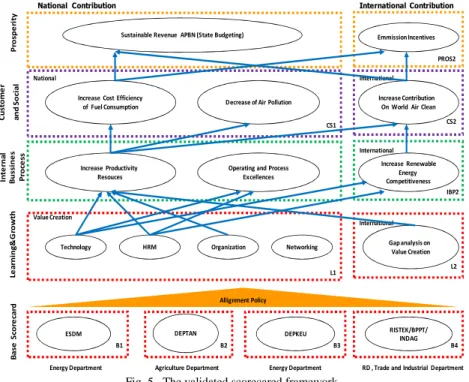
The analysis on the SEM model of AMOS output result in a valid strategic objectives relationships. The validity is determined based upon the regression weight between latent variables having value less than 0.05 or in other words their influence is significant. The relation-ships and significant influences between latent variables on each perspective is depicted in Fig. 5. From Fig. 5 it can be seen that not all latent variables or strategic objectives have strong relationship and influence. D. The Measurement of TCC
The measurement of technology contribution coef-ficient (TCC) as a technometric measure is intended to measure an aggregate contribution of the four technology components found in the process of input transformation into output. As described in the previous section that in this research the technology is classified into four components, namely:
1. Object: Object is an embodied technology termed as technoware (T) that consists of technical tools which includes production equipment: machine and equipment, vehicles, factory, physical infrastructure, and other assets used by human to operate the transformation process.
2. Person: Person is an embodied technology termed as humanware (H) that consists of human abilities which includes knowledge, skill, policy, creativity, achievement, and individual or collective experience in utilizing available natural resources and techno-logy.
cedure, technique, method, theory, design, obser-vation, manual, and other facts disseminated through publication, document, and blue print.
4. Institution: Institution is an embodied technology termed as orgaware (O) or organizational framework which includes organization tools, institution, and rule and regulation required to pool all of the technical tools, human ability, document fact, and organizational framework in order to facilitate the management run and relationships to achieve organization productivity.
In order to measure the TCC, these four technology components play an important role as a guideline. To achieve the state of the art (SOA), this research uses Thailand as a reference since it possesses some superiori-ties compared to that of Indonesia in developing biofuel program. In addition, Thailand has its proximity to Indonesia in terms of geographic characteristics for biofuel. These superiorities will be benchmarked and possibly adopted for the development of biofuel program in Indonesia.
Each of these four technology components must be assigned its contribution intensity. The following dia-gram shows the assignment of technology components intensity:
Based on the above calculation it was found that the most contributing technology component value to the TCC is humanware with contribution value of 0.53. This contribution can be regarded as good although its intensity, βh, only at the value of 0.2. The second most contributing component is infoware with contributing value of 0.5 even though its intensity, βi, only 0.2. Whereas the other two technology components, i.e. technoware and orgaware, their contribution value to TCC are only 0.475 and 0.404 although their intensity values are high, namely 0.25 and 0.35 respec-tively. Consequently, the overall TCC value of Indonesia also low or only at the value of 0.464. Due to this situation, it is expected that the technology component with high contribution value it also possesses high degree of intensity and so it is able to give a good final value of TCC.
The result of TCC measurement discussed in this section shows that the most intense technology component is orgaware, i.e. 0.35. However, its sophistication rating to the TCC is considered low. This phenomenon indicates that technology component orgaware needs special attention in order to improve the final value of TCC.
The quadratic function of intensity value will determine most the quality of TCC value whether it will turn good or bad. Therefore, it is logical that to improve the final value of TCC is to improve the sophistication rating of technology components. The following are some of the critical improvements that can be done: 1. To formulate a clear mechanism in providing an
incentive and tax of energy to the biofuel producers and consumers.
2. To maintain a community development sustainability in developing the utilization of renewable energy. 3. To formulate the specification and target of biofuel
consumption.
4. To harmonize the agreeable biofuel pricing policies and tax allowance between stakeholders for synergy.
E. Formulation of Final KPI
In this section, the final KPI from the validated initial KPI or KPI candidate will be determined. The method to determine the final KPI is based on the estimate value in the standardized regression weights. In this case, if the estimate value is greater than 0.5, then it decided that the KPI is valid and become the final KPI. The estimate value for each KPI is presented in Table 1.using SEM.
From Table 1 it can be seen that there are 31 KPIs out of 32 KPIs having estimate value greater than 0.5. There is only one KPI having value of -0,006, i.e. LG_31, meaning that this KPI is not valid for the final KPI. Table 2 recapitulates all of the final KPIs that are valid or feasible to be considered as an indicator for the success of biofuel development program in Indonesia.
V.CONCLUSION AND RECOMMENDATION
Based on the results of the initial model validity as well as technology component measurement of strategic model of biofuel development in Indonesia, some conclusions are inferred as follows:
1. To the perspective of base scorecard needs to be added the role of DEPKEU as a policy authority on fiscal incentive to support all activities related to the national biofuel development program in the upstream level as well as downstream.
2. The sequence of horizontal relation perspective of value chain of basescorecardis the policy of ESDM, DEPTAN, DEPKEU, and RISTEK/BPPT/INDAG. The department of ESDM takes the first order in the first value chain followed by the policy of DEPTAN since the ESDM policy triggers the harmony of the other department policies, especially the policy of DEPTAN and DEPKEU.
3. Not all of the determined relationships at each strategic objective (latent variable) in the initial framework are valid. This situation is indicated by the sophistication rating that less than 0.05.
4. Overall, the technology coeficient contribution (TCC) of Indonesia is considered low, i.e. only 0.464. The country of reference used in this research is Thailand since in biofuel development program it has some superiority over Indonesia. In addition, the choice of Thailand was based on some advantages: geographic proximity, some common characteristics of biofuel raw materials. Therefore, the superiority of Thailand can be benchmarked for Indonesia’s biofuel program. From the results of comparison it can be concluded that the improvement of the degree of sophistication of each technology component must become the priority in order to improve the biofuel development as well as to optimize the use of poten-tial raw materials.
5. The gap analysis of the existing technology coef-ficient contribution versus benchmarking country was done through the assessment of Indonesia’s biofuel program achieved performances compared to those of Thailand at all level of the technology coefficient contribution components.
REFERENCES
[1] E. Boulianne, 2008, “Benefits of the balanced scorecard and how performance evaluation is affected by dimensions weighting”, Annual Accounting Information Systems Research
Symposium, Montreal, Canada.
[2] Ilyoun Song, et al, 2002, “An application of the balanced score card model for evaluation of technology for commercialization”,
Korea Technology Transfer Journal.
[3] A. Rasli, 2005, “IT competencies and the conditions for training effectiveness: a study on malaysian university clerical workers”,
Ph.D. Thesis, Denmark.
[4] J. L. Ronchetti, 2006,“An integrated balanced scorecard strategic planning model for nonprofit organizations”, Journal of
Practical Consulting.
[5] R. G. Saghaei, 2009, “Using structural equation modeling in causal relationship design for balanced-scorecards strategic map”, Proceeding of World Academy of Science Engineering
and Technology, Vol. 37.
[6] K. Tarek, 2004, “New directions on technology”, Elsevier
science. Washington DC.
TABLE 1.
STANDARDIZED REGRESSION WEIGHT FOR THE FINAL KPI
Fig. 1. Schematic research roadmap of the research under study
Fig. 2. Research methodology Literatur Study
Preparation of the framework (initial models scorecard)
Revitalization of the vision, mission and Strategic objective
Comparative inter- departmental policy
KPI formulation Initiation & validation
SEM
TCC measurement
Gap analysis with bencmark Design sofware
Data collection : ESDM, DEPTAN, DEPKEU and
RISTEK/BPPT/industry
Preparation of final KPI
Designing a BSC Model
Measurement technology components BSC
applications in evaluating technologies
Composite application strategy map for profit
and non profit organization policy
BSC validation with SEM
approach
Application weighting in determining the eight
perspective
This research : the
intregration of the BSC model SEM with a measurement based technology components (THIO) AHP-based case
for biofuels (profit and non profit policy)
Measurement technology covering
aspects THIO Ilyoun
Song,
et al
(2002)
Rasli, A. (2005) Ronchet
t, J.L. (2006)
Fig. 3. Revised base score card
Fig. 5. The validated scorecared framework
B1
ESDM RISTEK/BPPT/
INDAG
Energy Department Energy Department RD , Trade and Industrial Department DEPKEU
Technology HRM Gap analysis on
Value Creation Organization
L1 Networking
International Value Creation
Le
a
rn
in
g
&
G
row
th
Increase Productivity Resouces
Operating and Process Excellences
Increase Renewable Energy Competitiveness International
In
te
rn
a
l
B
u
ss
in
e
s
P
roc
e
ss
Increase Cost Efficiency of Fuel Consumption
Increase Contribution On World Air Clean Decrease of Air Pollution
International
C
u
st
om
e
r
a
n
d
S
oc
ia
l National
CS1
Emmission Incentives Sustainable Revenue APBN (State Budgeting)
International Contribution
P
ros
p
e
ri
ty
National Contribution
B2 B4
B
a
se
S
cor
e
ca
rd Allignment Policy
L2 IBP2 CS2 PROS2
B3 DEPTAN