Computational Visualization for Critical
Thinking
Catherine Griffiths
Media Arts + Practice, School of Cinematic Arts, University of Southern California, Los Angeles, USA ---
ABSTRACT
This paper looks at several historical precedents for how computational systems and ideas have been visualized, both as a means of access to and engagement with a broader audience, and to develop a more tangible language to address abstraction. Such precedents share a subversive ground in using a visual language to provoke ways of engaging with complex ideas. The author proposes two approaches to visualizing algorithmic systems for the emerging context of algorithmic ethics in society, looking at prototypical algorithms in computer vision and machine learning systems, to think through the meaning created by algorithmic structure and process. The aim is to use visual design to provoke different kinds of thinking and criticality to address algorithms in their increasingly more politicized role today. The two proposed approaches are developed from an arts research perspective to support critical thinking and arts knowledge through creative coding and interactive design.
KEYWORDS
Visualization; Computation; Precedent Studies; Ethics; Critical Technologies; Machine Learning; Computer Vision; Surveillance.
1 | INTRODUCTION
Today computational systems have become significantly more abstract, complex, opaque, powerful, pervasive, influential, and opportunistic. They are no longer simply tools to make things faster, or easier, or more efficient. They are becoming part of the fabric of our social and political lives, autonomously bypassing governance and political debate, as the traditional forums of decision-making and social change. Humans are becoming increasingly incapable of comprehending computation in its speed, scale, and structure, and consequently, to engage with it and make choices about how we want to live with it. Visualization can be a method of making computation more human, less abstract and opaque. We need to graphically show structure, animate temporality, diagram scale, and
metaphorize context. We need to develop visual tools that incite new ways to think about algorithms as socio-political drivers. There are historical precedents for visualizing computation that are relevant to our contemporary algorithmic era, in the way that they specifically challenge perspectives on knowledge and engagement. These precedents will be explored, before presenting two different approaches.
2 | COMPUTATION AS TACIT POWER AND AESTHETIC ANALOGY
machinery that ubiquitously affects our day-to-day lives” (Thorp, 2017). Computational visualization seeks to understand how the algorithm executes and why it produces the results it does, whether this is a conventional sorting algorithm, or a machine learning algorithm with significant social and political implications. In this way, it is possible to access and visualize the processes that underlie the computational systems that increasingly drive key functions in our society.
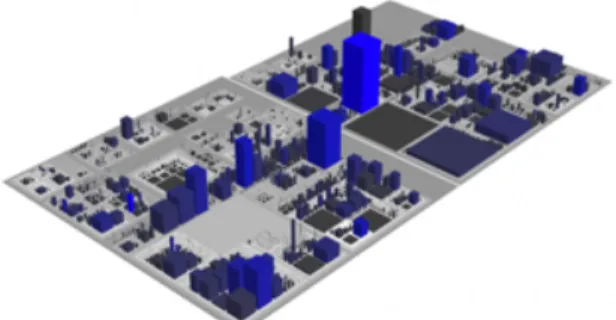
The use of aesthetics and analogy are explored as opportunities to bring the history of art to bear on computation. Paul Fishwick points out that artists have long been inspired by the advancements of science, however, the acknowledgement has not been reciprocal. When science looks to art, it tends to do so in a reductive, formal way, focusing solely on classical notions of beauty. For example, when referring to the elegance of a mathematical solution, “the mathematician’s aesthetics involves concepts such as invariance, symmetry, parsimony, proportion, and harmony,” (Fishwick, 2006, p.9) denying the full array of thinking in art. Computation has so far failed to take into account the evolution and innovations in aesthetics from the Enlightenment to the present. Art history’s movements and genres, including experiments in subversion, multi-perspectivism, reflexivity, pluralism, and subjectivity, make clear that aesthetics are not just a tool to further facilitate the sciences, but capable of bringing insights of their own. Science has traditionally enforced visual minimalism in the name of abstraction, but as Fishwick argues “representation need not compromise the goal of abstraction” (Fishwick, 2006 p.255). He offers an example of how a finite state machine can be visualized in 3D using a city nightscape as a metaphor in which streetlight illuminated walkways and human agents represent state changes. Fishwick argues for catalyzing art, using analogy to strengthen the feeling of immersion, relatability, and envisioning. Analogy is a mode that Barbara Maria Stafford, likewise, discusses as an opportunity to bind the computational new mind with the combinatorial old mind. She offers analogy as “a nonalgorithmic technique for binding our perceptual system to our cognitive system, expressed in terms of similarities and antitheses” (Stafford, 1999, p.176). Richard Wettel explores such ideas in his doctoral dissertation titled Software Systems as Cities, in which he uses a metaphor of urbanism to “allow the interpretation of new data representations by analogy.” (Wettel, 2010, p.iii) He developed a tool called CodeCity to think through algorithmic structure as analogous to the structure of a city, such a metaphoric tactic can shift between visualizing an algorithm and reverse engineering the metaphor back into code.
Figure 1 | CodeCity by Richard Wettel
Packages are represented as neighborhoods, classes as buildings, and architectural program, such as skyscraper, residential house, or parking lot, is mapped to width, length, and height of buildings, over which communication relations are charted. Wettel refers to the inhabitable quality of the visual metaphor as being essential to the method.
3 | HISTORICAL PRECEDENTS FOR VISUALIZING COMPUTATION AS OBJECTS-TO-THINK-WITH
The implementation of turtle graphics into the Logo programming language is an entry point to thinking about how visualization has fostered access, comprehension, and exploration of advanced ideas in mathematics, computation, and decentralized thinking, for people who do not have a training in science. Such ideas are often abstract, counter-intuitive, and difficult to comprehend, especially in times of increasing computational obscurantism. The visual tactic behind the turtle graphic, offered an embodied approach to dealing with abstraction, supported a model of learning through design and exploration rather than based off existing knowledge, and connected these visual computational learning models to social and political changes in the world at the time, in the hope of developing different ways of thinking.
means for children to learn “a language for talking about shapes and fluxes of shapes, about velocities and rates of change, about processes and procedures. They are learning to speak mathematics and acquiring a new image of themselves as mathematicians” (Papert, 1993, p.3). Papert sought to overcome the cultural unease around engaging with mathematics. He saw this disengagement as stemming from lack of access, social esteem, and a cultural atmosphere. “It is about an end to the culture that makes science and technology alien to the vast majority of people. Many cultural barriers impede children from making scientific knowledge their own. (...) Many children who grow up in cities are surrounded by the artifacts of science but have good reason to see them as belonging to “the others” (…) Most branches of the most sophisticated modern culture of Europe and the United States are so deeply “mathophobic” that many privileged children are as effectively (if more gently) kept from appropriating science as their own.” (Papert, 1993, p.4)
To overcome this, Papert projects an empowering vision of how when a child programs a computer, they are given access to and intimacy with some of the most powerful ideas in technology and the deepest ideas in science and mathematics. Papert understood that computers can support the development of new ways of thinking and learning, and should not be seen to simply instruct and deliver information, but to revitalize education, so that children learn through exploration, experimentation, and expressing themselves. Influenced by the psychologist and child development pioneer, Jean Piaget, Papert followed the model of childhood learning in which children are “builders of their own intellectual structures” (Papert, 1993, p.7), which led to the concept of the turtle as “a constructed computational object-to-think-with” (Papert, 1993, p.11), emanating from his own experience of playing with toys gears as a child and how the sense of embodiment supported his engagement with abstract concepts.
Figure 2 | Drawing shapes by navigating a turtle in Logo
Harold Abelson and Andrea diSessa advanced Papert’s work beyond childhood learning, to consider how the practice of turtle graphics could support the exploration of advanced geometry at the undergraduate level. In their book Turtle Geometry, they claim that it is rare for a student to have the chance to approach mathematics by doing it rather than only learning about it through the rote revision of proofs and theorems. In this sense, turtle geometry, as the approach became known, is about giving students an experiential access and agency to advanced mathematical concepts “to dissolve the barriers to the production of knowledge” (1981, p.xiii). Turtle geometry offers an alternative framework for learning about mathematics, in contrast to the traditional framework of coordinate geometry conceived by René Descartes in the 17th century.
“Descartes’ marriage of algebra and geometry is one of the fundamental insights in the development of mathematics. Nevertheless, these kinds of coordinate systems — Cartesian, polar, or what have you — are not the only ways to relate numbers to geometry. (…) We shall refer to the geometry of FORWARD and RIGHT as turtle geometry.” (Abelson and DiSessa, 1981, p.11)
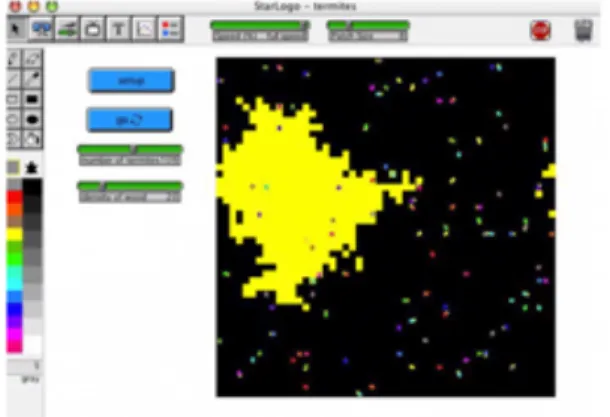
In the 1980s, Mitchel Resnick, a student of Papert at MIT, extended the turtle concept into another visual programming environment with a more overt claim to challenge social thinking. StarLogo, was a programming language developed to explore how decentralized thinking and intuition could be developed through computational literacy. In Turtles, Termites, and Traffic Jams, Resnick describes his motivation within the seeming paradox of complex systems: “How can a mind emerge from a collection of mindless parts? It seems clear that no one part is ‘in charge’ of the mind (or else it too would be a mind). But how can a mind function so effectively and creatively without anyone (or anything) in charge?” (Resnick, 1995, p.xiv). Resnick designed StarLogo to provide an environment in which to simulate decentralized systems, learn about their behaviors, and complexity-from-simplicity scenarios. Resnick saw this in contrast to the centralized models and top-down hierarchies that dominated society’s way of thinking and learning, and which was just starting to change. Papert celebrated StarLogo as “liberating students from the confines of the centralized mindset” (Papert, 1994, p.x) by rethinking the computer as not just a technology for speeding things up and getting things done, but to aide a different type of thinking.
In StarLogo, the user visually simulates decentralized phenomena, such as ant colonies, slime molds, traffic jams, and forest fires, by programming a large volume of agents, or turtles, with very simple rules of movement. Such systems are non-intuitive to the human mind, which struggles to keep track of a large number of independent actors, which is where the role of visual computation becomes important. Where in Logo, a user navigates a single turtle, in StarLogo, a user deploys thousands of turtles simultaneously, that perform as autonomous agents, directed by simple rules, to simulate emergent phenomena out of a seemingly disordered environment. The user creates ‘microworlds’ of complex systems, through programming very simple rules. For Resnick the best way to learn about something as counterintuitive as a decentralized system, is to design one. Resnick also sought to provide access visually to other challenging and obfuscated ideas within computer science.
“During the past decade, many ideas have influenced the design of computer programming languages. But two ideas stand out as especially influential: object-oriented programming and parallelism. StarLogo incorporates aspects of both.” (Resnick, 1995, p.41)
Object-oriented programming and parallel computing were new concepts being developed by computer science at the time, and Resnick’s system offered users a way into their unfamiliar logic. In StarLogo both the environment and the agents have equal agency, as the environment is a grid comprised of discrete cells which can engage with each other and other objects. This transformation of the traditional role of objects and people in the environment aims to change people’s thinking and interactions about the environment. Computationally, StarLogo is comprised of an agent system operating on a cellular-automata-structured environment, and each individual agent in the system and cell in the grid has an equal ability to activate and communicate with each other.
Figure 3 | A termite simulation in StarLogo
StarLogo arose out of a social and political context in which ideas around decentralization were developing, not only in computation, but also in society and politics. Resnick situates his ideas during the time of the dissolution of the USSR, corporations restructuring their business into smaller semi-autonomous businesses away from top-down hierarchies, and countries transitioning to more horizontal free market economies rather than centralized state-controlled economies. In science and computing, the Newtonian world view was also being displaced by the decentralized view of ecosystems. He also points to other key moments in history that anticipated the rise of decentralization, including the publication of Adam Smith’s The Wealth of Nations in 1776 that first presented an economic model without the need for centralized control, and in 1859, the publication of Charles Darwin’s On the Origin of Species, brought decentralized thinking to biology and natural selection.
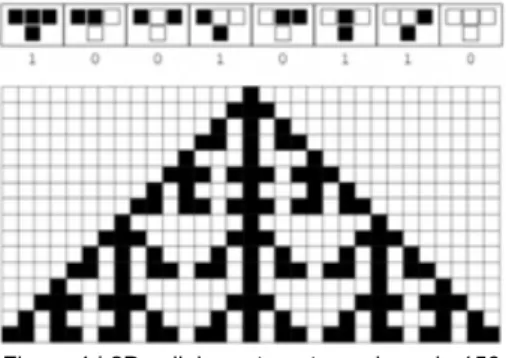
that computation can be embodied in visual form. In A New Kind of Science, he argues that in order to understand complex ideas, it is not necessary to use complex mathematical systems, but instead simple rules (Wolfram, 2002). From simple simulations such as John Conway’s Game of Life, and Chris Langton’s Langton’s ant, we can understand that algorithms can occupy a physical space.
Figure 4 | 2D cellular automaton using rule 150
What would otherwise be a mathematical abstraction, here is a literal representation of behavior, where geometry and logic generate the computation. The simulations that have been developed from more sophisticated versions of these visual algorithms have led to the simulation of human behavior or the growth of cities. Like cellular automata, other algorithms become meaningful when understood through their visual representation. In the case of Aristid Lindenmayer’s L-systems, a formal grammar which visually articulates a recursive function over geometry, has a revealing effect as the shapes that grow out of these generative procedures resemble forms in nature (Lindenmayer, 1990). Since their formulation, L-systems have been developed to simulate physical processes from bacterial cell growth, to tree growth and crystal growth. This algorithm has brought a more diverse audience to understand multi-scalar computational processes, popularizing concepts such as fractals. Without this visual computation, it would be very difficult to understand the concept of recursion, such as with the Koch Curve. Like L-systems, another type of computational grammar are shape grammars. Invented by George Stiny and James Gips in the 1970s, shape grammars combine shapes and transformation rules to create patterns and subdivide space, leading to their use as a design tool. Gips writes that “Shape grammars are intended to form a basis for purely visual computation. The primitives in shape grammars are shapes, rather than symbolic” (Gips, 1999). Shape grammars are a visual way of writing the rules of an algorithm. They capture a computational process graphically, of shapes being added and subtracted in accordance with spatial relation. When writing an algorithm, one is designing a shape and its transformation rules.
Also known as ‘computing with shapes’, a shape grammar is a language generator, albeit one that works with a visual alphabet. approaches. 4 | CELLULAR AUTOMATA, SURVEILLANCE, AND CREATIVE CODE
I would like to present two approaches from my own research into visualizing computation in the current context of the ethics in algorithms discourse. The first method presents an approach to reverse engineer a social issue, in this case surveillance, back through a particular algorithm, or core computational concept, in this case a cellular automaton. There is a line, conceptually and visually, to be drawn between the core computational logic of cellular automata, via image processing techniques, through computer vision algorithms, and into the gaze of a street surveillance camera. The approach seeks to make this argument visually, through a series of simulations. Contextually, this research begins by looking at open source algorithms and libraries and thinking through the social and political implications of them, addressing algorithms, not just as cultural artifacts, but at the level of code syntax. Connecting to the practice of critical code studies, the work uses the OpenCV library, and considers its source code as being a cultural text with the same potential for humanistic interpretation as other cultural texts.
There is an affinity between cellular automata and images through the computational grid system of cellular automata and the pixel array structure of digital images. A cellular automaton is a system of simple rules and states, operating on grids of cells, and from such seeming simplicity, complex behaviors emerge, leading to further-reaching possibilities. State is usually represented by black and white colored cells, which are often interpreted as alive and dead, whilst a typical rule set might be: if a live cell has less than two live neighbors, then it dies (interpreted as isolation); if a live cell has more than three live neighbors, then it dies (interpreted as overcrowding); if a dead cell has three live neighbors, then it comes alive (interpreted as reproduction); otherwise a cell stays the same (interpreted as stasis). From such a seemingly simple computational system, far-reaching speculations have been developed in relation to artificial life (Langton, 1986) and the computational universe (Fredkin 1990).
each river’s different water density, speed, and temperature, their waters do not mix for several kilometers and instead run alongside each other inside the same river channel, demarcated by their different colors. Several hundred Langton’s ants were deployed across the structure of the image, using its data structure to compute across, generatively repatterning it, and transforming the landscape and the composition of the river. The choice of image works analogously, where one’s understanding of the landscape is terraformed by the agents. This visualization is presented in two formats, one which foregrounds the algorithm’s interpretation of the scene, as a simplified four-state grayscale image that the agents use to compute on to determine their state and change pathway. Another image foregrounds the human view, as the effects of the generative redesign of the landscape. The work is presented in this way to think through the difference between the simplified data and logic that the algorithm operates with, and the higher-level image that we see, and which might hold cultural or social meaning.
Figure 5 | Langton’s ant
Figure 6 | four-state grayscale image that agents compute on
Figure 7 | Full color or human view shows generative redesign of landscape
Continuing this mode of visual-critical argument to connect the logic of cellular automata computations to our social understanding of surveillance, the research engaged with image processing techniques, which are an important part of a computer vision library of algorithms. Images need to be heavily processed, broken down and simplified to be interpretable by an algorithm. Popular filters such as blur, sharpen, and edge detection are used and operate with similar logic to a cellular automaton. When background subtraction is applied to an image from a surveillance camera, the image is reduced in complexity to just two states and two rules, if a pixel’s RGB value changes between video frames it is assigned white, and if it remains the same between frames it is assigned black. In this way, an algorithm reads motion in a video image, and the result is a rather sinister image of the surveillance camera’s gaze, tracking people walking in urban space. The research works with a creative coding approach to create a series of visualizations of the algorithm in action, first of all isolating motion in the image, and then printing only that motion. The work uses the image of a chameleon, because of the nature of the animal to conceal itself through stillness. By analogy, the chameleon reveals itself to the algorithm through movement and camouflages itself from the algorithm through stillness.
This arts research seeks to move forward from the tradition of data visualization, to experiment with ways of visualizing computational process or models, to open the black-box of algorithms that are used in socially contentious spaces and think through their inner workings by means of visual-critical arguments. From a computer science perspective, cellular automata systems are understood as expressions of foundational computational concepts including state machines and formal logic, they are also understood as neutral mathematical concepts, however, from an arts research perspective, the very foundations of computation and code can be questioned and contextualized within a social context.
Figure 9 | Isolating and visualizing motion or state changes
Figure 10 | Printing motion or state changes
5 | MACHINE LEARNING, ETHICS, AND INTERACTION DESIGN
A second approach to building visual-critical arguments to address the ethics of algorithms has also been explored. Machine learning algorithms were investigated because of their emerging use in ethically sensitive spaces such as policing and welfare. The incidents of algorithms arriving at racist or sexist classifications or being used to determine who goes to prison and who receives leniency, have received important attention over the last few years. The ethical dilemmas that are arising from the use of machine learning algorithms include the likelihood of them generating mistakes and of augmenting biases hidden in data. The investigative journalism organization, ProPublica, investigated machine bias in the US justice system in 2016, pointing to how predictive systems can encode racial bias when used in criminal sentencing, and it was from there that this research began (Angwin, 2016). The algorithms being used are proprietary, classic black boxes, and are therefore unavailable to scrutiny, however when algorithms are tasked with making potentially life-altering decisions such as recommending a person be jailed, or fired from a job, or refused a place in a state-funded drug rehabilitation program, it becomes a significant ethical problem.
From an interdisciplinary design research perspective, a framework to critically study algorithms needs to provide access to algorithms for observation, to promote literacy, enable reflection, and formulate a critical and ethical
position in the discourse. An interactive visualization tool was developed to visualize a simple machine learning algorithm, a decision tree classifier, to think through some of these ideas and pose further questions. Classifiers were generated using Python’s scikit-learn library and then rebuilt in Unity, a game engine, to drive an interactive visualization in real-time. In its current state, the application works mainly with synthetic data, as a way to temporarily isolate the meaning in data, to think about the meaning of structure and process in the algorithm instead. From a design perspective, a combination of tactics from interaction design, generative design, and to some extent critical code studies, have been employed. A decision tree classifier was used because it is one of the simplest types of machine learning that is already somewhat graphic.
Figure 11 | Software interface for Visualizing Algorithms, an application to visualize, simulate, and interact with a simple
machine learning classifier.
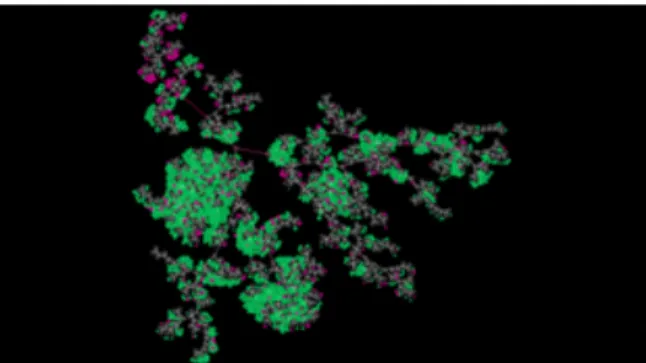
Figure 12 | The algorithm mapped out spatially showing all possible pathways. Gravity and spring physics simulate an
organic aesthetic.
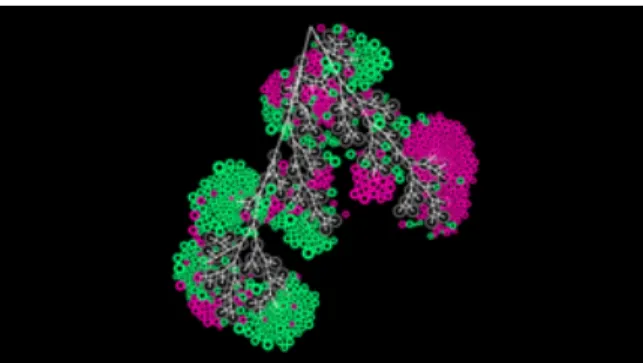
Figure 13 | Visualizations of a decision tree, a simple machine learning generated classifier with four prediction
Figure 14 | Tree structure of the algorithm showing two prediction classes and mistakes in classification.
The design tactics employed begin by mapping out the algorithm spatially, to look at its possibility space, at all of the various paths through the algorithm, and decisions that are made before arriving at a prediction. Then data is simulated through the algorithm, showing decisions being made in real time as the algorithm executes. The simulation of time is a tactic taken from some computer games, in which time can be scaled to see individual decisions being made at a slower, human scale of perception, through to a higher, emergent scale in which patterns of decisions can be seen forming. At this point, the visualization can point to mistakes in prediction, where the algorithm mis-classifies data. A user can also hover over each data point and reverse engineer the path it took through the algorithm, perhaps to see at which point it made a wrong decision and took a wrong path. The system also visualizes particular features of the data, through the physical proportions between the data points. The most popular and least popular pathways through the algorithm’s network are also visualized. The prototype was built procedurally so that any classifier of the same type can be loaded and visualized, with the user interface supporting its structural self-organization, and aiding analysis.
In developing an interactive design tool such as this, the questions that come up include: to what extent visualization is an a-linguistic tool to re-engage with decision-making in prediction systems and provoke questions, where we are at risk of losing our connection to decision-making? Could visual tools be used by key workers in the field, who are expected to work with the results of these algorithms but so far are precluded for understanding their logic? To what extent interaction design, generative design, and critical code studies combine as an effective method to visualize an ethical position in algorithms? What does it mean to learn, in machine learning, and is the anthropomorphism of AI a productive analogy? The tool uses synthetic data, therefore artificially removing the social meaning from the data temporarily. As the research develops, the intention is to explore the concept of bias
augmentation, which speculates that where there is a small bias in a dataset, this can become amplified through the iterative algorithmic process. Where most people today argue that bias is in the data, because the data is a reflection of bias in society, there is also speculation that the algorithm in its structure and process, can play its own role to augment bias. That is something to explore further, hence the focus on structure and process over data so far.
6 | CONCLUSION
This research looks back at historical precedents for how computational systems and ideas have been visualized as a means of access and engagement with a broader audience or to develop a more tangible language to address abstraction. The examples described, including the influential legacy of turtle graphics, leading to StarLogo’s visual programming environment, which sought to explore decentralized thinking, and Wolfram’s in depth study of cellular automata, share a drive to provoke new kinds of thinking, criticality, and imagining that can also offer opportunities to address algorithms in their increasingly more politicized role today. Two research projects propose methods to address contemporary algorithms in a socio-political context, ultimately proposing to move toward a perspective that positions algorithms as part of a political language. In the creative coding community, emerging from software studies, we are told that code is now a comprehensive language for creative and authorial expression. Can code also be a language of critique to probe its own social and political latencies?
REFERENCES
Abelson, H., & diSessa, A. A. (1981). Turtle Geometry: The computer as a medium for exploring mathematics, Cambridge, Massachusetts: MIT Press
Aneesh, A. (2006). Virtual Migration: The programming of globalization, Durham: Duke University Press
Angwin, J. Larson, Jeff., Mattu, Surya., & Kirchner, Lauren. (2016). Machine Bias. ProPublica, May 23, 2016. Retrieved from https://www.propublica.org/article/machine-
bias-risk-assessments-in-criminal-sentencing
Fishwick, P, A. (2006). Aesthetic Computing, Cambridge, Massachusetts: MIT Press Fredkin, E. (1990) Digital Mechanics: An
information process based on reversible universal cellular automata, Physica D, 45(1-3), 245-270.
https://doi.org/10.1016/0167-2789(90)90186-S Gips, J. (1999). Computer Implementation of
on Shape Computation, Cambridge, Massachusetts
Langton, C. G. (1986). Studying artificial life with cellular automata. Physica D, 22(1-3) 120-149. https://doi.org/10.1016/0167-2789(86)90237-X
Lindenmayer, A., & Prusinkiewicz, P. (1990). The Algorithmic Beauty of Plants, New York: Springer Verlag
Papert, S. (1993). Mindstorms: Children, computers and powerful ideas (2nd ed.), New
York: Basic Books
Papert, S. (1994). Foreword. Mitchel Resnick, Turtles, Termites and Traffic Jams: Explorations in massively parallel microworlds (p.x). Cambridge, Massachusetts: MIT Press
Resnick, M. (1994). Turtles, Termites and Traffic Jams: Explorations in massively parallel microworlds, Cambridge, Massachusetts: MIT Press
Stafford, B. M. (1999). Visual Analogy: Consciousness as the art of connecting, Cambridge, Massachusetts: MIT Press Thorp, J. (2017). You Say Data, I Say System.
Hacker Noon. July 13, 2017. Retrieved from https://hackernoon.com/you-say-data-i-say-system-54e84aa7a421
Wettle, R. (2010). Software Systems as Cities (Doctoral dissertation). University of Lugano, Switzerland
Wolfram, S. (2002). A New Kind of Science, Wolfram Media, Inc.
BIOGRAPHICAL INFORMATION