MOLECULAR MECHANISMS REGULATING CHROMOSOME SIZE SCALING DURING C. ELEGANS EARLY EMBRYONIC DEVELOPMENT
Anne-Marie Ladouceur
A thesis submitted to the faculty at the University of North Carolina at Chapel Hill in partial fulfillment of the requirements
for the degree of Doctor of Philosophy in the Biology Department.
Chapel Hill 2016
© 2016
ABSTRACT
Anne-Marie Ladouceur: Molecular mechanisms regulating chromosome size scaling during C. elegans early embryonic development
(Under the supervision of Paul S. Maddox)
During embryonic development in metazoans, cells decrease in volume by up to two orders of magnitude, a consequence of multiple rounds of cell divisions without growth of the embryo. Using C. elegans and X. laevis embryo as model, it has been shown that mitotic structures all scale with cell size, smaller cells have smaller organelles (reviewed in 1
). Due to technical limitations, scaling of mitotic chromosome has received less attention. It is
condensation or segregation. To identify new regulators of chromatin compaction, we depleted known chromatin modifying enzymes and identify genes that increased embryonic lethality in the fusion strain compared to a WT strain. This strategy allowed us to identify both CENP-A and Topoisomerase II as crucial chromosome size regulators during C. elegans early embryonic development.
Thus we are using large-scale RNAi depletion and high resolution imaging to determine the mechanisms of mitotic chromosome size regulation. Mitotic chromosome assembly and the process of scaling organelles to cell size are often seen as cellular
ACKNOWLEDGEMENTS
The years spent in grad school is an extraordinary journey filled with memories, good and bad (!, but mostly good), memories of the friends we made, the inspiring people we met and of course the exciting scientific discoveries. I will forever cherish those moments and it is only possible because I’ve always been surrounded with great people who made my life in lab enjoyable and others who supported me outside lab.
First I would like to thank my supervisor Paul Maddox who really gave me the
opportunity to find back the love I had for science. All my success and achievements are also yours and only possible because you did believe in me from day one. I will always be
grateful you giving me all those opportunities to truly excel. Thank you.
The Maddox lab wouldn’t be that successful if it wasn’t also for Amy. Thank you both of you for sharing your life with us. You really made us feel part of a family when ours was miles away.
Carlos and Vince, we all made the big jump and moved from Montreal. This time spent in Chapel Hill would not have been the same without you friends.
PREFACE
The second chapter of this thesis was published in the Journal of Cell Biology (JCB) in June 2015 with Dr Jonas Dorn as a second author. Dr Dorn helped with all the statistical analysis.
The third chapter is currently under revision at JCB. This chapter includes work from a former co-worker, Dr Rajesh Ranjan who performed the work presented in Fig 3.2. Dr Ranjan is the co-first author on the second article submitted to JCB. Lydia Smtih from the Maddox lab helped me doing the RNAi screen presented in Fig 3.1. Jennifer Heppert from the Goldstein lab help generate the TOP-2::sfGFP CRISPR worm strain. Tanner Fadero from the Maddox lab performed the microscopy and the data analysis of the TOP-2::sfGFP
CRISPR worm strain fluorescent intensities during development.
TABLE OF CONTENT
LIST OF TABLES ... xii
LIST OF FIGURES ... xiii
LIST OF ABBREVIATIONS AND SYMBOLS ... xv
Chapter 1. INTRODUCTION ... 1
1.1. Chromosome condensation ... 1
1.1.1. Chromatin structure ... 1
1.1.1.1. The chromatin fiber and the nucleosome based model for chromosome organization (or hierarchical helical folding) ... 1
1.1.1.2. The scaffold base model for chromosome organization (or the radial loop model) ... 3
1.1.1.3. Alternative or new models of mitotic chromosome structure ... 7
1.1.2. Major drivers for mitotic chromosome assembly ... 11
1.1.2.1. Condensin complexes ... 11
1.1.2.2. Topoisomerase II ... 14
1.1.2.3. An interplay between TopoII and Condensin ... 15
1.1.2.4. Centromere-protein A (CENP-A) ... 18
1.1.2.5. Histone modifications ... 21
1.2. Cell size scaling ... 23
1.2.1. Model organisms to study cell size scaling ... 24
1.2.1.1. C. elegans as a model organism ... 24
1.2.1.2. Cell and nuclear size scaling by Conklin ... 26
1.2.4. Assembly/disassembly rate ... 29
1.2.5. Molecular gradients ... 29
1.3. Chromosome size scaling ... 30
Chapter 2. MITOTIC CHROMOSOME LENGTH SCALES IN RESPONSE TO BOTH CELL AND NUCLEAR SIZE ... 32
2.1. Introduction ... 32
2.2. Results and discussion ... 34
2.2.1. Chromosome length regulation during the first 4 divisions of C. elegans embryos ... 34
2.2.1. In early embryos chromosomes shorten in response to decreasing cell size ... 37
2.2.2. Cell size and nuclear size independently regulate chromosome length scaling ... 39
2.2.3. RCC1 RNAi embryos exhibit a global increased compaction prior to mitosis ... 42
2.2.4. The RAN-‐GTP gradient contributes to nuclear and chromosome size ... 44
2.2.5. A chromosome length-‐scaling model ... 45
2.3. Supplemental material ... 48
2.4. Material and methods ... 50
Chapter 3. CENP-‐A AND TOPOISOMERASE-‐II ANTAGONISTICALLY REGULATE CHROMOSOME LENGTH IN HOLOCENTRIC ORGANISMS ... 55
3.1. Introduction ... 55
3.2. Results and discussion ... 57
3.2.1. A targeted, reverse genetic screen for proteins required to segregate an abnormally long chromosome ... 57
length in opposing manners ... 60
3.2.3. Endogenous CENP-‐A and TOP-‐2 localize linearly on mitotic holocentric chromosomes. ... 61
3.2.4. TOP-‐2 and CENP-‐A form physically distinct axes ... 63
3.2.5. Titration of CENP-‐A, but not TOP-‐2, via nuclear trafficking is required for chromosome size scaling during embryonic development ... 64
3.2.6. CENP-‐A acts as a ruler for chromosome length ... 66
3.2.1. Centromere domain size, rather than number, defines C. elegans mitotic chromosome length ... 68
3.3. Supplemental material ... 73
3.4. Tables ... 76
3.5. Material and methods ... 78
Chapter 4. NUCLEI AND CELL SIZE CONTROL ... 84
4.1. Introduction ... 84
4.2. Results and discussion ... 85
4.2.1. Scaling across animals and within closely related species ... 85
Chapter 5. DISCUSSION ... 93
APPENDIX 1: THE CONDENSIN COMPLEX IN C. ELEGANS ... 107
APPENDIX 2: CENP-A INCORPORATION OUTSIDE CENTROMERE IN YEAST CELLS...108
LIST OF TABLES
Table 2.1 One-way ANOVA comparing developmental stage for each RNAi condition or all RNAi conditions
at each developmental
stage...35 Table 2.2. t-Test statistical significance of chromosome length
differences comparing all developmental stages for each RNAi
condition...36 Table 2.3. Correlation between cell size, nuclei size and
chromosome length in Control, IMA-3, RCC1
and NTF-2 depleted embryos...38 Table 2.4. Time spent in prophase in Control and RCC1 depleted embryos...43 Table 2.5. Statistical differences of chromosomes length variance at
all different stages between Control and RCC1 depleted embryos. ...44 Table 3.1. Mean chromosome length measurements at the one-cell stage...76 Table 3.2. Average chromatin CENP-A fluorescence intensity
LIST OF FIGURES
Figure 1.1. Classical models for mitotic chromosome assembly...3
Figure 1.2. The chromosome scaffold as seen by Laemmli and colleagues...6
Figure 1.3. Megabase to gene scale chromatin organization...10
Figure 1.4. Linear and axial compaction model for mitotic chromosomes...11
Figure 1.5. The Condensin complexes...12
Figure 1.6. Topoisomerase II and Condensin’s biochemical activity on chromatin...18
Figure 1.7. Mitotic chromosome organization in C. elegans...21
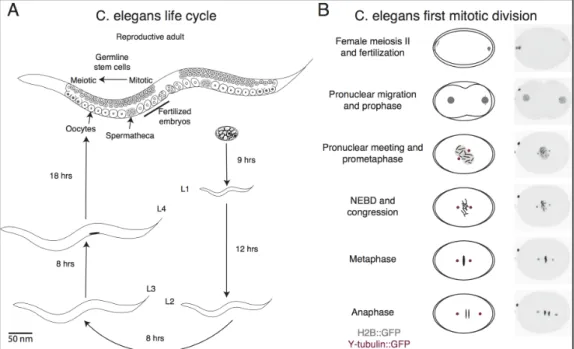
Figure 1.8. C. elegans’s life cycle and first mitotic division...25
Figure 1.9. Cell size and nuclear size by Edwin G. Conklin (1912)...27
Figure 2.1 Chromosome length scales to cell size during early C. elegans embryogenesis...34
Figure 2.2. Chromosome length scales to cell size not developmental program...39
Figure 2.3. When uncoupling nuclear to cell size, chromosome length scales to nuclei size...41
Figure 2.4. Ran pathway members regulate chromosome and nuclear size through limited nuclear import...47
Figure 2.5. Embryonic phentotype following depletion of C. elegans importin proteins...48
Figure 2.6. Chromosome length analysis in diploid vs tetraploid worms...49
Figure 2.7. Chromosome condensation dynamic during development...50
Figure 3.1. RNAi screen of C. elegans nucleome identifies chromosomal architecture protein as regulator of chromosome size...59 Figure 3.2. Endogenous TOP-2 localizes linearly on
Figure 3.3. Chromatin associated CENP-A level decreases
during development and is regulated by nuclear import...66 Figure 3.4. Decoupling the amount of CENP-A incorporated
per chromosome unit length modifies the chromosome
length ruler and extra CENP-A is incorporated in existing CENP-A
domains rather then spreading between domains...70 Figure 3.5. Genomic organization of strains used in the study
and generation of a TOP-2 primary antibody...73 Figure 3.6. Characterization of cenp-a/cpar-1, knl-2 and
top-2 RNAi on C. elegans single cell embryos...74 Figure 3.7. Super-resolution microscopy on chromatin spreads
performed on living C. elegans single-cell embryos...75 Figure 4.1. Nuclei and DNA density scaling to
cell size across 4 different animal species...87 Figure 4.2. Genome size and cell size is decoupled in the
nematode species Pellioditis typica...90 Figure 4.3. Nuclei size scaling in a worm strain closely related to C. elegans...91 Figure 5.1. Predictions for chromosome condensation
regulation through cell cycle or development...97 Figure 5.2. The limiting component model for chromosome
size regulation during early embryonic development...98 Figure 5.3. Chromosome size scaling during development...100 Figure 5.4. Chromosome size scaling defects in monocentric
and holocentric chromosome...101 Figure Supp 1. The condensin complexes depletion phenotypes in C. elegan...107 Figure Supp 2. CENP-A overexpression and overincorporation
does not modify chromatin physical properties as
LIST OF ABBREVIATIONS AND SYMBOLS
°C Celsius degree
3-C Chromosome-Conformation-Capture
3D 3 Dimensions
4C Circularized-Chromosome-Conformation-Capture
4D 4 Dimensions
5C Carbon-Copy- Chromosome-Conformation-Capture ANOVA ANalysis Of VAriance
ATP Adenosine TriPhosphate B.s Bacillus subtillis
BSA Bovine Serum Albumin C. plana Crepidula plana Carb Carbenicilin
CENP-A CENtromere Protein A
ChIP-chip ChromatinImmunoPrecipitation on chip ChIP-Seq ChromatinImmunoPrecipitation Sequencing
CRISPR Clustered Regularly Interspaced Short Palindromic Repeats DAPI 4',6-diamidino-2-phénylindole
DIC Differential Interference Contrast DNA DeoxyriboNucleic Acid
FRAP Fluorescence Recovery After Photobleaching FWHM Full Width Half Max
G1 cell cycle Gap phase 1 G2 cell cycle Gap phase 2 GAP GTPase activating Protein GDP Guanosine DiPhosphate
GEF Guanine nucleotide-Exchange Factor GFP Green Fluorescent Protein
GSC Germline Stem Cells GTP Guanosine TriPhosphate
H3K9me2 Histone H3 lysine9 dimethylation H4K16 Histone H4 Lysine 16
H4K20me1 Histone H4 lysine 20 methylation
Hi-C HIgh-throughput-Chromosome-Conformation-Capture
Hrs Hours
IMA 1-3 IMportin subunit Alpha 1-3
IPTG Isopropyl β-D-1-thiogalactopyranoside
IRIC Institute for Research in immunology and Cancerology
Kb kilo bases kb
MAPs microtubule associated proteins Mbp Mega base pair
Mbp/μm3
mg/ml milligram per milliliter ml milliliters
NA Numerical Apperture
NEBD Nuclear Envelop BreakDown NGM Nematode Growth Medium
nm nanometer
Ntf-2, Nuclear Transport Factor 2 O/N Over Night
OD600 Optical Density at wavelength 600
P P value
P. typica Pellioditis typica PBS Phosphate Buffer Saline
PBST Phosphate Buffer Saline Tween PCR Polymerase Chain Reaction PIE-1 Pharynx and Intestine in Excess 1 PMT PhotoMultiplier Tube
Ran RAs-related Nuclear protein
RCC1 Regulator of Chromosome Condensation RNAi RiboNucleic Acid Interference
RT Room Temperature
S-phase cell cycle replication phase SAXS Small Angle X-ray Scattering
SIM Structured Illumination Microscopy siRNA small interfering RiboNucleic Acid SMC Structural Maintenance of Chromosome TAD Topologically Associated Domains Top-2 Topoisomerase 2
TopoII Topoisomerase II
WT Wild Type
X. laevis Xenopus laevis
µg/ml micrograms per milliliter
μm micron
μm2
Chapter 1. INTRODUCTION
1.1. Chromosome condensation
1.1.1. Chromatin structure
1.1.1.1.The chromatin fiber and the nucleosome based model for chromosome organization (or
hierarchical helical folding)
In order to package DNA into the confine of the cell’s nucleus, chromatin must compact several fold. It is thought that such compaction occurs over several levels of organization. The first one is the wrapping of DNA around an octameric arrangement of 4 histones (2xH2B-H2A dimer, 1xH3-H4 tetramer). This level of organization is probably the most described and understood as high-resolution crystal structures are available 2. Canonical nucleosomes wrap 147 base pair (bp) around the histone core and nucleosomes are spaced by linker DNA (20-100 bp) where the 5th
histone (H1) can bind, forming a chromatin fiber (first model described by 3
). The linear array of nucleosomes visualized by electron microscopy appears as beads-on-a-string, thus constituting an 11 nanometer (nm) chromatin fiber 4 (Figure 1.1). Past the 11 nm fiber, the exact folding of the chromatin remains controversial. Multiple evidences of the 11 nm fiber folding into a 30 nm fiber have been describe using different techniques and samples. The 30 nm fiber was first observed by Finch and Klug in the mid 70’s in chromatin extracted from mammalian cells and imaged by electron
microscopy (EM) 5
. They were also the first ones to propose the solenoidal folding of the 11 nm fiber where the linker DNA’s bending arranges nucleosomes in a helical organization. This arrangement was also described for mitotic chromosomes by EM 6
bend but is rather straight and neighboring nucleosomes do not stack on-top of each other but are arranged in a ribbon 7
. However, the very existence of this 30 nm fiber chromatin organization is debated, as cryo-EM and SAXS (Small Angle X-ray Scattering) analysis revealed that the periodic structure provided by a 30 nm fiber might be in fact an artifact from ribosome aggregate contamination rather than organized nucleosomes 8,9
. Early evidence from EM experiments suggested that the 30 nm fiber next follows a hierarchical helical folding. This model proposes the chromatin fiber progressively folds from a 30 nm fiber to a 100, 200 or 300 nm fiber 10-12
(Figure 1.1 A). However, evidence for the
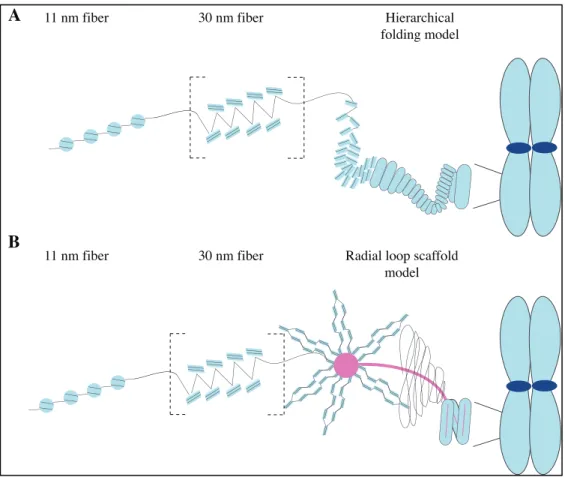
Figure 1.1 Classical models for mitotic chromosome assembly. In both models, the nucleosomes wrap 1.7 turns of DNA and assemble to form the 11 nm fiber, also known as beads-on-a-string. Although highly debated, some studies suggest the 11 nm fibers subsequently folds into a 30 nm fiber. A) The hierarchical model stipulates the 30 nm folds into successive higher-order structures of 100 to 700 nm fibers. B) The radial loop scaffold model is based on the presence of a scaffold (protein and/or DNA) on which loops are anchored and radially emerge. Adapted from 13
.
1.1.1.2. The scaffold base model for chromosome organization (or the radial loop model)
The first experiments addressing the physical and structural basis of the higher-order structure of mitotic chromosomes past the nucleosome fiber were performed in the late 70’s, early 80’s by Laemmli and colleagues. Those discoveries are still at the heart of our more recent model for mitotic chromosome assembly, although with some modifications. Still today, the major problem scientists are facing when studying chromatin structure inside the chromosomes is the lack of tools allowing the visualization past the chromatin fiber. Even
11 nm fiber 30 nm fiber Hierarchical
folding model
A
Radial loop scaffold model
11 nm fiber 30 nm fiber
the nucleosome fiber as the chromosomes are seen as a mesh of interconnected chromatin fibers. At the time when Laemmli and colleagues performed their experiments, information on histone-DNA interactions was growing fast and the concept that non-histone proteins might, as well, play a role in chromosome assembly was emerging. They reasoned the
higher-order structure of the mitotic chromosome would reside in the interaction provided by the non-histone proteins. To overcome the technical difficulty of chromosome visualization, they developed a biochemical method based on their hypothesis that non-histone proteins may play a major role in chromosome assembly. They used their knowledge of histone-DNA interactions to develop a buffer which would deplete histones from isolated metaphase HeLa cells chromosomes without affecting the non-histone proteins14
. This preparation allowed for spreading of mitotic chromosomes followed by visualization by electron microscopy. They observed a dark, central axis surrounded by a halo of DNA. A close-up revealed that the axis, since then termed the scaffold, has a very similar shape to an intact chromosome and is reminiscent of the 2 sister chromatids attached at their centromere (Figure 1.2 A). Emanating from the central scaffold are loops of DNA varying in size on a small scale from 10-30 μm (30-90 kb) (Figure 1.2 A). To uncover the scaffold proteins identity and prove their role in the structural maintenance of the chromosomes, they sought to isolate and visualize the protein scaffold. To do so, they used the same technique as described previously but isolated chromosomes were then treated by DNAseI 15,16
. In those conditions, they observed the chromosomes retain key features like residual kinetochores and the axial element
(resembling the sister chromatids). Overall, this experiment suggests the sister chromatids are protected from digestion by the scaffold proteins and thus maintain the chromosomal
structure is given by a non-histone protein axis which serves as a scaffold from where the DNA organizes into radial, closed loops of sizes varying from 50-100 kb 17
(Figure 1.1 B).
Those experiments did prove that somehow each sister chromatid retained its shape through molecular interactions at its heart. However, the exact nature of those molecular interactions cannot be easily determined by the previous set of experiments. Although the authors strongly suggest the scaffold to be protein-fiber like, alternate hypotheses can be proposed. One such hypothesis is the scaffold at the base of the loops is not protein fiber-like but rather is made by DNA crosslinking itself. Micromechanical treatments of fully
condensed chromosomes have been useful in understanding the physical properties of mitotic chromosomes. Marko and colleagues used micromanipulation and aspiration of isolated chromosomes to assess their elastic response providing information on their physical properties18
. Briefly, isolated chromosomes are held together by 2 micropipettes one of which is calibrated. The other micropipette is moved and the force needed to bend the calibrated micropipette is estimated by observing the micropipette’s bending. Treatments of the elongated chromosome with micrococcal nuclease reduced the force supported by the chromosome to nearly zero without however modifying the gross chromosome morphology. Over a longer period of time, chromosomes thin out into fiber and finally dissolve. This experiment suggests the mitotic chromosome is held through a chromatin network rather than a continuous protein-fiber like scaffold. Furthermore, treatments with restriction enzymes with different cut frequency showed that DNA links are made every ≈ 15 kb 19
Figure 1.2. The chromosome scaffold as seen by Laemmli and colleagues. A) Electron micrographs of histone-depleted metaphase chromosome from HeLa cells showing the DNA is attached to the scaffold in loops. (Original Figure legend from 17). B) A central continuous DNA scaffold organized by the Condensin complex) assembles mitotic chromosomes. Adapted from 17,20
.
The DNA links at the base of the radial loops must be a result of a topological change in the chromatin structure. Topoisomerase II (TopoII) enzymatic activity consists of cutting both DNA strands, passing another DNA duplex through the cut and finally ligating the DNA. This function of TopoII is thought to be essential for relieving DNA entanglements after replication allowing for anaphase segregation of each duplicated chromosomes (discussed in more detail in section 1.2.2.2) 21
. This enzymatic activity of TopoII seems appropriate for changing any topological links and might relieve any DNA entanglements present at the base of the loops. Marko and colleagues proceeded to do the same
micromanipulation experiments but this time adding purified TopoII to the elongated chromosome. This resulted in a mean decrease of 35% of the initial spring constant of the treated chromosomes. Therefore, TopoII enzymatic activity can relax mitotic chromosomes by relieving any topological constrains present at the base of the DNA loops 22
Although there is clear evidence of the presence of a scaffold formed by a chromatin network regulating the mitotic chromosome structure, the exact nature of the scaffold is still unknown. One would expect that some protein-DNA interactions occur at the base of the loops, establishing or maintaining the loops. In fact, mitotic chromosomes treated with proteinase (K or trypsin) did become thinner but chromosomes never completely dissolved contrary to DNAse treatments 20,23,24
. This result suggests that the main link at the scaffold is provided by DNA-DNA interactions but involves some protein linkers. One such potential protein is the SMC (Structural maintenance of chromosome) complex (discussed in details in section 1.2.2.1). Overall, those micromanipulation experiments favor a model where
chromosomes are held together at their central axis through a continuous DNA scaffold organized by SMC proteins (Figure 1.2).
1.1.1.3. Alternative or new models of mitotic chromosome structure
Classic biochemistry, fluorescence light microscopy, EM and mechanical experiments have yielded significant advances in our knowledge of mitotic chromosome assembly,
however are limited by technical problems (e.g. in vitro analysis and the resolution limit light microscopy in living cells). Fortunately, new genomic techniques have emerged that allow large scale, in vivo analysis at < 100 kilo bases (kb) resolution of chromatin interaction 25
analyzed by polymerase chain reaction (PCR) (3C) or by Next-generation sequencing (4C, 5C and Hi-C). The Hi-C technology adds a biotin label at the ligation site allowing for purification of the fragments and a large-scale analysis of all the ligation fragments produced (vs selective PCR amplification from 3C experiments). 3C-based techniques have described different length-scale organization of the chromatin inside the nucleus. The first-order structures (mega-base scale) are compartments named A and B of active and inactive gene, respectively, localized in chromosomal territories (Figure 1.3) 26
. The second-order structures are TADs (Topologically Associated Domains) and sub-TADs and help connect 100 kb distant intra-chromosomal loci, needed for gene regulation (Figure 1.3). TADs are defined by high frequency interaction of chromatin fibers by looping in order to bring distal regulatory elements close to a given loci 27
. TADs are interspersed by barriers, which are regions of low frequency of interaction (Figure 1.3).
Organization of genomic loci in TADs was most obvious for gene regulation
(B.s), it was recently showed that the origin of replication OriC of the nucleoid is located in a large 1.4 Mega base pair (Mbp) domain which is itself composed of multiple, intra and inter-chromosomal arm hairpins (ranging from 100 to 350 kb loops). This important structure brings together specific DNA sequences in close proximity to the OriC. Overlapping Chip-Chip experiments of ParB (similar to Centromere protein A (Cenp-A)), SMC-ScpAB
(Condensin-like) and DNAa (regulator of origin firing) on interaction maps revealed that for example, SMC-ScpAB is enriched at parS sequences (centromere-like) and also brings close to the OriC regulators of origin firing. Finally, cells arrested in S-phase had disorganized chromatin while re-starting replication allowed the structures to reappear. Those experiments suggest the nucleoid of B.s. organizes its genome before and after replication through
chromatin loop folding in order to bring in close proximity regulatory elements for DNA replication. Finally, those contacts seemed to be regulated by Condensin-like protein 28. In fission yeast, the other SMC protein, the Cohesin complex, was found to be required to maintain the boundaries between structures called globules (small region of high interaction within one chromosome arm)29
.
TADs and compartments were more extensively studied in interphase nuclei of
eukaryotes and prokaryotes cells but some studies also applied the technique to determine the internal organization of the typical rod-shaped mitotic chromosome. Hi-C and 5C analysis of interphase chromatin found highly reproducible presence of TADs between early, mid G1 and S phase 30
Figure 1.3. Megabase to gene scale chromatin organization. Inside the interphase nucleus, a single chromosome is spatially segregated to a territory, limiting interchromosomal interactions. Intrachromosomal interactions are divided into compartments A (open) and B (close chromatin). Within each compartment, chromatin further folds into loops of ~ 100 kb called TADs. TAD’s self-association into loops are limited by low-frequency interaction domains called barriers. Finally, within a TAD, the gene regulatory elements form smaller loops necessary for gene expression regulation. Adapted from 31
.
interaction map. However, they found a threshold of 10 Mbp that dictated two states of chromatin organization for mitotic chromosomes. Regions above 10 Mbp in length had poor probability of interaction while regions below 10 Mbp had more frequent contacts. This suggests that chromosomes are linearly ordered on a scale above 10 Mbp. Comparing polymer modeling predictions to experimental data predicts that mitotic chromosome are formed by an array of consecutive loops of sizes varying from 80-120 kb anchored (or not) to a protein scaffold. Importantly, polymer modeling rejected the hierarchical folding loops
Chromosome territories
Compartements
TADs
sub-TADs
RE Gene Gene
Gene
RE RE
A
B
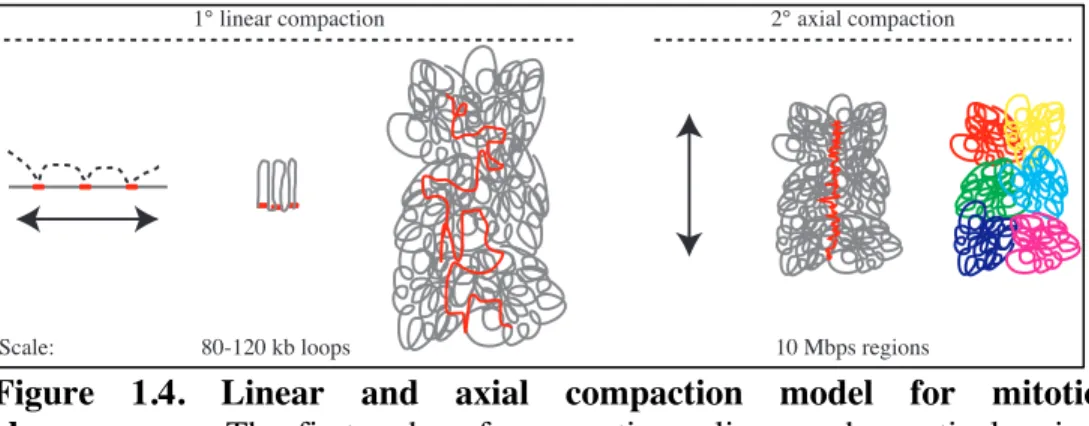
model. A 2-step model was proposed from those experiments and polymer modeling; first the chromatin assembles into arrays of 80-120 kb loops and then linearly ordered within regions of 10 Mbp. Linear ordering could be explained by axial compaction of the loop’s backbone which could form shorter and thicker chromosomes (Figure 1.4).
Figure 1.4. Linear and axial compaction model for mitotic
chromosomes. The first order of compaction relies on chromatin looping
and spans over 80 to 120 kb genomic regions. The second order of compaction is described by linear ordering of regions of 10 Mbps and above. Adapted from 32
.
1.1.2. Major drivers for mitotic chromosome assembly
1.1.2.1. Condensin complexes
Experiments performed by Laemmli and colleagues suggested there are 2 major components to the scaffold. Biochemical isolation of factors associated to chicken mitotic chromosome or to mitotic chromosomes assembled in Xenopus leavis (X. leavis) egg extracts identified TopoII 33
(discussed in following section) and Condensin as being two of them 3435 36
. Antibody staining performed on chicken, human, or frog cultured cell chromosomes, or on in vitro reconstituted mitotic chromosomes confirmed the likelihood of Condensin as being part of the mitotic protein scaffold. Condensin is rather diffuse during interphase but localizes on the chromatin during prometaphase and decorates the inner part of
1° linear compaction 2° axial compaction
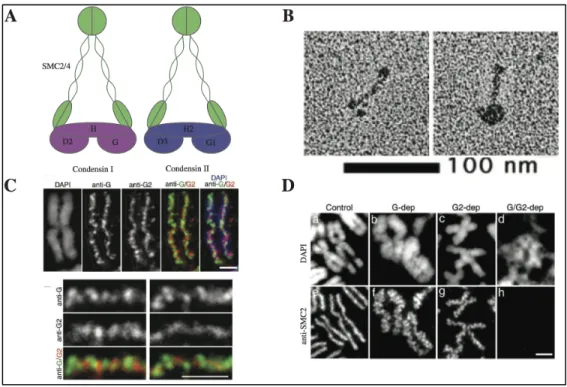
Figure 1.5. The Condensin complexes. A) Schematic representation of the Condensin complexes based on the electron micrographs shown in (B) Electron micrograph of the human SMC2/4 heterodimer (left) and holocomplex (right). C) High-resolution analysis of Condensin localization on mitotic chromosomes on HeLa cells metaphase chromosome spreads. D) Chromosome spread phenotype following siRNA of HeLa cells. Adapted from 37
and 38 .
fully condensed sister chromatids 3435
. (Figure 1.5) Antibody depletion of Condensin in frog egg extract prevents the formation of the typical rod-shaped chromosomes and results in highly entangled fibers. Further studies found that Condensin in almost all multicellular eukaryotes exists in 2 different forms; the Condensin I and II complexes. Each complex is pentameric and consists of 2 ATPase domain-containing proteins (SMC2 and SMC4) and a distinctive set of 3 associated proteins 3935
. The core subunits are part of a larger group of proteins; the SMC which also include the Cohesin complex (Smc1 and Smc3) required for sister chromatid cohesion, the SMC5-SMC6 complex and the distant RAD50 complex required for DNA repair and S-phase checkpoint 404142
Condensin II (SMC2, SMC4, CAP-D3, CAP-G2 AND CAP-H2) complex is found in almost every eukaryote except for fungi. Finally, Condensin I complex is essential for mice’s embryonic viability and reflects Condensin’s critical importance as chromosome organizers not only in chromatin condensation but also genome stability, cell differentiation, and development 43
.
Although both complexes are present across almost all species, they seemed to share different requirements or activities between complexes and between species. In mammals, Condensin II is located in the interphase nucleus and rapidly appears on mitotic
chromosomes during prophase and its depletion phenotype is strongest in prophase condensation. On the other hand, Condensin I only accesses chromosomes after NEBD (nuclear envelope break down) and its depletion prevents the prometaphase function of Condensins 37,44
. Depletion of chromosome organizers and visualization of mitotic chromosomes by light microscopy limits the ability of one to describe phenotypes as
chromosomes are poorly resolved by light microscopy. In mammalian cells, siRNA depletion of either core subunit (SMC2 or 4, therefore both complexes) leads to ‘fuzzy’ chromosomes. Condensin I specific depletion leads to ‘swollen” chromosomes and depletion of Condensin II leads to ‘curly’ chromosomes (Figure 1.5 and 37
). In Xenopus cell-free extract, duplicated chromosomes accumulate Condensin I and II in a similar fashion to mammalian cells, but in a 5:1 ratio (I:II) vs a 1:1 ratio in mammalian cells 3745
. Accordingly, Condensin II depletion in Xenopus cell-free extract had a very mild effect and almost fully condensed chromosomes can be seen whereas Condensin I depletion produced ‘fuzzy’ chromosomes similar to a Cond I/II depletion in human cells 45
equivalent amount of Condensin II (1:1), produces thicker and smaller chromosomes. Finally, in C. elegans, Condensin I depletion has only a very mild effect (defects in the next generation of animals) while Condensin II depletion prevents most chromosome compaction and is embryonic lethal (Figure 1.7)46,47
. Altogether, these observations suggest there is a balance between the complexes, leading to an optimally sized and shaped chromosome in a given cell type. For instance, based on the phenotypic appearances of chromosomes depleted of either complex, it was proposed Condensin II might be required for axial shortening of chromosomes while Condensin I might be required for lateral compaction 45
. Irrespective of which complex induces which type of compaction, yeast experiments focusing on Condensin at the centromere (where it is enriched) suggest that Condensin complexes provides axial compaction through chromatin looping 48
.
1.1.2.2. Topoisomerase II
The most abundant protein scaffold isolated on mitotic chromosomes by Laemmli and colleagues was the TopoII enzyme (more information on enzymatic activity follows in the next section) 36
. Indirect immunofluorescence and immuno-EM in chicken and human cells confirmed the localization of TopoII on the central axis of each sister chromatid, similar to what was observed for Condensin 36,49
. Unpublished work from a previous member of the Maddox lab showed that TopoII also localizes linearly on C. elegans mitotic chromosomes. Supporting the idea that TopoII is indeed an important factor of chromosome assembly, it was found that TopoII inactivation in fission yeast impairs DNA condensation and chromatid disjunctions 50
. Erythrocyte nuclei (low TopoII concentration) incubated in Xenopus frog extract depleted of TopoII cannot assemble mitotic chromosomes whereas HeLa cell nuclei (high TopoII concentration), in the same extract, can 51
Xenopus egg extracts showed that TopoII is in fact required for chromosome condensation but its depletion after chromosomes have formed did not affect chromosome morphology 33 . Also, the literature suggests TopoII is not stably associated to the chromatin; TopoII can be extracted from mitotic chromosomes with very low salt concentration, which would not be expected for a structural component 33
. Finally, it was found, by fluorescence recovery after photobleaching (FRAP) experiments that TopoII is not stably associated to the chromatin as it recovers fast and almost completely 5253
. Those experiments argue against a scaffolding role for TopoII.
Alternatively to having a role as a scaffold protein, it was suggested TopoII enzymatic activity might be more critical, but no consensus has been met yet. Treatments of chromatin assembled in a Xenopus cell-free mitotic extract with the TopoII enzymatic inhibitor VM-26 prevents condensation and the formation of the typical mitotic scaffold 54
. Mammalian cells treated with VM-26 or ICR-193, and treated to override a Topo-II loss of function induced G2, actually form condensed chromosomes and are positive for a protein scaffold staining by TopoII antibody 55
. These last experiments suggested TopoII enzymatic activity was not required to form mitotic chromosomes. Nevertheless, phenotypic analysis following TopoII depletion in human or chicken cells revealed that mitotic chromosomes are longer then control chromosomes suggesting an important role for axial compaction regardless of it being a result of a scaffold or an enzymatic activity 56,57
.
1.1.2.3. An interplay between TopoII and Condensin
researchers to pursue their experiments on in vitro models, which allow precise analysis of DNA topology. Progression through a cell cycle from transcription, DNA replication, and chromosome segregation, puts strain on DNA. Effectively, many enzymes relieve topological stress ensuring a smooth voyage through the cell cycle. Some topological modifications include the introduction of positive or negative twists on the DNA (supercoiling). Others involve DNA relaxation by removing supercoils through breakage and relegation of DNA strands and are achieved by TopoII 58
. Following DNA replication, sister chromatids are extensively intertwined and the links must be resolved for segregation to occur. TopoII can remove DNA catenates on inter (decatenation) or intra-chromosomal link (supercoil relaxation). It does so by introducing a break on a double-stranded helices and passing another segment of DNA58
. The most well described biochemical activity of Condensin on DNA is the capacity to introduce a global positive writhe into DNA. This was, in part, proved by the capacity of the holoenzyme, in vitro, to overwind circular DNA (or introduce positive supercoiling) in the presence of ATP and prokaryote Topoisomerase I (relaxes negative supercoil) 596061
. Moreover, it appears a balance between both Condensin’s supercoiling activity and TopoII overwind relaxation activity is required to maintain proper chromosome conformation in vivo 62. In fact, yeast cells depleted of TopoII showed an increased amount of positively super-coiled plasmid DNA, which was dependent on the presence of Condensin. Also, mitotic frog extract containing unreplicated chromosomes depleted of Condensin still form a TopoII axial structure, but adding Condensin back allows for the formation of mitotic chromosomes 63
. Therefore, it was proposed that during mitosis, Condensin supercoiling activity is balanced by the relaxation activity of TopoII leading to fully relaxed chromatin in interphase when Condensin is inactivated 64
This supercoiling activity of Condensin leads to the formation of loops onto the DNA. It is reminiscent of previously proposed models that chromatin condenses into mitotic
chromosomes through generation of loops either attached to a protein scaffold or through formation of a chromatin network. Interestingly, structural analysis by EM of the Condensin holoenzyme revealed that each SMC core subunit folds through the coiled-coil region, exposing a hinge domain and bringing in close proximity the Walker A and B ATPase motif (Figure 1.5). The core subunits associate through their hinge domain and the 3 non-SMC subunits adjacent to the catalytic heads, close the complex. The coiled-coil regions of both core subunits were seen either closed (interacting with the other core subunit coiled-coil region) or in an open conformation 65
. This structural arrangement of the holoenzyme and biochemical assays lead to two different hypotheses for Condensin involvement in loop formation. First, it could act as a structural component of the chromosomes by entrapping two DNA fragments at the base of one loop. This model is based on known experimental evidence of DNA entrapment by the Cohesin ring which were replicated with Condensin 66
. However, this model does not take into account the supercoiling activity of Condensin. Another hypothesis suggests that supercoiling activity of Condensin directly generates loops. The size of the loops could determine the level of compaction and therefore change the shape and the structural properties of the chromosome 67
.
Figure 1.6 Topoisomerase II and Condensin’s biochemical activity on
chromatin. Chromosome coiling density is regulated by the balanced
biochemical activity of Topoisomerase II and Condensin where Condensin induces supercoiling activity and Topoisomerase II relaxes supercoiled DNA. Adapted from 58,68,69
1.1.2.4. Centromere-protein A (CENP-A)
In C. elegans, another protein was shown to form a linear axis along the length of the mitotic chromosome and to play a major role in chromosome assembly: CENP-A 70. C elegans chromosomes are holocentric meaning the centromere is present along the entire length of each sister chromatid rather than monocentric when the centromere is restricted to the primary constriction of each chromosomes (Figure 1.7). Centromeres mark the location where the kinetochore is built on each chromosome and are defined by the presence of the histone H3-variant CENP-A. CENP-A assembles in octameric nucleosomes, replacing H3, and is incorporated into the chromatin via a non-canonical pathway outside of S phase 71
. The genomic loci where CENP-A is incorporated vary dramatically across species ranging from a 125 bp sequence in budding yeast to Mbp of repeated α-satellite sequences in humans. Accordingly, CENP-A incorporation into the chromatin is not defined by the DNA sequence (except for budding yeast) and CENP-A nucleosomes are thought to be the epigenetic mark defining the centromere72
. As CENP-A is incorporated outside of the S phase, its propagation
to newly replicated DNA is decoupled from replication. How is this epigenetic mark
propagated trough the cell cycle is an open question and up for debate as many models were proposed in the past (Reviewed in 73
). Even if very different, they are based on a similar idea that pre-existing CENP-A at the centromere primes the incorporation of new CENP-A. However, observations made in C. elegans challenge this idea as both meiotic oocyte and sperm DNA are completely stripped of their CENP-A nucleosomes and reincorporate new CENP-A at either the first mitotic cell cycle (sperm) or first meiotic prophase (oocyte) 74
. Precise mapping and quantification of CENP-A’s genomic coverage in C. elegans revealed it is incorporated in small domains that span half the genome. It was found there is a general inverse relationship to CENP-A incorporation and transcription (high level of RNA
polymerase II correlates with low CENP-A incorporation and low level of RNA polymerase II correlates with high CENP-A incorporation). The one exception to this pattern is the regulatory region of genes transcribed in the germline, which lacks CENP-A both in the germline and embryonic chromatin (no germline transcription in early embryos; should incorporate CENP-A). During development, genes transcribed in the embryo are refractory to CENP-A but silent genes incorporate CENP-A (except germline genes)74
. This pattern establishes dispersed domains of differential epigenetic states. As there are only enough CENP-A nucleosomes to cover 4% of the genome, each domain contains a 10:1 ratio of H3:CENP-A. This pattern was also confirmed by another study75
. However, authors from this last study found that the preferred site to assemble kinetochores resides at discrete point-centromere-like position where one CENP-A nucleosome is flanked by 2 canonical nucleosomes. Those point-centromeres occur outside the broad domains described
very mildly in C. elegans suggesting, perhaps, the broad domains and the point-centromeres versions of CENP-A serve different purposes, one for chromosome structure and the other for kinetochore assembly, respectively 70
.
Monocentric chromosomes from other organisms also show an organization
reminiscent of the one described above. It is known the centromere chromatin is composed of blocks of CENP-A nucleosomes interspersed with block of H3 nucleosomes (centromeric chromatin) and is embedded between regions of heterochromatin (pericentromeric
chromatin). This pattern of CENP-A and H3 nucleosome distribution is important for the structural identity of the centromeric region as, on a mitotic chromosome, the blocks are organized so the H3 nucleosomes face the inner chromosome and the CENP-A nucleosomes are located poleward, allowing for kinetochore assembly 76. Moreover, the H3 nucleosomes in the pericentromeric vs centromeric region have distinct epigenetic marks. For example, H3 nucleosomes in the centromeric chromatin lack known heterochromatin marks like
H3K9me2 which is present in pericentromeric chromatin. 77 .
Structurally, CENP-A nucleosomes have increased internal rigidity compared to H3 nucleosomes that was proposed to drive self-assembly of centromeric chromatin on the outer face of mitotic chromosomes, excluding H3 nucleosome towards the inside of the
chromosome 72
, (Figure 1.7). Fitting with this hypothesis, in vitro reconstitution of synthetic arrays showed that CENP-A containing nucleosomes are more condensed then bulk
chromatin78
nucleus, consistent with the notion that CENP-A provides structural rigidity to mitotic chromosomes (Figure 1.7) 70,79
.
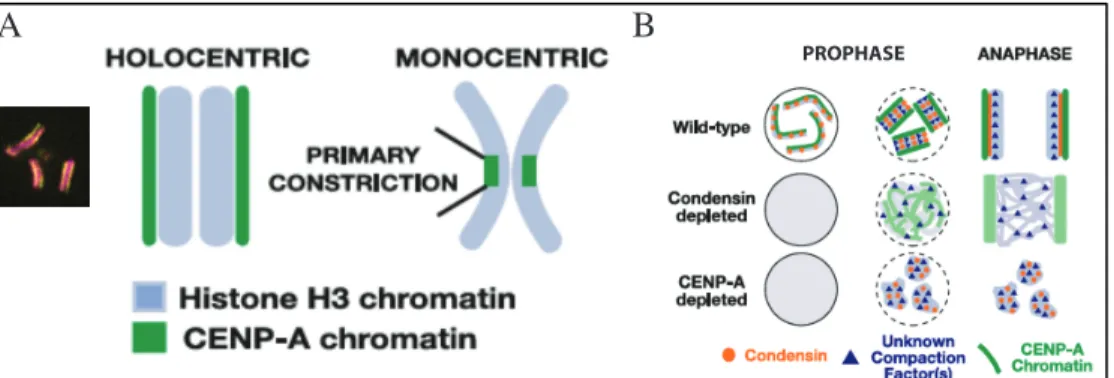
Figure 1.7 Mitotic chromosome organization in C. elegans. Adapted from
70
. The unknown condensation factor appears to be TopoII from unpublished work.
Altogether, those observations suggest CENP-A nucleosome positioning on a linear chromatin fiber is rather important and perhaps directs the 3D organization of the chromatin. However, the exact contribution of CENP-A to holocentric mitotic chromosome assembly is not known at the moment.
1.1.2.5. Histone modifications
Other known drivers of mitotic chromosome assembly are histone tail modifications. The histone N-terminal tails are flexible regions that extend outside the DNA superhelix and are subject to interactions with DNA or proteins from its own or neighboring nucleosomes. Each nucleosome is highly negatively charged and can direct nucleosome-nucleosome interactions. Therefore, the histone tails are necessary for secondary and tertiary structure of mitotic chromosomes.
A B
The most famous histone modification observed on condensed chromosome in
mitosis is Histone H3 Serine 10 phosphorylation (H3S10P). This modification is mediated by the kinase Aurora B at the onset of mitosis is concomitant with the start of chromosome condensation 80
. Although this modification is highly conserved from yeast to humans, its actual role in chromosome assembly remains elusive. Chromosome condensation requires this modification in both Tetrahymena thermophila and in fission yeast as a S10 residue mutated to alanine increases segregation defects 81,8283
. In budding yeast, H3S10P was shown to be required for anaphase condensation of an abnormally long chromosome whereas cells with a WT genotype, but having a S10A mutation, do not otherwise show any phenotype linked to defect in chromosome condensation 80
.
Another possible role for histone modifications on mitotic chromosome assembly is the recruitment of important condensation factors. In human cells, the mark H4K20me1 accumulates on chromatin in mitosis as a result of the dissociation from the chromatin of its demethylase. It was suggested that this particular mark may recruit Condensin II in prophase as they both accumulate on the chromatin in parallel and Condensin II is selectively pulled-down from an H4K20me1 IP (immunoprecipitation) 84. A very good example of how those two functions of histone modification are orchestrated during mitosis to form mitotic chromosomes was presented in a study published in Science by Wilkins and colleagues 85
condensation. In fact, acetylation of H4K16 is known to prevent formation of compact chromatin fibers in vitro 86
.
1.2.Cell size scaling
Cellular structures are confined within a space, which depends on the size of a given cell. As cells can reach a wide distribution of size any particular organelle must regulate its size according to cell size, a phenomenon hereafter termed scaling. In order to define the presence of scaling or the control of organelle size, one need to determine the nature of the uncontrolled situation (absence of scaling) or, in other terms, define the null hypothesis. For example, polymer structures assembled from monomers (filaments for example), at
equilibrium, can have an exponential size distribution given there are no controls on the assembly/disassembly parameters. Scaling is defined by a distribution of length narrower than the null hypothesis. The length distribution of assembled filaments would depend on the number of filaments, the association/dissociation constant, and the quantity of monomers present in the cell87
. Changing any of these parameters will restrict or control length. Therefore, for example, the mitotic spindle reaches a size that allows proper chromosome segregation within the space given by cell size. It was found that microtubule destabilization (reduced microtubule life-time) through the severing activity of a protein, Katanin, can regulate the length distribution of spindles assembled in Xenopus egg extract 88
1.2.1. Model organisms to study cell size scaling
1.2.1.1. C. elegans as a model organism
Sydney Brenner chose the Caenorhabditis elegans (C. elegans) nematode as a genetic model to answer questions in developmental biology over 50 years ago. C. elegans is a small 1 mm round worm which can live as either a self-fertilizing hermaphrodite (XX) or
Each mitotic cell division is highly stereotypical and reproducible. The first cell division has been used to answer many different cell biological questions. For example, its progression through mitosis is very well described and has been used to understand basic molecular biology of the cytoskeleton and chromosome assembly (Figure 1.8). Also, the high efficiency of RNAi depletion in the gonad produces embryos with reproducible protein depletion often greater than 95%. Altogether, C. elegans’s first cell division is a very
powerful tool to study cell division. (Adapted from Wormbook.org)
1.2.1.2. Cell and nuclear size scaling by Conklin
In the late 19th-early 20th century, Conklin performed a series of experiments that would set the ground for how we understand and study cell size scaling. He used embryos from the sea snail Crepidula plana (C. plana) as a model organism as the embryos go through consecutive cell division without growing, resulting in smaller and smaller cells. Moreover, C. plana as a spiralian embryonic development meaning starting at the 4 cell stage, the division of the big macromere cells gives rise to smaller micromeres cells (Figure 1.9). He observed that structures like the nucleus, the mitotic spindle, and the chromosomes, adjust their size according to cell size (Figure 1.9). Next, Conklin experimentally changed the amount of cytoplasm inherited by each blastomere during cleavage. Centrifugation of the embryos separates the cytoplasm from the yolk, which are unequally distributed during the following mitoses. He found that the amount of cytoplasm inherited by each cell sets organelle size like the nucleus (Figure 1.9). Those experiments provided the first evidence that the amount of cytoplasm, rather than the physical boundary of the cell, sets the size of the organelles. For nearly a century, the following question of how the cytoplasm can set the size of an organelle remained unanswered. Those fundamental questions are just being revisited. As first develop by Conklin, the early embryonic development of diverse animal remains a model of choice for studying cell size scaling. Therefore, recent studies will often use either the embryonic development of popular model organism like C. elegans or X. laevis. Those models are ideal to identify basic cell size regulation of organelle size.
mechanism. New models or approaches are required to study cell size scaling in more representative cell types.
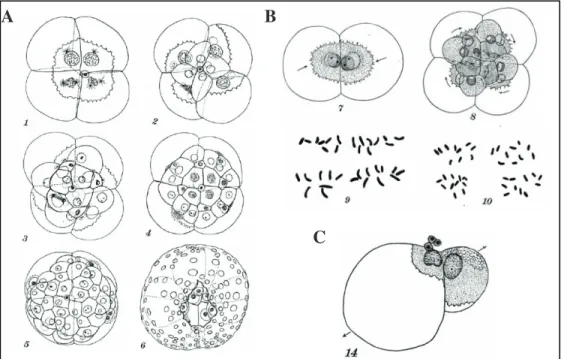
Figure 1.9 Cell size and nuclear size by Edwin G. Conklin (1912). A)
Successive stages in the development of the egg of C. plana, showing the maximum sizes of the nuclei of the macromeres. B) Fig. 7 2-cell stage of C. plana. The nuclei just before the second cleavage are 24p in diameter. Fig. 8 12-cell stage of C. plana. The nuclei in the first quartet of micromeres, la-ld, three of which are dividing, are 14p in diameter at their maximum size. Fig. 9 Chromosomcs from four different spindles of the second cleavage, all in the metaphase and all magnified ZOO0 diameters. Fig. 10 Chromosomes from four different spindles of the cells la-ld, all in the metaphase and all magnified 2000 diameters. C) Fig. 14 From the same experiment as the preceding (Fig. 13 Centrifuged five hours (2000 revolutions per minute) during the first cleavage; fixed at once; structure similar to preceding.). Size of nuclei is proportional to the quantity of clear (granular) cytoplasm; yolk and oily or watery constituents of the cytoplasm do not influence nuclear size. Figure and integral Figure description from 89
.
1.2.2. The Limiting Component Model
The first and most intuitive way to regulate the size of a structure is to control the number of building blocks available. Depending on the dynamics of the structure, two
A B
assembles/disassembles, it is expected to have an exponential length distribution. However, if the structure is of fixed size and subunits are assembled irreversibly, the starting amount of material defines the final organelle length. It is also important to remember there is a balance between the starting material, the number of organelles, and the final size of the organelle. At equal concentrations, the amount of cytoplasm (or cell size) regulates the final size of a structure, as smaller cells have less subunits than larger cells. The rate of assembly of any structure is determined by the cytoplasmic concentration. Therefore, as the structure grows the cytoplasmic pool is depleted and the rate of assembly decreases 90
. This model could be compared to the null hypothesis, as the starting amount defines the finite size of the
organelle. However, in theory a cell should be able to constantly make more precursors suggesting there is an actual control to the amount provided in each cell. The limiting component model seems rather convenient for a cell as there is no need for the cell to actually measure cell size or organelle size90
. This model describes how the size of mitotic structures like centrosome and spindle is regulated during early C. elegans or X. laevis embryonic development, respectively91
.
1.2.3. Molecular ruler
A molecular ruler is described by the presence of a protein of a fixed size, which controls the size of the organelle. Other components can further assemble around this ruler. Examples of molecular rulers are mostly found in bacteria and viruses 87
. To date, there is only one example in animal cells, where subunits of the dynein complex regulate the size of cilia and flagella. It acts as a perfect ruler because protein sequence modification doubling the length of dynein doubles the spacing between axonemes 92
regulating structural size is not flexible as it depends on the primary sequence of a protein. Any adjustments need to be made at the amino acid sequence level.
1.2.4. Assembly/disassembly rate
Length dependent assembly/disassembly rate is an additional way of controlling structural length. The microtubule Kinesin-8 motor protein is one such example of size control through a length dependent disassembly rate. In yeast, Kip3p binds microtubules and walk towards the plus end where it pauses. It will only leave the plus end when another Kip3p protein reaches it. In the process, it disassembles one or two tubulin dimers. Therefore, smaller microtubules have a reduced flux of kinesin-8 and reduced disassembly rate. This mechanism of action of the kinesin-8 gives time for smaller microtubules to grow while longer microtubules disassemble faster93
.
1.2.5. Molecular gradients
defines the activity of microtubule regulator (MAPs or microtubule associated proteins) and can regulate mitotic spindle length through differential release of MAPs.
1.3.Chromosome size scaling
As was described in previous sections, very little known on how chromosomes assemble in mitosis to ensure proper DNA segregation and generation of two genetically identical sister cells. One major limitation of studying chromosome assembly is the
lethality in the fusion strain compared to a WT strain. This strategy allowed us to identify both CENP-A and Topisomerase II as crucial chromosome size regulators during C. elegans early embryonic development. Last, we identified new model organism to test our model of chromosome size scaling in Chapter 4.
Our strategy allowed us to quantify changes in chromosome compaction and identify potential regulators of chromosome size. Further studies will help refine our findings and determine whether chromosome compaction over the different length scale during
Chapter 2. MITOTIC CHROMOSOME LENGTH SCALES IN RESPONSE TO BOTH CELL AND NUCLEAR SIZE
2.1.Introduction
During metazoan development, embryonic cells decrease in size by up to two orders of magnitude (from 1.2 mm to 12 μm in X. laevis) as a consequence of multiple rounds of cell division without growth of the embryo. Using X. laevis or C. elegans embryos as model organisms, it has been shown that mitotic structures, including mitotic spindle length, centrosome size and nuclear size, all scale with cell size 1,88,94-96
.
The study of mitotic chromosome scaling has received less attention even though the phenomenon was first reported over 100 years ago 89,97-100
. The size of an organism’s genome remains constant in all diploid cells in spite of dramatic and rapid changes in cell size during embryonic development. The maximum length of condensed mitotic chromosomes cannot exceed half of the spindle length100
. Thus, mitotic chromosomes scale in size in response to decreasing cell size.
subjected to an entire cell cycle in large cell egg-extract, the resulting size of mitotic
chromosomes matched those of larger cells. Therefore, it was concluded the nuclear volume had no apparent effect on chromosome size scaling 98
. Chromosome length measured in fixed, flattened C. elegans embryos indicated that artificial reduction in nuclear size (through disruption of nuclear import/export trafficking) reduced chromosome size 97
. In addition, interphase X. laevis nuclei incubated in egg extract and prevented from expanding by inhibiting nuclear import resulted in smaller chromosomes. In sum, studies on chromosome length scaling have not reached a consensus.
To investigate the seemingly disparate results found in C. elegans and Xenopus, we developed a quantitative live-cell assay of C. elegans embryos that allowed us to evaluate cell, nuclear, and chromosome size. The C. elegans embryo has a relatively low diploid number (12) and homogeneous chromosome size (varying by less than 50% in genomic length) providing an excellent system to study chromosome size scaling in vivo. We have correlated cell, nuclear, and chromosome size in measurements derived from intact embryos allowing statistical analysis of this process. RNAi based depletion to independently alter cell or nuclei size in order to decouple developmental program from normal scaling showed that chromosome size scales to cell size as well as nuclear size. We found that depletion of proteins required for establishing the RAN-GTP gradient decoupled cell size from
chromosome size, however the relation between nuclear size and chromosome length was to some extent maintained. In sum, our results show that chromosome size scales via a
2.2.Results and discussion
2.2.1. Chromosome length regulation during the first 4 divisions of C. elegans embryos
Figure 2.1 Chromosome length scales to cell size during early C. elegans
embryogenesis. A) Representative still images of time-lapse movies from
TH32 embryos at the 1 to 16-cell cell stage. Insets are enlargement of the nucleus in prometaphase. Scale bar = 5 μm. B) Prometaphase chromosome length measurements at different developmental stages (marks) and in correlation to cell size (up to 30 μm in diameter, linear regression). n = 354
Previous work has not comprehensively analyzed chromosome length scaling relative to cell and nuclear size. To accomplish this goal, we used high-resolution time-lapse
microscopy to image mitotic divisions in C. elegans 1 to 16-cell cells stage embryos
Chromosomes in cells after the 16-cell stage were difficult to resolve, precluding accurate analysis at this time. Our previous analysis showed that chromosome condensation in C. elegans completes to greater than 90% about 30 seconds prior to nuclear envelope breakdown (NEBD), therefore we measured chromosome length at that time70
. Altogether, this analysis confirmed that condensed chromosomes are shorter in the smaller cells of more developed embryos (Figure 2.1B).
Table 2.1. One-way ANOVA comparing developmental stage for each RNAi condition or all RNAi conditions at each developmental stage.
Condition ANOVA Significance
C
on
d
iti
on Control RNAi *
ima-3 RNAi *
rcc1 RNAi *
D eve lop eme n tal stage
1 cell stage *
2 Cell stage *
4 Cell stage *
8 Cell stage *
16 Cell stage *
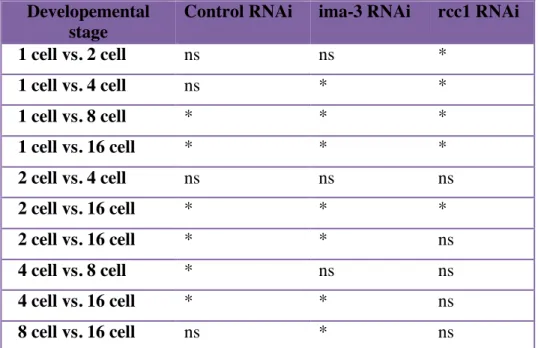
Table 2.2. t-Test statistical significance of chromosome length differences comparing all developmental stages for each RNAi condition.
Developemental stage
Control RNAi ima-3 RNAi rcc1 RNAi
1 cell vs. 2 cell ns ns *
1 cell vs. 4 cell ns * *
1 cell vs. 8 cell * * *
1 cell vs. 16 cell * * *
2 cell vs. 4 cell ns ns ns
2 cell vs. 16 cell * * *
2 cell vs. 16 cell * * ns
4 cell vs. 8 cell * ns ns
4 cell vs. 16 cell * * ns
8 cell vs. 16 cell ns * ns
The multiple comparisons Student’s t-test was corrected using the Bonferroni correction. * P ≤ 0.05,ns not significant.
Our analysis revealed that chromosome size differences between the 1 to 4-cell stages were not significant whereas differences later in development were (Control Bonferroni's multiple comparisons test Table 2.2., following the One-Way ANOVA, Table 2.1.). We interpret the lack of significant difference early in development as indication of a plateau or upper limit to chromosome size (discussed in more detail below). A similar concept has been applied to infer upper limits of both spindle and chromosome length during Xenopus early embryonic development 96,98
.
represents the chromosome length at a theoretical cell size of 0 μm and thus represents the theoretical minimal chromosome length. Applying this rule revealed that, in early C. elegans embryos, chromosome length is reduced predictably by 51.5 ± 10 nm per 1 μm reduction in cell size. At a theoretical cell size of 0 μm, chromosome length would be 2.06 ± 0.22 μm (Table 2.3.). We will use those parameters to determine how different perturbations affect chromosome length regulation.
2.2.1. In early embryos chromosomes shorten in response to decreasing cell size
To determine if we can artificially generate chromosome scaling anomalies as noted above, we sought to decouple cell size and developmental stage by changing the overall size of the embryo. We successfully reduced embryo size by depleting an Importin α protein, IMA-3 (Figure 2.2., 2.5.) 101
. Partial depletion (24 hours) of IMA-3 resulted in smaller embryos while maintaining chromosome condensation, whereas longer depletion (48 hours) resulted in pleiotropic effects including loss of chromosome condensation (Figure 2.2A, Figure 2.5.). The developmental program of the IMA-3 partial depleted embryos was not altered as evidenced by the proper nuclear localization of a PIE-1::GFP protein (a germline transcription factor) and proper cell polarity at the 4-cell stage (Figure 2.5.) 102
.
When comparing chromosome length, and cell size for each developmental stage, our analysis confirmed an early plateau in smaller IMA-3 depleted embryos (Table 2.2.). The plateau in IMA-3 depleted embryos spanned only the 1-2 cell embryo stage instead of 1-4 cell stage seen in controls. As predicted from a cell size based regulatory mechanism, the rate of chromosome length scaling in relation to cell size after depletion of IMA-3 was not
Table 2.3., Figure 2.2.). The minimal chromosome size (y intercept), a measure that is cell size and not developmental stage based, was also not statistically different from controls (Table 2.3.). In sum, these results are in agreement with a cell size based mechanism regulating chromosome length and not a developmental switch hypothesis.
Table 2.3. Correlation between cell size, nuclei size and chromosome length in Control, IMA-3, RCC1 and NTF-2 depleted embryos.
C el l d iame te r vs chro mos ome le n gth ( μ m)
Condition Slope pValue Intercept
Control (333) 0.052 +/- 0.01 4,11E-07 2.056 +/- 0.251
ima-3 RNAi (285)
0.053 +/- 0.007 1,38E-11 1.79 +/-0.144
rcc1 RNAi (185) 0.019 +/- 0.012 0,1016 1.857 +/- 0.245
N u cl ear d iame te r vs ch romos ome le n gth ( μ m)
Condition Slope pValue Intercept
Control (316) 0.130 +/- 0.033 0,00011151 2.182 +/- 0.252
ima-3 RNAi (272)
0.210+/- 0.026 4,28E-14 1.387 +/- 0.179
rcc1 RNAi (165) 0.120 +/- 0.036 0,0010262 1.436 +/- 0.264
C el l d iame te r vs n u cl ear d iame te r ( μ
m) Condition Slope pValue Intercept
Control (64) 0.239 +/- 0.022 2,62E-15 2.334 +/- 0.477
ima-3 RNAi (70) 0.249 +/- 0.016 7,13E-24 1.965+/- 0.291
rcc1 RNAi (21) 0.199 +/- 0.046 0,00056384 2.861 +/-0.954
C el l vol u me vs n u cl ear vol u me ( μ m3)
Slope pValue Intercept
Control (37) 0.009688 +/- 0.0009577 6,25E-12 183.55 +/- 13.85
rcc1 RNAi (23) 0.0053036 +/- 0.0020787 0,0186 105.63 +/-
27.965
ntf-2 RNAi (27) 0.002163 +/- 0.001139 0,0693 120.4 ± 13.22
Figure 2.2 Chromosome length scales to cell size not developmental
program. A) Representative still images of time-lapse movies from TH32
after RNAi depletion at the 2-cell stage. Shown is the outline of the embryo and size of the depicted embryo, black control, green IMA-3 RNAi and purple RCC1. Control overlaid on ima-3 to illustrate differences in size. Scale bar = 5
μm. B) Chromosome length correlated to cell size in Control, IMA-3 and RCC1 depleted embryos. C) Graph representing the linear regression of cell size vs chromosome length. The shadows represent the 95% confidence interval. In B, Controls measurements are duplicated from Figure 1 in order to compare the other conditions. IMA-3 RNAi n = 287, RCC1 RNAi n = 207.
2.2.2. Cell size and nuclear size independently regulate chromosome length scaling