Long-term consequences of differences in early growth:
epidemiological aspects
the department of Cancer Research and Molecular Medicine of the Faculty of Medicine, Norwegian University of Science and Technology in Trondheim, Norway.
Financial support for the printing of this thesis by Novo Nordisk b.v., Pfizer b.v., Ferring b.v., Ipsen Farmaceutica b.v., Eli Lilly Nederland b.v., and Vygon is gratefully acknowledged.
Cover photography: Dorothée Out
Printing and lay-out: drukkerij Mostert en Van Onderen, Leiden
ISBN: 978-90-9024763-2
Copyright © 2009 A.M. Euser
Long-term consequences of differences in early growth:
epidemiological aspects
Proefschrift
ter verkrijging van de graad van Doctor aan de Universiteit Leiden, op gezag van Rector Magnificus prof. mr dr P.F. van der Heijden,
volgens besluit van het College voor Promoties te verdedigen op dinsdag 8 december 2009
klokke 15.00 uur door
Anne Margriet Euser
Promotores: Prof. dr J.M. Wit Prof. dr F.R. Rosendaal
Co-promotor: Dr F.W. Dekker
Overige leden: Prof. dr H.A. Delemarre-van de Waal
Prof. dr J.A. Romijn
Prof. dr P. Verloove-Vanhorick Mw dr S. le Cessie
Dr S.I. Hallan
Table of contents
Chapter 1 General introduction 7
Chapter 2 Growth of preterm born children 15
Hormone Research 2008; 70: 319-328
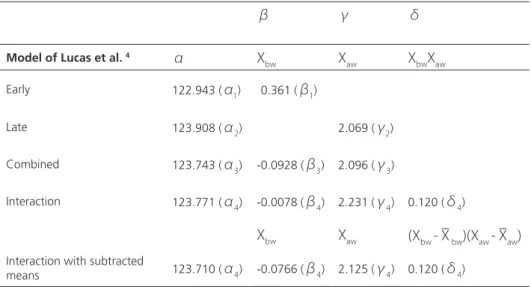
Chapter 3 A regression model with unexplained residuals was preferred in the 35
analysis of the fetal origins of adult diseases hypothesis
J Clin Epidemiol 2005; 58: 1320-1324
Chapter 4 Reliability studies can be designed more efficiently by using variance 47
components estimates from different sources
J Clin Epidemiol 2007; 60: 1010-1014
Chapter 5 A practical approach to Bland-Altman plots and variation coefficients 61
for log transformed variables
J Clin Epidemiol 2008; 61: 978-982
Chapter 6 Intrauterine growth restriction: no unifying risk factor for the metabolic 75
syndrome in young adults
Eur J Cardiovasc Prev Rehabil 2009 in press
Chapter 7 Effect of intrauterine growth restriction on kidney function at young 91
adult age: the Nord Trøndelag Health (HUNT 2) Study
Am J Kidney Dis 2008; 51: 10-20
Chapter 8 Associations between prenatal and infancy weight gain and BMI, 111
fat mass, and fat distribution in young adulthood: a prospective cohort study in males and females born very preterm
Am J Clin Nutr 2005; 81: 480-487
Chapter 9 General discussion 129
Chapter 10 Summary 151
Samenvatting 155
Dankwoord 163
Curriculum Vitae 165
1
General introduction
9
Background
Morbidity and mortality caused by aberrant metabolic profiles and subsequent disease form
a considerable health problem world-wide.1 At present, a wealth of studies have shown an
association between low birth weight as an indicator of poor intra uterine growth, and adult
metabolic diseases like obesity, type 2 diabetes, hypertension, and cardiovascular incidents.2-5
More recently, it has been found that especially the combination of small size at birth followed
by increased catch-up growth in later life is detrimental for adult cardiovascular health.6-8
However, despite this abundance of studies on the early origins of adult disease, unresolved questions still remain.
In the majority of the original publications, the focus has been on the population born at term. The number of subjects born preterm included is very low, and often no clear distinction has been made between low birth weight due to term birth small for gestational age, or due to preterm birth. Nevertheless, studies in subjects born preterm could provide unique and important information about the timing of the early origin of adult metabolic disease. The third trimester of gestation is a critical developmental period, and malnutrition during this
time span has been related to reduced adult glucose tolerance in the Dutch famine studies.9
Infants born very preterm almost invariably experience postnatal growth failure during
this trimester ex utero, often followed by later catch-up growth.10-15 Recently, it has been
speculated that individuals born preterm might experience similar metabolic consequences in
adult life as term born individuals with low birth weight.16,17 This has important implications
for population health, because the frequency of preterm birth as well as the survival rates of infants born very preterm are increasing, which leads to a higher proportion born prematurely
in the population.18
As the first generation of infants surviving very preterm birth has now reached adulthood, we assessed the effects of both prematurity and early growth on young adult metabolic outcomes in the Dutch national Project On Preterm and Small-for-gestational age infants (POPS) cohort. In this cohort, described in more detail below, 19 year old individuals born with
a gestational age <32 weeks in general have a lower insulin sensitivity,19 a higher prevalence
of hypertension,20 and a reduced kidney size21 compared with the general population. Less
growth in the early postnatal period leads to a high risk for short stature in adulthood22,
while more growth in childhood aggravates insulin resistance after low birth weight19.
No associations were found with the lipid profile and intima-media thickness at this age23.
The combination of preterm birth and intrauterine growth retardation seems to contribute
to abnormal renal function at young adult age.24 Antenatal treatment with the corticosteroid
However, before remaining research questions in this field will be addressed, some specific methodological issues indissolubly attached to these studies deserve special attention. Although part of the findings described above have been confirmed in animal studies, one should realize that in the human all “evidence” results from epidemiological studies. Preferably these data arise from prospective cohort studies to avoid recall bias and inaccurateness in perinatal data e.g. birth weight. Yet, the effects searched for are often small and come into existence only a long time period after birth, while during this period life style effects are considerable intervening variables. This raises the need for a large study population resulting often in a multi-centre design. For a correct interpretation of the results, it is important to know the reliability of measurements between the participating centres, which can be estimated in different ways. Preferably this reliability should be assessed within the study population itself.
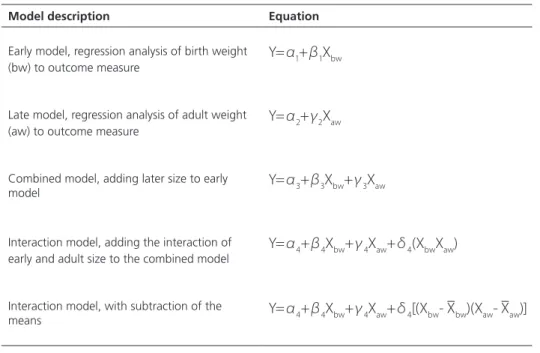
While in this way most research questions concerning the early origins of adult disease can be analyzed with a straightforward approach in a classical epidemiological design with a linear regression model, special attention is required when the effect of both birth weight and subsequent postnatal growth on adult outcome are taken into account. These two effects can be estimated by using two separate models for the two separate research questions, but often these are combined in one model. In the latter situation, the regression coefficient of early growth will change when later-life variables are added to the model, which should be interpreted correctly.
Rationale for this thesis
In this thesis first three specific methodological issues related to early origins of adult disease studies will be addressed. Subsequently, three questions about the effects of prenatal and early postnatal growth on adult health outcomes will be studied.
In the methodological part of the thesis, we will focus on three points: 1.
the optimal regression model for analyzing and interpreting the effect of both a.
prenatal and postnatal growth on adult health outcomes, the efficiency of reliability studies in a multi-centre study, b.
the correct and clear assessment of reliability for log transformed outcomes. c.
In the clinical part of the thesis about the effect of early growth on adult health, we 2.
will focus on three main outcomes:
adult renal function in non-premature subjects with low birth weight, a.
the adult metabolic syndrome and its separate components, b.
General introduction
11
Study populations
HUNT-2
The follow-up studies of subjects born at term described in this thesis were conducted as part of the Norwegian Second Nord-Trøndelag Health (HUNT-2) Study. By performing unique linkage with the national Norwegian birth registry a cohort could be formed of all subjects aged 20 to 30 years living in this Norwegian county, which has a stable and homogeneous Caucasian population. Subjects were born between 1976 and 1977, with birth weights ranging from 1000 to 5600g, mean 3500 grams. About 4.5% of them was born preterm, of whom 0.4% very preterm. Perinatal data were registered at birth. Assessments in the HUNT-2 study took place between 1995 and 1997. Among others, venous blood was obtained, anthropometry was performed, and blood pressure was measured. The response rate in this age group was 49%, with living outside the county and lack of time as the main
reasons of not attending.26
POPS-19
The study in subjects born preterm originates from the Project On Preterm and Small-for-gestational-age infants (POPS) 19 study. The POPS cohort comprises 94% of all live born infants born very preterm (< 32 gestation weeks) or with a very low birth weight (< 1500g) in the Netherlands in 1983 (85% of Caucasian origin). The POPS cohort has been intensely studied over the years with regard to physical and psychosocial outcomes. In 2002-2003 a new follow-up assessment took place and among others anthropometry at age 19 was measured. The response rate was 62%, with male sex, non-Dutch origin, and low maternal
education overrepresented in the non-response group.27
Outline of this thesis
General introduction
13
References
1. Lopez AD, Mathers CD, Ezzati M, Jamison DT, Murray CJ. Global and regional burden of disease and risk factors, 2001: systematic analysis of population health data. Lancet 2006; 367:1747-1757.
2. Barker DJ, Winter PD, Osmond C, Margetts B, Simmonds SJ. Weight in infancy and death from ischaemic heart disease. Lancet 1989; 2:577-580.
3. Schluchter MD. Publication bias and heterogeneity in the relationship between systolic blood pressure, birth weight, and catch-up growth--a meta analysis. J Hypertens 2003 Feb 1921;273-279.
4. Newsome CA, Shiell AW, Fall CH, Phillips DI, Shier R, Law CM. Is birth weight related to later glucose and insulin metabolism?--A systematic review. Diabet Med 2003 May 1920;339-348. 5. Harder T, Rodekamp E, Schellong K, Dudenhausen JW, Plagemann A. Birth weight and subsequent
risk of type 2 diabetes: a meta-analysis. Am J Epidemiol 2007; 165:849-857.
6. Eriksson JG, Forsen T, Tuomilehto J, Winter PD, Osmond C, Barker DJ. Catch-up growth in childhood and death from coronary heart disease: longitudinal study. BMJ 1999; 318:427-431. 7. Forsen T, Eriksson JG, Tuomilehto J, Osmond C, Barker DJ. Growth in utero and during childhood
among women who develop coronary heart disease: longitudinal study. BMJ 1999; 319:1403-1407.
8. Lucas A, Fewtrell MS, Cole TJ. Fetal origins of adult disease-the hypothesis revisited. BMJ 1999; 319:245-249.
9. Ravelli AC, van der Meulen JH, Michels RP, Osmond C, Barker DJ, Hales CN et al. Glucose tolerance in adults after prenatal exposure to famine. Lancet 1998; 351:173-177.
10. Lemons JA, Bauer CR, Oh W, Korones SB, Papile LA, Stoll BJ et al. Very low birth weight outcomes of the National Institute of Child health and human development neonatal research network, January 1995 through December 1996. NICHD Neonatal Research Network. Pediatrics 2001; 107:E1.
11. Bertino E, Coscia A, Mombro M, Boni L, Rossetti G, Fabris C et al. Postnatal weight increase and growth velocity of very low birthweight infants. Arch Dis Child Fetal Neonatal Ed 2006; 91:F349-F356.
12. Hovi P, Andersson S, Eriksson JG, Jarvenpaa AL, Strang-Karlsson S, Makitie O et al. Glucose regulation in young adults with very low birth weight. N Engl J Med 2007; 356:2053-2063. 13. Trebar B, Traunecker R, Selbmann HK, Ranke MB. Growth during the first two years predicts
pre-school height in children born with very low birth weight (VLBW): results of a study of 1,320 children in Germany. Pediatr Res 2007; 62:209-214.
14. Saigal S, Stoskopf B, Streiner D, Paneth N, Pinelli J, Boyle M. Growth trajectories of extremely low birth weight infants from birth to young adulthood: a longitudinal, population-based study. Pediatr Res 2006; 60:751-758.
15. Bracewell MA, Hennessy EM, Wolke D, Marlow N. The EPICure study: Growth and blood pressure at 6 years of age following extremely preterm birth. Arch Dis Child Fetal Neonatal Ed 2007. 16. Hofman PL, Regan F, Cutfield WS. Prematurity--another example of perinatal metabolic
programming? Horm Res 2006; 66:33-39.
17. Irving RJ, Belton NR, Elton RA, Walker BR. Adult cardiovascular risk factors in premature babies. Lancet 2000; 355:2135-2136.
18. Slattery MM, Morrison JJ. Preterm delivery. Lancet 2002; 360:1489-1497.
20. Keijzer-Veen MG, Finken MJ, Nauta J, Dekker FW, Hille ET, Frolich M et al. Is blood pressure increased 19 years after intrauterine growth restriction and preterm birth? A prospective follow-up study in The Netherlands. Pediatrics 2005; 116:725-731.
21. Keijzer-Veen MG, Kleinveld HA, Lequin MH, Dekker FW, Nauta J, de Rijke YB et al. Renal function and size at young adult age after intrauterine growth restriction and very premature birth. Am J Kidney Dis 2007; 50:542-551.
22. Finken MJ, Dekker FW, de Zegher F, Wit JM. Long-term height gain of prematurely born children with neonatal growth restraint: parallellism with the growth pattern of short children born small for gestational age. Pediatrics 2006; 118:640-643.
23. Finken MJ, Inderson A, van Montfoort N, Keijzer-Veen MG, van Weert AW, Carfil N et al. Lipid profile and carotid intima-media thickness in a prospective cohort of very preterm subjects at age 19 years: effects of early growth and current body composition. Pediatr Res 2006; 59:604-609. 24. Keijzer-Veen MG, Kleinveld HA, Lequin MH, Dekker FW, Nauta J, de Rijke YB et al. Renal function
and size at young adult age after intrauterine growth restriction and very premature birth. Am J Kidney Dis 2007; 50:542-551.
25. Finken MJ, Keijzer-Veen MG, Dekker FW, Frolich M, Walther FJ, Romijn JA et al. Antenatal glucocorticoid treatment is not associated with long-term metabolic risks in individuals born before 32 weeks of gestation. Arch Dis Child Fetal Neonatal Ed 2008.
26. Holmen J, Midthjell K, Krüger Ø., Langhammer A., Holmen T.L., Bratberg G.H. et al. The Nord-Trøndelag Health Study 1995-97 (HUNT 2): Objectives, contents, methods and participation. Norsk Epidemiologi 2003 2006; 13:19-32.
2
Growth of preterm born children
A.M. Euser C.C. de Wit M.J.J. Finken M. Rijken J.M. Wit
A.M. Euser and C.C. de Wit contributed equally to this work.
Abstract
Background
In this review, we describe the growth of (very) preterm infants or (very) low-birth-weight infants from birth until adulthood.
Methods
A systematic analysis of growth of these infants is thwarted by different definitions (classification by gestational age or birth weight) used in the literature.
Results
The early postnatal period of these individuals is almost invariably characterized by substantial growth failure. In the majority of preterm infants this is followed by a period of catch-up growth, which starts in early infancy and usually stops at 2–3 years of age, although in some cases it may continue into adolescence. Catch-up growth is usually incomplete, so that infants born preterm remain shorter and lighter than term-born peers during childhood, adolescence, and adulthood. Disproportionate catch-up growth in height and weight may lead to an altered body composition in adulthood, especially in females.
Conclusion
Growth of preterm born children
17
Introduction
Based on a systematic review of the literature the definitions and determinants of prematurity, prenatal growth, reference charts for preterm born infants, early postnatal growth of the preterm infant, catch-up growth, and growth in childhood, adolescence and adulthood size are discussed, followed by a brief review of late metabolic consequences.
Methods
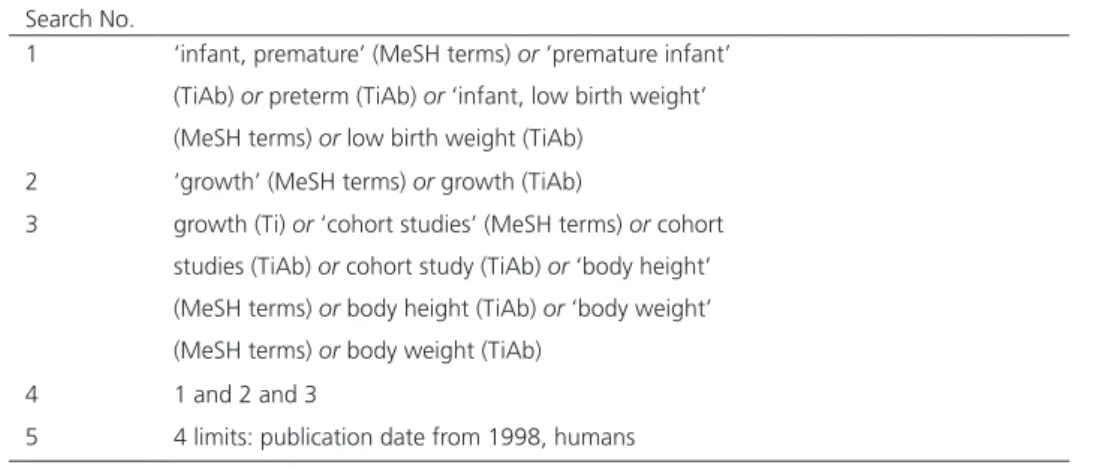
We conducted a systematic literature search in PubMed of articles published between 1998 and October 2007. Our search strategy is shown in table 1. Relevant articles were selected on title and abstract. We primarily focused on original research conducted in the past 10 years in humans and written in English. Additional articles were sought by checking the reference lists of the included articles. Recent review articles that provided comprehensive overviews were also included. For the present paper, we selected approximately 50% of the encountered articles; a full list can be obtained from the authors.
Table 1. Search strategy for PubMed
Search No.
1 ‘infant, premature’ (MeSH terms) or ‘premature infant’ (TiAb) or preterm (TiAb) or ‘infant, low birth weight’ (MeSH terms) or low birth weight (TiAb)
2 ‘growth’ (MeSH terms) or growth (TiAb)
3 growth (Ti) or ‘cohort studies’ (MeSH terms) or cohort studies (TiAb) or cohort study (TiAb) or ‘body height’ (MeSH terms) or body height (TiAb) or ‘body weight’ (MeSH terms) or body weight (TiAb)
4 1 and 2 and 3
5 4 limits: publication date from 1998, humans
Definitions
Preterm birth is defined by the estimated gestational age as a proxy of maturity. Three subgroups are distinguished by the World Health Organisation (WHO): preterm (< 37 weeks
gestation), very preterm (< 32 weeks), and extremely preterm (< 28 weeks).1 In the United
generally used. Low birth weight infants are defined as those with a birth weight of 2,500 g or less, which may be due to prematurity, being born small for gestational age (SGA), or both. Similarly, lower cut-off limits for weight have been used to describe more severe cases, i.e. very
low birth weight (VLBW < 1,500 g)2,3 and extremely low birth weight (ELWB < 1,000 g).4 In
very preterm and/or VLBW infants, gestational age is a better predictor of short-term survival
than birth weight.5 The decision about which parameter is applied to define a cohort of small
infants has considerable consequences for the characteristics of the population studied.
Determinants of prematurity and low birth weight
Determinants of prematurity
Various risk factors have been consistently associated with premature birth, such as multiple pregnancy, low socioeconomic status, African-American origin, second teenage pregnancy, parity and past reproductive history, substance misuse, infection and hypertensive disease
during pregnancy.6 Approximately 14% of the variation in gestational age is explained
by maternal genetic factors, and 11% by fetal genetic factors.7 The effect of specific
polymorphisms in the foetus, e.g. in genes encoding immunologic or haemostatic proteins,
seems to be modest compared to maternal risk factors.8
Determinants of a low birth weight for gestational age
The risk factors for SGA are usually divided into foetal, placental, and maternal factors, the
latter including maternal age, height, and parity,9 for details see.10 Foetal genetic factors
explained 31% of the normal variation in birth weight and birth length and 27% of the variation in head circumference; maternal genetic factors explained 22% of the variation in
birth weight, and 19% of the variation in birth length and head circumference.7 One of the
foetal genes involved may be insulin, as polymorphisms in its promoter are associated with
size at birth.10 Paternally and maternally imprinted genes oppose each other in the regulation
of foetal growth and development, illustrated by observations that genomic imprinting of the IGF-II gene has a considerable effect on foetoplacental development and thus delivery
of nutrients to the foetus.10 Although the variation in birth weight may be mainly caused by
differences in growth in the third trimester, there is recent evidence that both the growth trajectory of the fetus and its adaptive responses to the prenatal and postnatal environment
Growth of preterm born children
19
Prenatal growth
SGA
At birth, the newborn can have an appropriate weight and/or length for gestational age (AGA), be small for gestational age in weight and/or length (SGA), or large for gestational age
(LGA).13 Ideally, the cut-off limit for SGA should best discriminate between infants who are
at high risk of short-term and long-term growth impairment, disease, and death, and those
who are at a low risk.14 However, in practice there are various cut-off limits based on arbitrary
statistical criteria. Among paediatric endocrinologists there is consensus that a birth weight
and/or length of < –2 SDS should be the cut-off value.9,15 Neonatologists tend to use the 5th
or 10th percentile for gestational age,16 since these cut-offs are related to later developmental
problems.
Within the SGA population, three subgroups can be distinguished; infants with a low weight but normal length for gestational age (SGA W or SWGA), infants with a low length but normal weight for gestational age (SGA L or SLGA), and infants with the combination of both (SGA
LW or SLWGA).17,18 The growth patterns of the three subgroups are somewhat different17,19
and SLWGA males have on average a poorer neurologic outcome than those born SWGA but
not SLGA.20
We have previously argued that the third auxological parameter that should be measured at birth is head circumference. SGA H or SHGA could be added to the nomenclature to indicate
a small head circumference for gestational age,21 which is indicative for early intrauterine
growth retardation or, in extreme cases, for a decreased biological effect of IGF-1 due to
primary IGF-I deficiency or resistance.22
SGA versus IUGR
Formerly, the terms SGA and intrauterine growth restriction (IUGR) were used for the same condition, but nowadays there is consensus that the term IUGR should be limited to the process of decreased intrauterine growth rate detected by – preferably several – ultrasound
measurements.9,15 If prolonged and/or severe enough, this may lead to the delivery of an SGA
infant. SGA refers only to the condition at birth.15,18,21 When the prenatal growth pattern is
unknown, SGA may be regarded as a proxy for IUGR.14
References and standards for birth size for gestational age
For the classification of prematurity, a reliable estimate of gestational age is necessary. This is usually performed by combining information on the last menstrual period, and early
ultrasound assessment,2 but neither is perfectly reliable.23 It is noteworthy that according to
international recommendations gestational age is expressed in complete weeks,24,25 while in
the frequently used reference of Usher and McLean gestational age was calculated to the
nearest week from the last normal menstrual period.26 In the former approach, the reference
For the classification of SGA (or LGA) versus AGA, anthropometric data are compared with reference charts for gestational age. Ideally, up-to-date reference data from the same or a
similar population are required.14 The choice of the reference population has a considerable
impact on the classification, especially for preterm infants.27
Currently used neonatal charts differ substantially, and there are essentially four types of diagrams:
(1) Most reference charts are based on the birth size of all newborns in a certain area or
country and are presented separately for boys and girls. The American charts (by Lubchenco28,29
and later by Usher and McLean26) are based on small samples (so that combined charts for
males and females were prepared) and it was shown recently that both are inaccurate for use
in current populations in the US.30 For Northern European countries the Swedish reference is
most appropriate.24,31
(2) In some countries separate reference charts are used for primipara and multipara mothers,
and for different ethnic groups.32
(3) Conditional, customized charts are based on various conditions with a known impact on
birth weight weighted in a computer model in order to calculate the degree of normality.33 On
top of adjustments for foetal sex, gestational age and parity, additional adjustments are made for a number of characteristics such as maternal height, weight at first antenatal clinic visit,
ethnic group,34 maternal birth weight and birth weight of previous siblings.35 These charts are
primarily used by obstetricians.
(4) ‘Standard’ charts are based on intrauterine growth measurements in babies subsequently
born at term, from which birth weight is calculated.36 While these charts have a high sensitivity
in detecting a neonate with a growth anomaly, calculating body weight from ultrasound measurements leads to an inevitable loss of precision, so that many centres continue to use
regular reference charts based on birth weight data.37
Early postnatal growth
In the first weeks of extra-uterine life, (very) preterm infants often develop cumulative energy
and protein deficits, despite caloric and protein supplements at recommended intakes.38 Even
with active regimens of parenteral and/or early enteral feeding,39 this causes on average a
substantial postnatal growth failure, with growth curves that are sharply deviating from the
reference data.40-44
The typical growth pattern is an initial postnatal weight loss (the lowest weight is reached at the fourth to seventh day), followed by an early neonatal peak in growth velocity mimicking in utero growth rates beginning in the second week of life. Birth weight is usually regained in the period between the 8th to the 24th day of life, but earlier in infants with higher birth
Growth of preterm born children
21
postmenstrual age,42 and have an average weight at 40 weeks postmenstrual age of -2.6
SDS.46 In cohorts based on a low birth weight, the relatively high proportion of SGA infants
has a negative effect on growth outcome While weight is the most documented auxological parameter during these first weeks, also extra-uterine growth restriction with regard to length
and head circumference is common.43
Although preterm infants are usually lighter and shorter at 40 weeks after the last menstrual period than term born infants, no difference in total adiposity was found. Moreover, preterm infants had an altered fat distribution, with a decrease in subcutaneous fat and an increase in
intra-abdominal adipose tissue47 At 1 year of age, still a slightly greater fat mass normalized
for weight was found in infants born < 34 weeks of gestation.48
Factors influencing early growth
Preterm infants are often admitted to a Neonatal Intensive Care Unit (NICU), and face the consequences of unintended postnatal life such as respiratory distress syndrome, bronchopulmonary dysplasia, necrotizing enterocolitis, and infections, with concomitant treatment regimens of, e.g., mechanical ventilation, parenteral nutrition, and administration
of steroids.43,49 Both illness severity and clinical practice in treatment and nutrition vary widely
between infants and between NICUs as well.50,51
A low birth weight and gestational age,43,44 postnatal dexamethasone,43,49 a long duration of
respiratory support,49 pulmonary and circulatory problems,44 severity of illness,45 infections ,43,44
NEC,43,44 and male sex43 have been negatively associated with early postnatal growth. On
a biological level, an important mediator of the early postnatal growth in preterm infants
may be IGF-1.52,53 Not surprisingly, a very important factor that has been positively related to
growth in early life is caloric intake.38,49,54
Postnatal growth references
The non-physiological situation of preterm birth makes it difficult to provide appropriate postnatal growth references in order to distinguish postnatal growth failure from growth that is normal for this specific group. Separate growth references for infants with parenteral and/or
early nutrition have been suggested,39,55 but generally the charts of birth weight, length and
head circumference for gestational age are used. Postnatal growth failure has been defined
as weight below the 10th centile at 36 weeks corrected gestational age,41 or as a decrease
in z-score of 1 > 2 between birth and 36 weeks corrected gestational age.56 We have coined
the term ‘preterm growth restraint’ (PGR) to indicate poor growth in the third trimester, either spent in utero (the term born SGA infant ) or ex utero (the preterm born infant with a normal
Catch-up growth
Catch-up growth
Catch-up growth is usually defined as reaching an SD score of 1 > -2 SDS of the reference
population,9 but in other studies a change 1 > 0.67 SD has been used as cut-off.58 Similar
to term infants born SGA, most preterm born infants (approximately 80%) show catch-up
growth in weight, length and head circumference after initial postnatal growth failure,59-62
generally starting early in the first months of life and often achieved within the first 2 years of
life.59-61,63,64 However, late catch-up growth of preterm subjects has been described throughout
childhood61,62 and even in adolescence.65-67
It is generally considered that catch-up growth in weight, length, and particularly in head
circumference is important for neurodevelopmental outcome.68-70 Motor impairment was less
common if preterm infants were fed an enriched preterm formula in comparison to a regular
term formula in the first month after birth,71 especially in males.72 However, on average
adolescents born very preterm have decreased brain volumes compared to term controls.73
Determinants of catch-up growth
Little is known about the factors that determine if catch-up growth occurs in preterm infants and whether it is complete. Also for term born SGA infants these questions have not been
fully elucidated, but birth length and target height,74 a lower serum leptin, lower birth weight,
early weaning from the ventilator and plasma IGF-I are associated with catch-up growth in
weight.75,76
In preterm infants early growth and genetic potential as reflected by parental height seem important for catchup growth in height as well, though this effect might be different for
different durations of gestation.61,62,66,77,78 Examples of specific genetic polymorphisms that
have both been related to increased postnatal catch-up growth in preterm infants are the
d3-isoform polymorphism of the growth hormone receptor gene,79 and the R23K polymorphism
in the glucocorticoid receptor gene.80
Recently, a prediction model was presented on growth of a cohort of very low birth weight survivors. The following factors explained height SDS at 5 years: height SDS at 1 year,
mid-parental height SDS, 1st year weight SDS, and birth weight SDS.61 We have shown that
infants born very preterm who reach the normal range for length (1 > -2 SDS) at 3 months post-term display a virtually normal growth pattern in childhood, adolescence and adulthood, but infants who do not catch up (labelled pre-term growth restraint, PGR) show a similar growth pattern as term born SGA babies. In approximately 10% of them length remains
below the –2 SDS line.64 Most studies have shown that postnatal corticosteroid treatment has
a negative effect on postnatal catch-up,63,81,82 but others did not find such effect.60,83-85 Other
factors that have been negatively related to later (catch-up) growth in preterm infants include
Growth of preterm born children
23
Growth and body composition
Growth in childhood
With respect to growth in early and mid-childhood, the general pattern reported is that despite catch-up growth (if defined by reaching a height within the normal range) and a
steady increase in SDS or z-score for all anthropometric measurements,60,61,88 both male and
female infants born preterm remain smaller and lighter with a smaller head circumference
than their term-born or normal birth weight peers,61,65,77,88 particularly if they were born
SGA59-62,87,89 (table 2, page xx). The data in table 2, collected from recent studies, however,
indicate that there is likely to be a trend towards normal height and weight after a decrease in z-scores in the first years of life. Only one study reported that preterm infants born < 29 weeks of gestation as a group reached normal weight, height, and weight for height before
puberty.90 With regard to body composition in infancy, a reduced fat mass when normalized
for height at age 8-12 years was observed in children born < 37 weeks of gestation.91
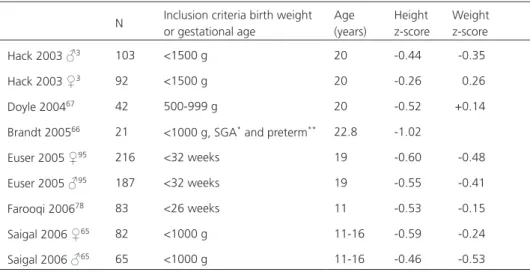
Growth in adolescence and adulthood
In studies describing growth of preterm infants reaching adolescence ( table 3 ), puberty has not always been accurately reported. This complicates a comparison between studies, as
puberty has an important effect on growth velocity.77 Studies reporting puberty have shown no
difference in the timing of puberty between preterm born adolescents and term controls.3,65,67
In adolescence, upwards percentile crossing has been reported,65-67,92,93 but adolescents born
preterm generally continue to be shorter in puberty than term born controls.65,78
N Inclusion criteria birth weight or gestational age
Age (years)
Height z-score
Weight z-score Hack 2003 ♂3 103 <1500 g 20 -0.44 -0.35
Hack 2003 ♀3 92 <1500 g 20 -0.26 0.26
Doyle 200467 42 500-999 g 20 -0.52 +0.14
Brandt 200566 21 <1000 g, SGA* and preterm** 22.8 -1.02
Euser 2005 ♀95 216 <32 weeks 19 -0.60 -0.48
Euser 2005 ♂95 187 <32 weeks 19 -0.55 -0.41
Farooqi 200678 83 <26 weeks 11 -0.53 -0.15
Saigal 2006 ♀65 82 <1000 g 11-16 -0.59 -0.24
Saigal 2006 ♂65 65 <1000 g 11-16 -0.46 -0.53
Table 3. Growth of preterm and LBW infants in puberty and adulthood
* SGA as defined <10th percentile for height and/or weight
Table 2.
Early postnatal and childhood gr
owth of pr
eterm, L
WB, VLBW and ELBW infants
N
Inclusion criteria birth weight/ gestational age Mean gestational age (wks) Mean birth weight (g) Mean birth weight SDS
Per
centage
SGA at birth
Measur e point Per centage gr owth failur e at measur e point Height z-scor e at measur e point W eight z-scor e at measur e point Fewtr ell 2000 77 765 ‘pr eterm’ &
< 1850 g
31.0
1364
18 months 7.5-8 years 9 to 12 years 0.91 -0.47 -0.44
Lemons 2001
4438 501-1500 g 22 a 36 weeks b 97 a
Niklasson 2003
90
52
<29 wks
28 wk 1180 27 wk 1015 ≤26 wk 720
40 weeks
b
6 months 3 years 7 years 19.2 5.8
c
-1.08 -1.70 -0.60 +0.09 -0.19 -1.73 -0.88 -0.02
Bertino 2006 45 262 500-1500 g 30.4 1140 -0.98 38.5 a 40 weeks b 100 d 2 years 100 e
Saigal 2006
♀ 65 82 <1000 g 27.2 838 28 a 1 year -1.04 -1.96 2 years -0.77 -1.68 8 years -0.94 -1.05
Saigal 2006
♂ 65 65 <1000 g 27.0 844 20 a 1 year -1.59 -2.49 2 years -0.92 -1.90 8 years -0.84 -1.05 Tr ebar 2007 61 1320
< 1500 g
29.17 1097 -1.16 55.3 a 1.8 years 13.3 c -0.69 -1.28 4.0 years 18.2 c -0.93 -1.32 6.1 years 11.1 c -0.62 -0.85
Hovi 2007 46
166
600-1500 g
29.17 ± 2.22
-1.29 ± 1.51
33.1
c
40 weeks
b
-2.6 ± -1.15
Bracewell 2007
88
241
<25
6
≤
23 wks + 0.70 ≤24 wks +0.37 ≤25 wks + 0.07
6 years -0.95 -1.18 a as defined <10
th per
centile for weight at birth b postmenstrual age c as defined <-2.0 SDS for weight and/or height d as defined < 3
rd per
centile
for
weight
e as defined < 25
th per
Growth of preterm born children
25 An increasing number of studies have reported data on adult height in preterm born individuals (table 3), but one should note that these studies only concern the very preterm and very or extremely low birth weight population, from which severely handicapped subjects are usually excluded. Growth data of individuals born preterm at a more advanced gestational age are scarce. Mean height of young adults born (very) preterm is shorter than that of term-born
controls65,67,94 and than target height.65 Again, preterm infants born SGA are at higher risk of
short stature, as only 46% of SGA-VLBW born young adults showed complete catch-up.66
Adult weight and body composition
Young adults born (very) preterm weigh less than the average population65 (6.5 and 7.1 kg for
males and females).65 However, catch-up for weight of individuals born preterm is generally
more pronounced than catchup in height (table 3). The mean BMI that has been reported in
young adulthood is close to that of the reference population in most studies,65,95 but lower94
and higher3,67 percentages of overweight have been reported, particularly in females.
One of the cohorts that has been followed up to young adulthood is the POPS cohort,
consisting of infants born very preterm and/or with a very low birth weight.95,96 In young
adulthood, the average height SDS was -0.55 and -0.60 for males and females respectively, but BMI SDS was -0.10 and -0.17, and waist circumference SDS +0.24 for males and even
+0.73 for females.95 This indicates that the altered fat distribution at term age noted in
preterm born infants might persist into adulthood, which might in turn contribute to a less
favourable cardiovascular disease risk profile.47,95
Late metabolic consequences of preterm birth
Since the original observations of Barker and collaborators,97-100 a wealth of studies have
shown an association between low birth weight and adult metabolic diseases like obesity, type 2 diabetes, hypertension and cardiovascular incidents. More recently, it has been shown that especially the combination of small size at birth followed by increased catch-up growth
in later life is detrimental for adult cardiovascular health.101-103 Although these findings have
been confirmed in animal studies, one should realize that in the human all ‘evidence’ results from epidemiological studies. The mechanism behind these associations has remained obscure
thus far.104,105 In the majority of the original publications, no clear distinction has been made
between low birth weight due to term SGA or due to preterm birth, and the number of preterm subjects included is very low.
It has been speculated that individuals born preterm experience similar metabolic consequences
in adult life as term born individuals with low birth weight.106,107 The third trimester is a critical
developmental period, and malnutrition during this time span has been related to reduced
adult glucose tolerance in the Dutch famine studies.108 Infants born preterm almost invariably
Table 2.
Early postnatal and childhood gr
owth of pr
eterm, L
WB, VLBW and ELBW infants
N
Inclusion criteria birth weight/ gestational age Mean gestational age (wks) Mean birth weight (g) Mean birth weight SDS
Per
centage
SGA at birth
Measur e point Per centage gr owth failur e at measur e point Height z-scor e at measur e point W eight z-scor e at measur e point Fewtr ell 2000 77 765 ‘pr eterm’ &
< 1850 g
31.0
1364
18 months 7.5-8 years 9 to 12 years 0.91 -0.47 -0.44
Lemons 2001
4438 501-1500 g 22 a 36 weeks b 97 a
Niklasson 2003
90
52
<29 wks
28 wk 1180 27 wk 1015 ≤26 wk 720
40 weeks
b
6 months 3 years 7 years 19.2 5.8
c
-1.08 -1.70 -0.60 +0.09 -0.19 -1.73 -0.88 -0.02
Bertino 2006 45 262 500-1500 g 30.4 1140 -0.98 38.5 a 40 weeks b 100 d 2 years 100 e
Saigal 2006
♀ 65 82 <1000 g 27.2 838 28 a 1 year -1.04 -1.96 2 years -0.77 -1.68 8 years -0.94 -1.05
Saigal 2006
♂ 65 65 <1000 g 27.0 844 20 a 1 year -1.59 -2.49 2 years -0.92 -1.90 8 years -0.84 -1.05 Tr ebar 2007 61 1320
< 1500 g
29.17 1097 -1.16 55.3 a 1.8 years 13.3 c -0.69 -1.28 4.0 years 18.2 c -0.93 -1.32 6.1 years 11.1 c -0.62 -0.85
Hovi 2007 46
166
600-1500 g
29.17 ± 2.22
-1.29 ± 1.51
33.1
c
40 weeks
b
-2.6 ± -1.15
Bracewell 2007
88
241
<25
6
≤
23 wks + 0.70 ≤24 wks +0.37 ≤25 wks + 0.07
6 years -0.95 -1.18 a as defined <10
th per
centile for weight at birth b postmenstrual age c as defined <-2.0 SDS for weight and/or height d as defined < 3
rd per
centile
for
weight
e as defined < 25
th per
experience postnatal growth failure during this time window, often followed by later catch-up growth. Evidence for this similarity in adverse metabolic sequelae in adulthood between term SGA infants and infants born preterm mostly results from studies on glucose tolerance and blood pressure during childhood and young adulthood in preterm or VLBW survivors
(recently reviewed by Hofman et al.106). Both in the neonatal period109 and in childhood,110,111
individuals born (very) preterm have a decreased insulin tolerance.
Survivors of preterm birth are still too young to allow for studying the effect on full-blown cardiovascular disease, and studies are limited to early markers of cardiovascular disease in young adulthood. In a recent study, glucose tolerance was reduced in a cohort of VLBW young
adults,46 and in the POPS study we found that insulin sensitivity at 19 years of age in individuals
born very preterm was particularly decreased if BMI in young adulthood was relatively high.112
No associations were observed between early growth and intima-media thickness.113 With
respect to blood pressure, we found an increased incidence of hypertension and borderline
hypertension,114 in accordance with other studies,115,116 irrespective of nephrocalcinosis.117
Conclusion
Individuals born preterm usually show a substantial growth failure in the early postnatal period, which is usually followed by catch-up growth over 2–3 years, but a slightly lower mean adult height than term born peers. Although catch-up growth is beneficial for neurodevelopmental outcome, it might lead to adverse metabolic consequences in adulthood. Future follow-up studies on these effects are warranted.
Acknowledgements
Growth of preterm born children
27
References
1. International Classification of Diseases (ICD) 10, WHO www.who.int/classifications/icd/en/ retreived 2007.
2. Sherry B, Mei Z, Grummer-Strawn L, Dietz WH. Evaluation of and recommendations for growth references for very low birth weight (< or =1500 grams) infants in the United States. Pediatrics 2003; 111:750-758.
3. Hack M, Schluchter M, Cartar L, Rahman M, Cuttler L, Borawski E. Growth of very low birth weight infants to age 20 years. Pediatrics 2003; 112:e30-e38.
4. Valcamonico A, Accorsi P, Sanzeni C, Martelli P, La BP, Cavazza A et al. Mid- and long-term outcome of extremely low birth weight (ELBW) infants: an analysis of prognostic factors. J Matern Fetal Neonatal Med 2007; 20:465-471.
5. Verloove P, Verwey RA, Brand R, Keirse MJ. Importance of gestational age. Lancet 1986; 1:1494.
6. Slattery MM, Morrison JJ. Preterm delivery. Lancet 2002; 360:1489-1497.
7. Lunde A, Melve KK, Gjessing HK, Skjaerven R, Irgens LM. Genetic and environmental influences on birth weight, birth length, head circumference, and gestational age by use of population-based parent-offspring data. Am J Epidemiol 2007; 165:734-741.
8. DeFranco E, Teramo K, Muglia L. Genetic influences on preterm birth. Semin Reprod Med 2007; 25:40-51.
9. Lee PA, Chernausek SD, Hokken-Koelega AC, Czernichow P. International Small for Gestational Age Advisory Board consensus development conference statement: management of short children born small for gestational age, April 24-October 1, 2001. Pediatrics 2003; 111:1253-1261.
10. Saenger P, Czernichow P, Hughes I, Reiter EO. Small for gestational age: Short stature and beyond. Endocrine Reviews 2007; 28:219-251.
11. Smith GC, Smith MF, McNay MB, Fleming JE. First-trimester growth and the risk of low birth weight. N Engl J Med 1998; 339:1817-1822.
12. Bukowski R, Smith GC, Malone FD, Ball RH, Nyberg DA, Comstock CH et al. Fetal growth in early pregnancy and risk of delivering low birth weight infant: prospective cohort study. BMJ 2007; 334:836.
13. Battaglia FC, Lubchenco LO. A practical classification of newborn infants by weight and gestational age. J Pediatr 1967; 71:159-163.
14. Bertino E, Milani S, Fabris C, De CM. Neonatal anthropometric charts: what they are, what they are not. Arch Dis Child Fetal Neonatal Ed 2007; 92:F7-F10.
15. Clayton PE, Cianfarani S, Czernichow P, Johannsson G, Rapaport R, Rogol A. Management of the child born small for gestational age through to adulthood: a consensus statement of the International Societies of Pediatric Endocrinology and the Growth Hormone Research Society. J Clin Endocrinol Metab 2007; 92:804-810.
16. Anderson M.S., Hay Jr W.W. Intrauterine grwoth restriction and the small for gestational age infant. In: Avery G.B., Fletcher M.A., MacDonald M.G., editors. Neonatology. 5th ed. Philadelphia-London: Lippincott, Williams & Wilkins; 1999. 411.
17. Karlberg J, Albertsson-Wikland K. Growth in full-term small-for-gestational-age infants: from birth to final height. Pediatr Res 1995; 38:733-739.
18. Laron Z, Mimouni F. Confusion around the definition of small for gestational age (SGA). Pediatr Endocrinol Rev 2005; 2:364-365.
20. Lundgren EM, Cnattingius S, Jonsson B, Tuvemo T. Intellectual and psychological performance in males born small for gestational age with and without catch-up growth. Pediatr Res 2001; 50:91-96.
21. Wit JM, Finken MJ, Rijken M, Walenkamp MJ, Oostdijk W, Veen S. Confusion around the definition of small for gestational age. Pediatr Endocrinol Rev 2005; 3:52-53.
22. Walenkamp MJ, Wit JM. Genetic disorders in the growth hormone - insulin-like growth factor-I axis. Horm Res 2006; 66:221-230.
23. Savitz DA, Terry JW, Jr., Dole N, Thorp JM, Jr., Siega-Riz AM, Herring AH. Comparison of pregnancy dating by last menstrual period, ultrasound scanning, and their combination. Am J Obstet Gynecol 2002; 187:1660-1666.
24. Niklasson A, Ericson A, Fryer JG, Karlberg J, Lawrence C, Karlberg P. An update of the Swedish reference standards for weight, length and head circumference at birth for given gestational age (1977-1981). Acta Paediatr Scand 1991 Aug -Sep 1991;756-762.
25. Kramer MS, Platt RW, Wen SW, Joseph KS, Allen A, Abrahamowicz M et al. A new and improved population-based Canadian reference for birth weight for gestational age. Pediatrics 2001; 108:E35.
26. Usher RH, McLean FH. Intrauterine growth of live-born Caucasiaon infants at sea level: standards obtained from measurements in 7 dimensions of infants born between 25 and 44 weeks of gestation. Journal of Pediatrics 1969; 74:901-910.
27. Hemming K, Hutton JL, Glinianaia SV, Jarvis SN, Platt MJ. Differences between European birthweight standards: impact on classification of ‘small for gestational age’. Dev Med Child Neurol 2006; 48:906-912.
28. Lubchenco LO, HANSMAN C, DRESSLER M, BOYD E. interauterine growth as estimated from liveborn birth-weight data at 24 to 40 weeks of gestation. Pediatrics 1963; 32:793-800. 29. Lubchenco LO, HANSMAN C, BOYD E. Intrauterine growth in length and head circumference
as estimated from live births at gestational ages from 26 to 42 weeks. Pediatrics 1966; 37:403-408.
30. Thomas P, Peabody J, Turnier V, Clark RH. A new look at intrauterine growth and the impact of race, altitude, and gender. Pediatrics 2000; 106:E21.
31. Niklasson A, bertsson-Wikland K. Continuous growth reference from 24th week of gestation to 24 months by gender. BMC Pediatr 2008; 8:8.
32. Kloosterman GJ. On intrauterine grwoth. The significance of prenatal care. Int J Gynaecol Obstet 1970; 8:895-912.
33. Gardosi J, Chang A, Kalyan B, Sahota D, Symonds EM. Customised antenatal growth charts. Lancet 1992; 339:283-287.
34. De Jong CL, Francis A, Van Geijn HP, Gardosi J. Customized fetal weight limits for antenatal detection of fetal growth restriction. Ultrasound Obstet Gynecol 2000; 15:36-40.
35. McCowan LM, Harding JE, Stewart AW. Customized birthweight centiles predict SGA pregnancies with perinatal morbidity. BJOG 2005; 112:1026-1033.
36. Cooke RW. Conventional birth weight standards obscure fetal growth restriction in preterm infants. Arch Dis Child Fetal Neonatal Ed 2007; 92:F189-F192.
37. Ehrenkranz RA. Estimated fetal weights versus birth weights: should the reference intrauterine growth curves based on birth weights be retired? Arch Dis Child Fetal Neonatal Ed 2007; 92:F161-F162.
38. Embleton NE, Pang N, Cooke RJ. Postnatal malnutrition and growth retardation: an inevitable consequence of current recommendations in preterm infants? Pediatrics 2001; 107:270-273. 39. Pauls J, Bauer K, Versmold H. Postnatal body weight curves for infants below 1000 g birth
Growth of preterm born children
29
40. Ehrenkranz RA, Younes N, Lemons JA, Fanaroff AA, Donovan EF, Wright LL et al. Longitudinal growth of hospitalized very low birth weight infants. Pediatrics 1999; 104:280-289.
41. Ehrenkranz RA. Growth outcomes of very low-birth weight infants in the newborn intensive care unit. Clin Perinatol 2000; 27:325-345.
42. Lemons JA, Bauer CR, Oh W, Korones SB, Papile LA, Stoll BJ et al. Very low birth weight outcomes of the National Institute of Child health and human development neonatal research network, January 1995 through December 1996. NICHD Neonatal Research Network. Pediatrics 2001; 107:E1.
43. Clark RH, Thomas P, Peabody J. Extrauterine growth restriction remains a serious problem in prematurely born neonates. Pediatrics 2003; 111:986-990.
44. Marks KA, Reichman B, Lusky A, Zmora E. Fetal growth and postnatal growth failure in very-low-birthweight infants. Acta Paediatrica 2006; 95:236-242.
45. Bertino E, Coscia A, Mombro M, Boni L, Rossetti G, Fabris C et al. Postnatal weight increase and growth velocity of very low birthweight infants. Arch Dis Child Fetal Neonatal Ed 2006; 91:F349-F356.
46. Hovi P, Andersson S, Eriksson JG, Jarvenpaa AL, Strang-Karlsson S, Makitie O et al. Glucose regulation in young adults with very low birth weight. N Engl J Med 2007; 356:2053-2063. 47. Uthaya S, Thomas EL, Hamilton G, Dore CJ, Bell J, Modi N. Altered adiposity after extremely
preterm birth. Pediatr Res 2005; 57:211-215.
48. Cooke RJ, Rawlings DJ, McCormick K, Griffin IJ, Faulkner K, Wells JC et al. Body composition of preterm infants during infancy. Arch Dis Child Fetal Neonatal Ed 1999; 80:F188-F191. 49. Berry MA, Conrod H, Usher RH. Growth of very premature infants fed intravenous
hyperalimentation and calcium-supplemented formula. Pediatrics 1997; 100:647-653. 50. Olsen IE, Richardson DK, Schmid CH, Ausman LM, Dwyer JT. Intersite differences in weight
growth velocity of extremely premature infants. Pediatrics 2002; 110:1125-1132.
51. Blackwell MT, Eichenwald EC, McAlmon K, Petit K, Linton PT, McCormick MC et al. Interneonatal intensive care unit variation in growth rates and feeding practices in healthy moderately premature infants. J Perinatol 2005; 25:478-485.
52. Kajantie E, Dunkel L, Rutanen EM, Seppala M, Koistinen R, Sarnesto A et al. IGF-I, IGF binding protein (IGFBP)-3, phosphoisoforms of IGFBP-1, and postnatal growth in very low birth weight infants. J Clin Endocrinol Metab 2002; 87:2171-2179.
53. Ahmad I, Zaldivar F, Iwanaga K, Koeppel R, Grochow D, Nemet D et al. Inflammatory and growth mediators in growing preterm infants. J Pediatr Endocrinol Metab 2007; 20:387-396. 54. Vohr BR, McKinley LT. The challenge pays off: early enhanced nutritional intake for VLBW
small-for-gestation neonates improves long-term outcome. J Pediatr 2003; 142:459-461. 55. Diekmann M, Genzel-Boroviczeny O, Zoppelli L, von Poblotzki M. Postnatal growth curves for
extremely low birth weight infants with early enteral nutrition. Eur J Pediatr 2005; 164:714-723.
56. Shah PS, Wong KY, Merko S, Bishara R, Dunn M, Asztalos E et al. Postnatal growth failure in preterm infants: ascertainment and relation to long-term outcome. J Perinat Med 2006; 34:484-489.
57. Wit JM, Finken MJ, Rijken M, de Zegher F. Preterm growth restraint: a paradigm that unifies intrauterine growth retardation and preterm extrauterine growth retardation and has implications for the small-for-gestational-age indication in growth hormone therapy. Pediatrics 2006; 117:e793-e795.
59. Monset-Couchard M, de Bethmann O. Catch-up growth in 166 small-for- gestational age premature infants weighing less than 1,000 g at birth. Biol Neonate 2000; 78:161-167. 60. Jordan IM, Robert A, Francart J, Sann L, Putet G. Growth in extremely low birth weight infants
up to three years. Biol Neonate 2005; 88:57-65.
61. Trebar B, Traunecker R, Selbmann HK, Ranke MB. Growth during the first two years predicts pre-school height in children born with very low birth weight (VLBW): results of a study of 1,320 children in Germany. Pediatr Res 2007; 62:209-214.
62. Itabashi K, Mishina J, Tada H, Sakurai M, Nanri Y, Hirohata Y. Longitudinal follow-up of height up to five years of age in infants born preterm small for gestational age; comparison to full-term small for gestational age infants. Early Hum Dev 2007; 83:327-333.
63. Rijken M, Wit JM, Le Cessie S, Veen S. The effect of perinatal risk factors on growth in very preterm infants at 2 years of age: The Leiden Follow-Up Project on Prematurity. Early Hum Dev 2006.
64. Finken MJ, Dekker FW, de Zegher F, Wit JM. Long-term height gain of prematurely born children with neonatal growth restraint: parallellism with the growth pattern of short children born small for gestational age. Pediatrics 2006; 118:640-643.
65. Saigal S, Stoskopf B, Streiner D, Paneth N, Pinelli J, Boyle M. Growth trajectories of extremely low birth weight infants from birth to young adulthood: a longitudinal, population-based study. Pediatr Res 2006; 60:751-758.
66. Brandt I, Sticker EJ, Gausche R, Lentze MJ. Catch-up growth of supine length/height of very low birth weight, small for gestational age preterm infants to adulthood. J Pediatr 2005; 147:662-668.
67. Doyle LW, Faber B, Callanan C, Ford GW, Davis NM. Extremely low birth weight and body size in early adulthood. Arch Dis Child 2004; 89:347-350.
68. Ehrenkranz RA, Dusick AM, Vohr BR, Wright LL, Wrage LA, Poole WK. Growth in the neonatal intensive care unit influences neurodevelopmental and growth outcomes of extremely low birth weight infants. Pediatrics 2006; 117:1253-1261.
69. Hack M, Breslau N, Weissman B, Aram D, Klein N, Borawski E. Effect of very low birth weight and subnormal head size on cognitive abilities at school age. N Engl J Med 1991; 325:231-237.
70. Casey PH, Whiteside-Mansell L, Barrett K, Bradley RH, Gargus R. Impact of prenatal and/or postnatal growth problems in low birth weight preterm infants on school-age outcomes: an 8-year longitudinal evaluation. Pediatrics 2006; 118:1078-1086.
71. Lucas A, Morley R, Cole TJ, Gore SM, Lucas PJ, Crowle P et al. Early diet in preterm babies and developmental status at 18 months. Lancet 1990; 335:1477-1481.
72. Lucas A, Morley R, Cole TJ. Randomised trial of early diet in preterm babies and later intelligence quotient. BMJ 1998; 317:1481-1487.
73. Nosarti C, Al Asady MH, Frangou S, Stewart AL, Rifkin L, Murray RM. Adolescents who were born very preterm have decreased brain volumes. Brain 2002; 125:1616-1623.
74. Luo ZC, Albertsson-Wikland K, Karlberg J. Length and body mass index at birth and target height influences on patterns of postnatal growth in children born small for gestational age. Pediatrics 1998; 102:E72.
75. Amador-Licona N, Martinez-Cordero C, Guizar-Mendoza JM, Malacara JM, Hernandez J, Alcala JF. Catch-up growth in infants born small for gestational age--a longitudinal study. J Pediatr Endocrinol Metab 2007; 20:379-386.
Growth of preterm born children
31
77. Fewtrell MS, Cole TJ, Bishop NJ, Lucas A. Neonatal factors predicting childhood height in preterm infants: evidence for a persisting effect of early metabolic bone disease? J Pediatr 2000; 137:668-673.
78. Farooqi A, Hagglof B, Sedin G, Gothefors L, Serenius F. Growth in 10- to 12-year-old children born at 23 to 25 weeks’ gestation in the 1990s: a Swedish national prospective follow-up study. Pediatrics 2006; 118:e1452-e1465.
79. Schreiner F, Stutte S, Bartmann P, Gohlke B, Woelfle J. Association of the Growth Hormone Receptor d3-Variant and Catch-up Growth of Preterm Infants with Birth Weight less than 1500 grams. J Clin Endocrinol Metab 2007.
80. Finken MJ, Meulenbelt I, Dekker FW, Frolich M, Romijn JA, Slagboom PE et al. The 23K Variant of the R23K Polymorphism in the Glucocorticoid Receptor Gene Protects Against Postnatal Growth Failure and Insulin Resistance After Preterm Birth. J Clin Endocrinol Metab 2007. 81. Wood NS, Costeloe K, Gibson AT, Hennessy EM, Marlow N, Wilkinson AR. The EPICure study:
growth and associated problems in children born at 25 weeks of gestational age or less. Arch Dis Child Fetal Neonatal Ed 2003; 88:F492-F500.
82. Wang D, Vandermeulen J, Atkinson SA. Early life factors predict abnormal growth and bone accretion at prepuberty in former premature infants with/without neonatal dexamethasone exposure. Pediatr Res 2007; 61:111-116.
83. Romagnoli C, Zecca E, Luciano R, Torrioli G, Tortorolo G. A three year follow up of preterm infants after moderately early treatment with dexamethasone. Arch Dis Child Fetal Neonatal Ed 2002; 87:F55-F58.
84. Doyle LW, Davis PG, Morley CJ, McPhee A, Carlin JB. Outcome at 2 years of age of infants from the DART study: a multicenter, international, randomized, controlled trial of low-dose dexamethasone. Pediatrics 2007; 119:716-721.
85. Watterberg KL, Gerdes JS, Cole CH, Aucott SW, Thilo EH, Mammel MC et al. Prophylaxis of early adrenal insufficiency to prevent bronchopulmonary dysplasia: a multicenter trial. Pediatrics 2004; 114:1649-1657.
86. Hintz SR, Kendrick DE, Stoll BJ, Vohr BR, Fanaroff AA, Donovan EF et al. Neurodevelopmental and growth outcomes of extremely low birth weight infants after necrotizing enterocolitis. Pediatrics 2005; 115:696-703.
87. Gutbrod T, Wolke D, Soehne B, Ohrt B, Riegel K. Effects of gestation and birth weight on the growth and development of very low birthweight small for gestational age infants: a matched group comparison. Arch Dis Child Fetal Neonatal Ed 2000; 82:F208-F214.
88. Bracewell MA, Hennessy EM, Wolke D, Marlow N. The EPICure study: Growth and blood pressure at 6 years of age following extremely preterm birth. Arch Dis Child Fetal Neonatal Ed 2007.
89. Cutfield WS, Regan FA, Jackson WE, Jefferies CA, Robinson EM, Harris M et al. The endocrine consequences for very low birth weight premature infants. Growth Horm IGF Res 2004; 14 Suppl A:S130-S135.
90. Niklasson A, Engstrom E, Hard AL, Wikland KA, Hellstrom A. Growth in very preterm children: a longitudinal study. Pediatr Res 2003; 54:899-905.
91. Fewtrell MS, Lucas A, Cole TJ, Wells JC. Prematurity and reduced body fatness at 8-12 y of age. Am J Clin Nutr 2004; 80:436-440.
92. Ford GW, Doyle LW, Davis NM, Callanan C. Very low birth weight and growth into adolescence. Arch Pediatr Adolesc Med 2000; 154:778-784.
93. Hirata T, Bosque E. When they grow up: the growth of extremely low birth weight (< or = 1000 gm) infants at adolescence. J Pediatr 1998; 132:1033-1035.
95. Euser AM, Finken MJ, Keijzer-Veen MG, Hille ET, Wit JM, Dekker FW. Associations between prenatal and infancy weight gain and BMI, fat mass, and fat distribution in young adulthood: a prospective cohort study in males and females born very preterm. Am J Clin Nutr 2005; 81:480-487.
96. Qvigstad E, Verloove-Vanhorick SP, Ens-Dokkum MH, Schreuder AM, Veen S, Brand R et al. Prediction of height achievement at five years of age in children born very preterm or with very low birth weight: continuation of catch-up growth after two years of age. Acta Paediatr 1993; 82:444-448.
97. Barker DJ, Winter PD, Osmond C, Margetts B, Simmonds SJ. Weight in infancy and death from ischaemic heart disease. Lancet 1989; 2:577-580.
98. Schluchter MD. Publication bias and heterogeneity in the relationship between systolic blood pressure, birth weight, and catch-up growth--a meta analysis. J Hypertens 2003 Feb 1921;273-279.
99. Newsome CA, Shiell AW, Fall CH, Phillips DI, Shier R, Law CM. Is birth weight related to later glucose and insulin metabolism?--A systematic review. Diabet Med 2003 May 1920;339-348. 100. Harder T, Rodekamp E, Schellong K, Dudenhausen JW, Plagemann A. Birth weight and
subsequent risk of type 2 diabetes: A meta-analysis. American Journal of Epidemiology 2007; 165:849-857.
101. Eriksson JG, Forsen T, Tuomilehto J, Winter PD, Osmond C, Barker DJ. Catch-up growth in childhood and death from coronary heart disease: longitudinal study. BMJ 1999; 318:427-431.
102. Forsen T, Eriksson JG, Tuomilehto J, Osmond C, Barker DJ. Growth in utero and during childhood among women who develop coronary heart disease: longitudinal study. BMJ 1999; 319:1403-1407.
103. Lucas A, Fewtrell MS, Cole TJ. Fetal origins of adult disease-the hypothesis revisited. BMJ 1999; 319:245-249.
104. Hales CN, Barker DJP. Type-2 (On-Insulin-Dependent) Diabetes-Mellitus - the Thrifty Phenotype Hypothesis. Diabetologia 1992; 35:595-601.
105. Hattersley AT, Tooke JE. The fetal insulin hypothesis: an alternative explanation of the association of low birthweight with diabetes and vascular disease. Lancet 1999; 353:1789-1792. 106. Hofman PL, Regan F, Cutfield WS. Prematurity - Another example of perinatal metabolic
programming? Hormone Research 2006; 66:33-39.
107. Irving RJ, Belton NR, Elton RA, Walker BR. Adult cardiovascular risk factors in premature babies. Lancet 2000; 355:2135-2136.
108. Ravelli AC, van der Meulen JH, Michels RP, Osmond C, Barker DJ, Hales CN et al. Glucose tolerance in adults after prenatal exposure to famine. Lancet 1998; 351:173-177.
109. Mitanchez-Mokhtari D, Lahlou N, Kieffer F, Magny JF, Roger M, Voyer M. Both relative insulin resistance and defective islet beta-cell processing of proinsulin are responsible for transient hyperglycemia in extremely preterm infants. Pediatrics 2004; 113:537-541.
110. Regan FM, Cutfield WS, Jefferies C, Robinson E, Hofman PL. The impact of early nutrition in premature infants on later childhood insulin sensitivity and growth. Pediatrics 2006; 118:1943-1949.
111. Hofman PL, Regan F, Jackson WE, Jefferies C, Knight DB, Robinson EM et al. Premature birth and later insulin resistance. N Engl J Med 2004; 351:2179-2186.
Growth of preterm born children
33
113. Finken MJ, Inderson A, van Montfoort N, Keijzer-Veen MG, van Weert AW, Carfil N et al. Lipid profile and carotid intima-media thickness in a prospective cohort of very preterm subjects at age 19 years: effects of early growth and current body composition. Pediatr Res 2006; 59:604-609.
114. Keijzer-Veen MG, Finken MJ, Nauta J, Dekker FW, Hille ET, Frolich M et al. Is blood pressure increased 19 years after intrauterine growth restriction and preterm birth? A prospective follow-up study in The Netherlands. Pediatrics 2005; 116:725-731.
115. Doyle LW, Faber B, Callanan C, Morley R. Blood pressure in late adolescence and very low birth weight. Pediatrics 2003; 111:252-257.
116. Hack M, Schluchter M, Cartar L, Rahman M. Blood pressure among very low birth weight (< 1.5 kg) young adults. Pediatric Research 2005; 58:677-684.
3
A regression model with unexplained residuals was
preferred in the analysis of the fetal origins of adult
diseases hypothesis
M.G. Keijzer-Veen A.M. Euser N. van Montfoort F. W. Dekker J.P. Vandenbroucke H.C. van Houwelingen
Abstract
Background and objective
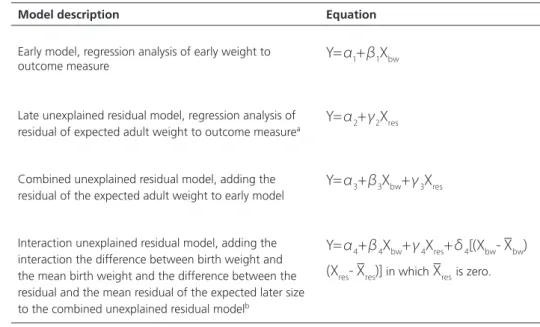
A continued controversy exists whether the assessment of the influence of low birth weight on adult blood pressure necessitates adjustment for adult weight in the analysis on the fetal origins of adult diseases hypothesis. Here we first explain the difficulty in understanding an adjusted multivariate regression model, and then propose another way of writing the regression model to make the interpretation of the separate influence of birth weight and changes in weight later in life more straightforward.
Study design and setting
We used a multivariate regression model containing birth weight (standard deviation score; SDS), and residual adult weight (SDS) to explore the effect on blood pressure (or any other outcome) separately. Residual adult weight was calculated as the difference between actual adult weight and the expected adult weight (SDS) given on a certain birth weight (SDS).
Results
The coefficients of birth weight and residual adult weight show directly the effect on the analyzed outcome variable.
Conclusions