Henk P. Stulp, Jurrijn Koelen, Annemiek Schep-Akkerman, Gerrit G. Glas and Liesbeth
Eurelings-Bontekoe
God representations and aspects of psychological
functioning: A meta-analysis
Henk P. Stulp1*, Jurrijn Koelen2, Annemiek Schep-Akkerman1,3, Gerrit G. Glas4and Liesbeth Eurelings-Bontekoe5
Abstract:
Context: Results of meta-analyses show weak associations between
religiosity and well-being, but are based on divergent definitions of religiosity.
Objective: The aim of this meta-analysis was to examine the magnitude of the
associations between God representations and aspects of psychological functioning.
Based on object-relations and attachment theory, the study discerns six dimensions
of God representations: Two positive affective God representations, three negative
affective God representations, and God control. Associations with well-being and
distress and with self-concept, relationships with others and neuroticism were
examined. Methods: The meta-analysis was based on 123 samples out of 112
primary studies with 348 effect sizes from in total 29,963 adolescent and adult
participants, with a vast majority adherent of a theistic religion. Results: The
ana-lyses, based on the random-effects model, yielded mostly medium effect sizes
(
r
= .25 to
r
= .30) for the associations of positive God representations with
well-being, and for the associations of two out of three negative God representations
with distress. Associations of God representations with self-concept, relationships
with others and neuroticism were of the same magnitude. Various moderator
variables could not explain the relatively high amount of heterogeneity. The authors
Henk P. Stulp
ABOUT THE AUTHOR
The author is a lecturer at a Dutch Christian uni-versity of applied sciences that trains students for work in the domains social work, pastoral work, nursing, and education. This article is the intro-duction of his PhD project about God represen-tations. The project is based on the“relational spirituality”approach that emphasizes the importance of the personally and emotionally experienced relationship with the Divine. Based on attachment theory and object-relations the-ory—two dominant theoretical frameworks in religion research—a central assumption of the project is the importance of implicit aspects of God representations. A measure for assessing implicit God representations, the Apperception Test God Representations (ATGR), has been developed. Aim of the project is the validation of this measure. Thereto, in a patient and
a nonpatient group, associations of implicit and explicit measures with measures of implicit and explicit distress and object-relational functioning, amongst others, are compared.
PUBLIC INTEREST STATEMENT
This meta-analysis demonstrates the importance of personal God representations for religious people who believe in a personal relationship with the God they believe in. It found that posi-tive God representations are most strongly related to wellbeing and negative God represen-tations most strongly to psychological distress. Subjects with negative God representations also have a more negative perception of self and others and are more susceptible to negative emotions, than subjects with positive God repre-sentations. Thereby it underlines that theoreti-cally God representations can be viewed as a special form of mental representations of relationships. This implies that patients with dis-turbed perceptions of self and others may also have difficulties in benefitting from the support most believers find in the relationship with their God. Results also may imply that therapy should not only focus on strengthening positive, but also on directly dealing with and transforming nega-tive God representations.
Received: 09 July 2018 Accepted: 20 July 2019 First Published: 26 July 2019
*Corresponding author: Henk P. Stulp, Viaa University of Applied Sciences, Grasdorpstraat 2, P.O. Box 10030 8000 GA Zwolle, The Netherlands
E-mail:[email protected];
Reviewing editor:
Sebastiano Costa, Universita degli Studi della Campania Luigi Vanvitelli, Italy
Additional information is available at the end of the article
between religiousness and well-being/mental health. Results demonstrate the
importance of focusing on God representations instead of on behavioral or rather
global aspects of religiosity. Several implications with respect to assessment, clinical
practice, and future research are discussed.
Subjects: Mental Health; Mental Health Research; Attachment Issues - Adult; Religion & Psychology
Keywords: meta-analysis; god representations; well-being; mental health; self-concept
During the last decades, there has been a significant increase in attention in scientific research for religion in the context of mental health. In mental health care, religion has long been thought to have a negative effect on health (Neeleman & Persaud,1995). This can be traced back to Sigmund Freud’s view that religion is a projection of an infantile need for an authoritative being that can function as a father figure (Freud, 2004). As a consequence, religion was supposed to have a predominantly negative influence on mental health because, according to this view, religion would be accompanied by many restrictive rules that lead to strong feelings of guilt and fear of punishment by an angry god. Other psychologists (Rizzuto,1979; Winnicott, 1971) have argued that religion may also have a positive influence on psychological functioning because believers may as well project positive attributes to their god. This can give them strength and may contribute to personal growth.
Although convincing evidence—as presented below—exists for the association between religi-osity and well-being/mental health, not much is known yet about the underlying mechanisms that explain this relation. More insight is needed, and this is especially important for health profes-sionals working with religious/spiritual patients. It might contribute to the development of inter-ventions that may strengthen the potential positive influences of religion/spirituality (R/S), and to interventions that may lead to diminishing or solving negative influences.
There is a lot of debate about the definitions of religiosity and spirituality (Hill et al., 2000; Zinnbauer & Pargament,2005). According to Koenig, King, and Carson (2012), the terms religion and religiosity are often used to refer to shared beliefs and rituals and to the membership of a faith community, whereas the term spirituality is often used to emphasize more individualistic beliefs and rituals. However, basically, both concepts share a belief in the sacred and the transcendental. In this meta-analysis, we will therefore use both terms interchangeably. However, the main focus of this study is on a specific aspect of religiosity and spirituality that is based on monotheistic religions (as, e.g. Christianity, Islam, and Judaism) that assume the existence of one personal God to whom the believer can relate (Davis, Granqvist, & Sharp,2018): the personal God representation.
In this meta-analysis, we will, amongst others, examine if the personal God representation has stronger associations with well-being/mental health than more general aspects of religiosity. There is confusion about the construct of God representations (Gibson,2008). Terms like God concept, God image, and God representation are often used interchangeably. A useful distinction is that between two dimensions of God representations: cognitive/doctrinal beliefs (about how God is conceptually viewed by a person) and emotional/experiential feelings about God, about the personally experienced relationship with God (Davis, Moriarty, & Mauch, 2013; Zahl & Gibson, 2012). In this study we will focus on the relational/emotional/experiential dimension.
first explore the results of these findings. Another reason is that on theoretical grounds God representations can be viewed as an important explanation for the found associations between religiosity and wellbeing/mental health. We will subsequently discuss these theoretical grounds, based on attachment and object-relations theory. Well-being/mental health and its counterpart, psychological distress are summarized in this study with the term adjustmental psychological functioning, to emphasize the general notion that they can be viewed as indicators of psycholo-gical adjustment (Ano & Vasconcelles,2005; Salsman, Brown, Brechting, & Carlson,2005).
1.1. The associations between religiosity/spirituality and adjustmental psychological functioning
The available meta-analyses of the associations between religion and adjustmental psychological functioning (Ano & Vasconcelles,2005; Bergin,1983; Hackney & Sanders,2003; Smith, McCullough, & Poll,2003; Witter, Stock, Okun, & Haring,1985) suggest that in general being (more) religious is associated with higher well-being and with fewer mental health problems (see Table1). The found associations are weak, but support the notions of Winnicott (1971) and Rizzuto (1979) about the potential positive influences of religiosity.
Various factors influence the strength and direction of the associations, such as the variety in dimensions and aspects of religiosity. Witter et al. (1985), for example, found stronger positive associations for activities than for beliefs. Hackney and Sanders (2003), in turn, found stronger associations for personal devotion than for institutional membership and ideology, whereas Smith et al. (2003) found that extrinsic religiosity was positively, and other measures of religiosity (e.g. intrinsic religious orientation, religious attitudes, and beliefs), were negatively associated with depressive symptoms. A second factor is the distinction between positive and negative aspects of religiosity and of psychological adjustment. Results of Ano and Vasconcelles (2005), for exam-ple, suggest that positive aspects of religiosity (e.g. asking for forgiveness, seeking support from clergy, seeking spiritual connection) are more strongly associated with positive aspects of adjust-mental psychological functioning, and negative aspects of religiosity (e.g. spiritual discontent, seeing God as punishing) more strongly with negative aspects of adjustmental psychological functioning. The relevance of these finer distinctions within the concept of religion (and spirituality) is that they may explain some of the ambiguous or inverse associations found in a minority of the included studies.
Most narrative reviews about the association between religiosity and adjustmental psychological functioning (Ellison & Levin, 1998; Gartner, Larson, & Allen, 1991; Koenig et al., 2012; Koenig, McCullough, & Larson,2001; Larson et al.,1992; Payne, Bergin, Bielema, & Jenkins, 1991) also conclude that religiosity is predominantly positively associated with well-being, and predominantly negatively with mental problems, but that there are also studies with ambiguous or inverse results. One factor that seems related to negative or ambiguous results is psychopathology: Payne et al. (1991) found negative or no associations for the few studies with clinical samples in their review, and Koenig et al. (2012) found relatively more studies with positive associations between religiosity and mental problems for C-cluster Personality Disorders (18 studies, 17% negative, 50% positive) and Bipolar Disorder (4 studies, 0% negative; 50% positive).
1.1.1. Explanations for the associations between R/S and well-being/mental health
Table
1.
Meta-analyses
about
the
association
between
religiosity
and
well-being/mental
health
Study
Num-ber
of
sam-ples
Num-ber
of
clini-cal
sam-ples
Measures
of
religiosity
Measures
of
well-being/mental
health
Agge-grated
asso-ciation
Percen-tage studies
or
effect
sizes
with
positive
negative
association
Bergin,
1983
24
1
-Beliefs
-Experiences
-Activity
-believers-nonbelievers
Clinical
pathology
measures
0.09
47/23
Witter
et
al.,
1985
28
?
-Activities
-Religiosity
(single
question)
-Attitude
-Happiness
-life
satisfaction
-Morale
-general
quality
of
life
and
well-being
0.16
?
Hackney
&
Sanders,
2003
35
0
-Institutional
-Ideological
-Personal
devotion
-Psychological
distress
-Life
satisfaction
-Self-actualization
0.1
?/30%
Smith
et
al.,
2003
147
19
1
-Behaviors
-Attitudes
and
beliefs
-Orientation
-Intrinsic
-Extrinsic
-Positive
religious
coping
-Negative
religious
coping
-Religious
well-being
-God
concept
Depression
−
0.1
76/18
Ano
&
Vasconcelles,
2005
49
?
Positive
and
negative
religious
coping
in
specific
situations
Psychological adjustment
measures
0.332 –0.123 0.224 0.025
83/10
1adults
“
with
psychological
concerns
”
;
2positive
coping
and
positive
adjustment;
3positive
coping
and
negative
adjustment;
4negative
coping
and
positive
adjustment;
5negative
coping
and
negative
adjustment;
?
=
not
More specific explanations are offered by attachment and object-relations theory. Both devel-opmental theories assume that a core element of personality and personality pathology, namely how persons view themselves and others (Livesley, 1998, 2013), influence how they see and experience their relationship with God. This approach of religion is known as“relational spirituality” (Davis et al.,2018; Hall, 2007a, 2007b) and also integrates findings from stress-coping theory, social cognition theory, and brain research.
Object-relations theory and attachment theory (Hall,2007a,2007b) both assume that mental representations of people are formed during early development, which in turn influence the way God representations are formed. These experiences lead to mostly unconscious relational schemas or internal working models, which comprise representations of self and others, as well as their affective quality.
Less optimal experiences of responsivity and availability, according to attachment theory, may result in insecure attachment styles, such as: (a) anxious attachment: trying to restore disturbed feelings of security by using hyperactivating strategies (e.g. expressing anxiety and anger) to establish the availability of the attachment figure; (b) avoidant attachment: trying to restore this inner sense of felt security by using deactivating strategies (e.g. suppressing disturbing emotions or thoughts Bowlby, 1972, 2008; Bretherton & Munholland,2008, 1999; Mikulincer & Shaver,2008). In normal development, internal working models foster the capa-city for affect regulation and stress coping (Fonagy, Gergely, Jurist, & Target,2004; Mikulincer & Shaver,2008). Insecure working models of attachment relationships may confer risk for phy-sical disease and psychopathology through non-adaptive coping and impaired stress and affect regulation (Maunder & Hunter, 2008). Several studies have confirmed the usefulness of the attachment theory framework in the domain of religion (Granqvist,1998; Granqvist & Hagekull, 1999; Hall, Fujikawa, Halcrow, Hill, & Delaney, 2009; Kirkpatrick,1998; Kirkpatrick & Shaver, 1990,1992).
According to object relations theory (Fairbairn,1954; Klein,1946; Mahler,1971; Winnicott,1971), pathological internal working models involve less integrated representations of self and others. On the lowest levels, persons have difficulty in differentiating between the self and others, or in integrating positive and negative feelings about self or others. This often leads to emotional instability and the use of primitive defense mechanisms like splitting and projective identification. On lower levels others are predominantly viewed as less benevolent (affectionate, benevolent, warm, constructive involvement, positive ideal, nurturant) and more punitive (judgmental, puni-tive, and ambivalent) (Huprich, Auerbach, Porcerelli, & Bupp, 2015; Kernberg & Caligor, 1996). Higher, healthier levels correspond to more integrated and symbolized representations of self and others, involving affect tolerance, regulation, ambivalence and the ability to understand the perspective of others. There is also evidence of the usefulness of object-relations theory in the domain of religion (Brokaw & Edwards,1994; Hall & Brokaw, 1995; Stalsett, Engedal, & Austad, 2010; Tisdale, Key, Edwards, & Brokaw,1997).
1.2. Dimensions of God representations
One aspect of God representations is not as clearly related to these theoretical frameworks, and regards the extent to which God—according to the subject—has power, exerts control, gives guidance (Benson & Spilka, 1973; Schieman, 2008). We refer to this aspect as the God control aspect.
1.3. God representations and dispositional aspects of psychological functioning
Attachment and object-relations theory both assume that general schemas underlie both inter-personal representations of self and others and God representations. These general schemas or models are supposed to have trait-like characteristics. Traits are general“underlying”, not directly observable dispositions that have relative stability over time and are supposed to be related to heredity and upbringing (Fridhandler, 1986; Mischel, 2013; Strelau, 2001). Some scholars, for example, refer to attachment models as relatively stable traits (Green, Furrer, & McAllister,2007) or chronic general models (Collins & Feeney,2004). Davis et al. (2013) assume that God repre-sentations also have trait-like, chronic characteristics. However, it must be emphasized that these working models are especially determined by interactions with caregivers, and therefore have to be considered less stable than temperament-based traits.
If it is true that relatively stable general schemas underlie both God representations and internal working models of self and others, one would expect God representations and representations of self and others to be associated with each other. In attachment theory research in the domain of religion, this assumed association is known as the correspondence hypothesis (Granqvist,1998; Kirkpatrick,1998; Kirkpatrick & Shaver,1990). But these authors also hypothesize that attachment to God representations may compensate for insecure or negative interpersonal representations (known as the compensation hypothesis). Hall et al. (2009) assume correspondence on the deeper level of (implicit) internal working models, and on a more behavioral level they expect evidence of compensation. This compensation implies that insecurely attached persons may be more actively involved in actions aimed at finding relief in religion and in the relationship with God.
We expect that God representations are not only associated with adjustmental aspects of psychological functioning, but also with relatively stable, trait-like representations of self and others, and with neuroticism as an indicator of trait-like affect (dis)regulation. We will refer to these factors as dispositional aspects of psychological functioning. Existence of associations between God representations and dispositional aspects of psychological functioning can be con-sidered as support for the importance of the ideas of attachment and object relations theory for understanding the development of God representations.
1.4. Aim of meta-analysis, hypotheses and moderator analyses
1.4.1. Aim of meta-analysis
In this meta-analysis we examine the associations between God representations and adjustmental aspects of psychological functioning, to see if these associations are stronger than the usually found associations with broader measures of religiosity. We also examine the associations between God representations and dispositional aspects of psychological functioning: theoretically related variables that are connected with internal working models of relationships: self-concept, relationships with others and neuroticism.
measures in the six dimensions (Secure attachment to God, Anxious attachment to God, Avoidant attachment to God, Positive God representations, Negative God representations, and God control) again examining associations with undifferentiated adjustmental and dispositional aspects. On the third level, we examined more specific associations between dimensions of God representations and the adjustmental subdomains of well-being and distress and the dispositional subdomains self-concept, relationships with others, and neuroticism (as an operationalization of the capacity for affect regulation). We compared the strength of associations between these various measures. We also aimed to detect the effect of various moderator variables on the found associations. Finally we addressed the issue of publication bias, to determine whether in the selected studies an underrepresentation of studies with weak or non-significant associations existed.
Hypothesis 1.We expect that (a) positive God representations will be significantly and positively related to well-being and negatively to distress, and that (b) negative God representations will be significantly and negatively related to well-being and positively to distress. The strength of these associations will be larger (>.20) than the weak aggregated association of aboutr= .10 between religiosity and well-being/mental health that is generally found in the discussed meta-analyses, because we assume that God representations are a more determining aspect of religiosity than many other widely used measures.
Hypothesis 2.We expect that (a) positive God representations will be significantly and positively related to positive self-concept and to positive relationships with others, and negatively to neuroti-cism, and that (b) negative God representations will be significantly and negatively related to positive self-concept and to positive relationships with others, and positively to neuroticism.
1.4.2. Moderator analyses
To gain more insight into the association between God representations and psychological aspects, it is also important to examine the influence of potential moderator variables on this association. As moderator variables we use the various study- and sample characteristics of the included studies: (a) context/respondent status (samples with subjects with mental health problems or serious life problems); (b)method of measurement(self-report or implicit/indirect measures); (c) religion/denomination;(d)religiosity(the degree of religious involvement); (e)gender; (f)age; (g) quality of the study; (h)year of the study; and (i)quality of God representation measures.
2. Method
2.1. Eligibility criteria
Included were all studies with samples with a mean age of 15 years or older, regardless of design, using a combination of on the one hand a measure for God representations (aimed at a monotheistic belief in a personal god) and on the other hand a measure of an adjustmental or dispositional dimension factor (as defined), and of which we obtained a statistical association measure for one or more association(s) between them. Only scholarly (peer-reviewed) journal articles were included. No language restrictions were imposed. All studies complying with these criteria, dating from 1990 to May, 2015 were included.
2.2. Literature search
the dispositional dimension. For the adjustmental dimension the termsanxiety, depression, pathol-ogy, distress, therapy, outcome, well-being, happiness, life satisfactionandadjustmentwere used, and for the dispositional dimension the search consisted of the termspersonality, object relation, adult attachmentandchild attachment.
2.3. Study selection and data extraction process
First, two researchers (first and third author) independently screened titles and abstracts for inclusion; articles on which both agreed about exclusion, were excluded. From the remaining articles, the full text was read and independently assessed. Disagreement or doubt was resolved in consensus discussions. This resulted in 135 initial studies to be included.
Fifty-six studies of forty-nine authors did not report (all) correlations. Authors of studies with missing data or without the required data format for any of the relevant associations were approached by email in an attempt to obtain the correct data. Two reminders were sent in case of no response. Twenty-five authors replied (51%), 13 authors (26.5%) provided us with the missing correlations for 20 studies, 12 replied that the data were not available anymore. Twenty-one did not respond to the emails, and from three authors their email address was unknown or no longer operational. From the remaining 36 incomplete reporting studies, 17 studies could be included because they reported about at least one of the associations of this meta-analysis. The remaining (36–17=) 19 studies had to be excluded from the meta-analysis because they did not report about any associations between the measures of this meta-analysis. This resulted in (135–19 =) 116 studies. Four of these studies were excluded because they reported about the same samples and measures, resulting in (116–4 =) 112 studies.
Four studies had the same samples but reported about different measures. These studies were combined, resulting in (112–4 =) 108 separate or combined studies. Ninety-six of these studies consisted of one sample, 10 studies had two samples with appropriate associations, one study had three samples, and one study had four samples with appropriate associations, resulting in (96 × 1 + 10 × 2 + 1 × 3 + 1 x 4) = 123 independent samples (Figure1).
Data from selected studies were extracted by the first author. The third author checked the accuracy of extraction on a sample of 22 of the 112 studies. Only one minor incorrect extraction was discovered, implying that the accuracy of data extraction was good.
2.4. Assessment of methodological quality of studies
2.5. Measures
selected, such assatisfaction(of work, body, marriage, etc.),adjustment(to work, or after trauma), personal growth(after a crisis),therapy outcome, orgeneral measures of well-being. For distress, also studies with a wide range of measures have been used:general distress, anxiety, depression, dissatisfaction, state-anger, etc.
The selection of measures of dispositional aspects of psychological functioningwas based on attachment theory and object relations theory. For (1)self-concept, studies with measures of self-conceptandlocus of controlwere selected.For (2) relationships with others, studies with measures of object-relational functioning and interpersonal attachment (partners, parents, friends) were selected. All scores were treated as either secure/positive or insecure/negative representations of self and others. The link with affect regulation was established by selecting studies that measured (3)worrying, and the Big Five dimensionneuroticism(negatively); or disposition mea-sures ofhopeandoptimism(positively). In Table2we listed the type(s) of measures we extracted from each study.
2.6. Assessing moderator factors
Assessing study- and sample characteristics/moderator factors took place on the basis of con-sensus, and involved the following variables and categories:
(1) context/respondent status(1 = sample with a non-patient mental health status, no serious life-events/problems; 2 = sample with non-patient status, but characterized by suffering from serious life-events/problems; 3 = sample defined by patient status);
(2) method of measurement (1 = God representations and psychological functioning measured with report only, 2 = only God representations measured otherwise than with self-report, 3 = only psychological functioning measured otherwise than with self-self-report, 4 = God representation and psychological functioning measured otherwise than with self-report);
(3) religiosity (1 = highly religious (> 80%); 2 = not highly religious, or unknown);
(4) religion/denomination (1 =orthodox Christian (> 80%), 2 = mainstream of mixed Christian, 3 = evangelical/baptistic (> 80%), 4 = mixed Christian/other religions, 5 = Jewish, 6 = Islamic, 7 = other theistic religions, 8 = mixed religious/non-religious (non-religious > 20%);
(5) sex(1 = predominantly male (> 80%), 2 = predominantly female, 3 = mixed);
(6) age(1 = mean age between 15 and 25 years, 2 = mean age between 25.1 and 50 years, 3 = mean age higher than 50 years);
(7) year of study
(8) quality of study(0–18 points);
(9) quality of God representation measures(5 = all measures valid/reliable, 4 = mix of valid/ reliable and moderately valid/reliable instruments, 3 = only moderately valid/reliable instru-ments, 2 = mix of moderately and weakly valid/reliable instruinstru-ments, 1 = only instruments with weak or unknown validity/reliability).
Table 2 shows the scores on the moderator variables for each study, Table 3 shows the distribution of the number of studies across the categories of the moderator variables, overall and per combination of God representation measure and dispositional or adjustmental measures.
2.7. Calculation of effect sizes
2.7.1. Pearson’s correlation coefficient as effect size
Table 2. Study/sample characteristics Study name God representation Dispositional Adjustmental Sample size Respondent Status Measurement Religiosity Religion Sex Age Quality study Quality God Measure Abdelsayed 2013 P N,S 75 NP ASR HR OC M 26-50 12 5 Alavi 2013 P,N D 100 SLP ASR NHR CO Mx 26-50 7 4 Allen 2014 P S D,W 267 NP ASR HR OC Mx 15-25 13 5 Ano 2005 As,An,Av,P N D 309 NP ASR NHR MC Mx 15-25 13 4 Basset 2003 P,N S 102 NP ASR NHR MC Mx 15-25 8 1 Bassett 2008 P,N,C N 133 NP ASR NHR MC Mx 15-25 8 5 Bassett 2009 C N 117 NP ASR HR MC Mx 15-25 12 4 Bassett 2013 An,N R 152 NP ASR HR MC Mx 15-25 10 5 Beck 2004 study2 An, Av R 118 NP ASR NHR MC Mx 15-25 11 3 Beck 2004 study3 An,Av R 109 NP ASR NHR MC Mx 15-25 12 3 Belavich 2002 As,An,Av W 155 SLP ASR NHR CO Mx 26-50 12 4 Bickerton 2014 , 2015 An,Av N D 835 NP ASR HR MC Mx 26-50 12 4 Birgegard 2004 exp1 An R 29 NP ASR NHR MC Mx 15-25 11 5 Birgegard 2004 exp2 An R 47 NP ASR NHR MC Mx 26-50 11 5 Birgegard 2004 exp3 An R 89 NP ASR NHR MC Mx 26-50 11 5 Bishop 2014 An D,W 261 SLP ASR HR RN M >50 14 5 Braam 2008a P,N,C N D 60 NP ASR NHR MC Mx >50 14 5 Braam 2008b P,N,C N D 59 NP ASR NHR MC Mx 26-50 17 5 Braam 2014 P,N D 292 MHP ASR NHR MC Mx >50 17 5 Bradshaw 2008 P,N D 1629 NP ASR NHR MC Mx 26-50 16 3 Bradshaw 2010 As,An,P,N D 1041 NP ASR NHR MC Mx >50 16 3 Brokaw 1994 P,N,C R 92 NP PSN NHR MC Mx 15-25 14
Table 2. ( Continued ) Study name God representation Dispositional Adjustmental Sample size Respondent Status Measurement Religiosity Religion Sex Age Quality study Quality God Measure Buri 1993 P R,S 392 NP ASR HR MC Mx 15-25 14 5 Cassibba 2008 As R NP PSN NHR MC Mx 26-50 17 3 Cecero 2004 -Fordham P R,S D 205 NP ASR NHR MC Mx 15-25 12 3 Cecero 2004 -Nau P R,S D 68 NP ASR NHR RN Mx 15-25 12 3 Ciarrocchi 2009 P D,W 541 NP ASR NHR RN Mx 26-50 14 5 Dickie 2006 P,C R,S 132 NP PSGN NHR MC Mx 15-25 11 2 Dumont 2012 ACOA An,AV W 96 SLP ASR NHR EB F 15-25 14 4 Dumont 2012 nonACOA An,AV W 171 NP ASR NHR EB F 15-25 14 4 Eriksson 2009 P D 111 NP ASR NHR MC Mx 26-50 13 5 Eurelings-Bontekoe 2005 P,N,C R,S D 206 NP ASR NHR MC Mx 26-50 16 5 Exline 2013 study 1 N R 471 NP ASR NHR CO Mx 26-50 12 5 Exline 2013 study 2 An, N R 236 NP ASR NHR RN Mx 15-25 13 5 Exline 2014 An,N D 1025 NP ASR NHR MC Mx 15-25 14 5 Feenstra 2008 As W 135 NP ASR NHR MC Mx 15-25 12 3 Fergus 2014 An,Av R D 450 NP ASR NHR RN Mx 26-50 13 5 Fisk 2013 study 1 An,N,C S D 157 NP ASR HR MC Mx 26-50 10 5 Fisk 2013 study 2 An,N D 139 NP ASR HR MC Mx 15-25 11 5 Freeze 2015 study 1 An,Av S W 117 NP ASR NHR OC Mx 26-50 14 4 Freeze 2015 study 2 An,Av D,W 185 NP ASR NHR EB Mx 26-50 14 4 Gall 2004 P,N,C N,S W 34 SLP ASR NHR MC M >50 12
Table 2. ( Continued ) Study name God representation Dispositional Adjustmental Sample size Respondent Status Measurement Religiosity Religion Sex Age Quality study Quality God Measure Gall 2007 P,C N,S D,W 101 SLP ASR NHR CO F 26-50 15 5 Gall 2009 P,N N D,W 93 SLP ASR NHR MC F >50 15 5 Ghafoori 2008 An, P R D 102 SLP PSN NHR RN Mx >50 15 5 Goeke-Morey 2014 P D 667 NP ASR NHR MC M 15-25 15 5 Gonsalvez 2010 N D 179 NP ASR NHR RN Mx 15-25 13 4 Granqvist 1999 An R 156 NP ASR NHR RN Mx 15-25 12 3 Granqvist 2001 An R 196 NP ASR NHR RN Mx 15-25 12 3 Granqvist 2005 As,An R 197 NP ASR NHR CO Mx 26-50 13 3 Granqvist 2007 P,N R 70 NP PSN NHR RN Mx 26-50 16 5 Granqvist 2012 An,Av,P R 352 NP ASR NHR JW Mx 15-25 12 5 Greenway 2003 Females P,N S D 132 NP ASR NHR MC F 26-50 10 3 Greenway 2003 Males P,N S D 69 NP ASR NHR MC M 26-50 10 3 Grubbs 2013 sample1 N N 413 NP ASR NHR RN Mx 15-25 14 5 Grubbs 2013 sample2 N N 148 NP ASR NHR CO Mx 26-50 14 5 Hale-Smith 2012 P,C S 614 NP ASR NHR RN Mx 15-25 13 5 Hall 1998 N R 76 NP ASR NHR RN Mx 26-50 11 3 Hall 2002 An,N R 438 NP ASR NHR RN Mx 15-25 9 3 Hancock 2010 An,Av D 96 NP ASR NHR RN Mx 26-50 11 4 Hernandez 2010 As D 221 NP ASR NHR MC Mx 15-25 10 3 Ho 2013 As N,S D 336 NP ASR NHR MC Mx 15-25 14 5 Homan 2010 An,Av D 231 NP ASR NHR MC F 15-25 12 4 Homan 2012 An D 94 NP ASR NHR MC M 15-25 12
Table 2. ( Continued ) Study name God representation Dispositional Adjustmental Sample size Respondent Status Measurement Religiosity Religion Sex Age Quality study Quality God Measure Homan 2013 An,Av R D,W 104 NP ASR NHR RN F 15-25 12 4 Homan 2014a An,Av S D,W 188 NP ASR NHR RN Mx 26-50 15 4 Homan 2014b An,Av D 186 NP ASR HR MC F 15-25 11 4 Houser 2013 An,Av N,R 251 NP ASR NHR MC Mx 15-25 12 4 Jankowski 2014 An S 211 NP ASR NHR CO Mx 26-50 12 5 Kelley 2012 As R,S D,W 93 SLP ASR NHR MC F 26-50 13 5 Kézdy 2013 An,Av,P,N S D 215 NP ASR NHR MC Mx 26-50 11 5 Kim 2011 P,N D 406 MHP ASR NHR RN Mx 26-50 14 4 Kirkpatrick 1990 , 1992 As,P,N R W 147 NP ASR NHR RN F 26-50 13 5 Kirkpatrick 1998 P,N R 1126 NP ASR NHR MC Mx 15-25 13 5 Knabb 2014a As,An,Av,P R D 138 NP ASR NHR MC Mx 26-50 15 5 Knabb 2014b Fs An,Av,P W 58 NP ASR NHR MC F 26-50 14 5 Knabb 2014b Ms An,Av,P W 58 NP ASR NHR MC M 26-50 14 5 Knabb 2014c An,Av N D 179 NP ASR NHR MC Mx 15-25 12 5 Krause 2009 P S 537 NP ASR NHR RN Mx >50 13 1 Krause 2015 P S 985 NP ASR NHR RN Mx >50 14 1 Krumrei 2013 P,N D 208 NP ASR NHR JW Mx 26-50 14 5 Lewis-Hall 2006 An S D,W 181 NP ASR NHR EB Mx 26-50 13 5 Limke 2011 An,AV S 173 NP ASR NHR RN Mx 15-25 11 4 Mattis 2003 P N 149 NP ASR NHR RN Mx 26-50 12 3 McDonald 2005 An,Av R 101 NP ASR NHR MC Mx 15-25 9 4 Mendonca 2007 P,N N D,W 321 NP ASR NHR MC Mx 26-50 11 5 Miner 2009 As N 116 NP ASR NHR RN Mx 26-50 13 3 Miner 2013 , 2014 An,AV,P D 225 NP ASR HR MC Mx 26-50 13
Table 2. ( Continued ) Study name God representation Dispositional Adjustmental Sample size Respondent Status Measurement Religiosity Religion Sex Age Quality study Quality God Measure Namini 2009 As D 50 NP ASR NHR EB Mx 26-50 11 3 O'Grady 2012 An,N W 108 SLP ASR NHR RN Mx 26-50 12 5 Prout 2012 An,Av W 46 MHP PSN NHR MC Mx 26-50 12 4 Reiner 2010 An,Av R D 276 NP ASR NHR EB Mx 15-25 13 4 Reinert 2005 An,AV,N R,S 75 NP ASR NHR MC M 15-25 14 5 Reinert 2009 An,P,N R 150 NP ASR NHR RN Mx 15-25 12 4 Reinert 2012 An,P,N R,S 305 NP ASR NHR RN Mx 15-25 14 4 Rouse 2012 study1 As N,S 345 NP ASR NHR CO Mx 15-25 13 4 Rouse 2012 study2 As N,S 70 NP ASR NHR MC Mx 15-25 13 4 Rowatt 2002 An,Av N D,W 323 NP ASR NHR MC Mx 26-50 10 3 Sandage 2010a An,N D 181 NP ASR NHR MC Mx 26-50 12 5 Sandage 2010b An R D,W 213 NP ASR NHR CO Mx 26-50 12 5 Sandage 2013 An R 139 NP ASR NHR MC Mx 26-50 13 5 Schaap-Jonker 2002 P,N,C D 46 MHP ASR NHR MC Mx 26-50 10 3 Schaefer 1991 P,N,C N 161 NP ASR NHR RN Mx 15-25 14 5 Schieman 2006 C S 1167 NP ASR NHR RN Mx >50 15 3 Schreiber 2011 , 2012 C D,W 129 SLP ASR NHR MC F >50 15 3 Schwab 1990 P,N N D 149 NP ASR NHR MC Mx 26-50 12 3 Siev 2011 P,N D 147 MHP ASR NHR CO Mx 26-50 14 5 Sim 2011 As N,R,S D 106 NP ASR NHR CO Mx 15-25 14 6 Simpson 2008 P R 298 NP ASR HR MC Mx 26-50 12 5 Steenwyk 2010 P,N N W 254 NP ASR HR MC Mx 15-25 15 4 Strawn 2008 P N 204 NP ASR NHR MC Mx 26-50 12 3 Sutton 2014 An,Av N 389 NP ASR NHR MC Mx 15-25 13 4 TenElshof 2000 P R 216 NP ASR HR MC Mx 15-25 13
Table
3.
Study
and
subgroup
characteristics
Study characteristics
Number
of
studies
Number
of
effect sizes
Sec
ATG x
disp
Sec
ATG x
adj
Anx ATG x disp
Anx ATG x adj
Avd ATG x disp
Avd ATG x adj
Pos
GR x
disp
Pos
GR x
adj
Neg
GR
x
disp
Neg
GR
x adj
God Cntr x disp
God Cntr x adj
Context/ respondent
status
-No
problems
106
291
10
9
36
27
19
21
36
26
31
23
11
2
-Serious
life
problems
11
44
2
5
2
5
2
4
23
-Mental
health
problems
61
3
1
1
1
11
44
1
Method
of
measurement -Only
self-report
117
322
10
12
36
31
19
23
36
34
31
31
11
6
-State
and/or
trait
otherwise
5
1
2
1
2
1312
1
than
self-report
-God representation and
trait
or
state
otherwise
than
self-report
14
11
Religiosity -Highly
religious
14
32
1
5
13
6
323
2
-Not
highly
relig./
unknown
109
316
11
12
35
28
18
21
34
32
31
28
11
6
Denomination
(
Table 3. ( Continued ) Study characteristics Number of studies Number of effect sizes Sec ATG x disp Sec ATG x adj
Anx ATG x disp
Anx ATG x adj
Avd ATG x disp
Avd ATG x adj
Pos GR x disp Pos GR x adj Neg GR x disp Neg GR x adj
God Cntr x disp
God Cntr x adj
Table
3.
(
Continued
)
Study characteristics
Number
of
studies
Number
of
effect sizes
Sec
ATG x
disp
Sec
ATG x
adj
Anx ATG x disp
Anx ATG x adj
Avd ATG x disp
Avd ATG x adj
Pos
GR x
disp
Pos
GR x
adj
Neg
GR
x
disp
Neg
GR
x adj
God Cntr x disp
God Cntr x adj
-Low
(<
11
points)
14
43
Quality
of
God
representation measures -All
measures
valid/reliable
53
260
4
3
15
13
4
5
19
17
18
14
94
-Mix
of
valid/
reliable
and
moderately
valid/
reliable
measures
34
3
3
14
17
12
16
10
7
8
7
2
-Only
moderately
valid/reliable measures
32
75
3
73
3
3
8
1
0
6
9
1
-Mix
of
measures
with
moderate
and
weak
or
unknown
validity/
reliability
13
1
12
-Weak
or
unknown
validity/reliability
31
3
1
1
2111
Rows
of
boldfaced
numbers
have
at
least
two
categories
with
at
least
four
studies
for
the
specific
characteristic.
Sec
ATG
=
Secure
attachment
to
God
di
mension;
Anx
ATG
=
Anxious
attachment
to
dimension;
Avd
ATG
=
Avoidant
attachment
to
God
dimension;
Pos
GR
=
Positive
God
representations
dimension;
Neg
GR
=
Negative
God
representations
dim
ension;
God
Cntr
=
God
control
dimension;
disp
=
dispositional
measures;
adj
=
adjustmental
were then imported in the software program for meta-analyses Comprehensive Meta-Analysis Version 2 (CMA, Borenstein, Hedges, Higgins, & Rothstein,2014), leading to 30 possible outcomes per study: six types of God representation measures x five other measures (two types of adjustment measures + three types of disposition measures). In the present meta-analysis, this resulted in 348 effect sizes from 123 independent samples (average of 2.83 effect sizes (ES’s) per sample). Effect sizes were assigned a positive value if they were consistent with the a priori predictions, and a negative value if they were inconsistent with the a priori predictions. All analyses for the present study were performed using the CMA software. Following Cohen (1988), correlations of .10 to .29 are considered as small effect sizes, correlations of .30 to .49 as medium effect sizes, and correlations of at least .50 as large effect sizes.
2.7.2. Calculations of effect sizes on three levels
We calculated effect sizes on three levels of varying abstraction. On the first level, we examined the associations of undifferentiated God representations with respectively undifferentiated adjust-mental and undifferentiated dispositional aspects. For calculating effect sizes on this level, multi-ple correlations per individual study were averaged, to meet the statistical assumption of independence required for meta-analysis. In doing so, we followed standard meta-analytic proce-dures (Horvath & Symonds,1991; Martin, Garske, & Davis,2000).
On the second level, we examined the associations between the six dimensions of God representa-tions and undifferentiated adjustmental measures and the associarepresenta-tions between the six dimensions of God representations and undifferentiated dispositional measures, 12 (6 x 2) effect sizes in total.
On the third level, we examined associations between each dimension of God representations and the subdomains of the adjustmental aspects (well-being and distress) and associations between each dimension of God representations and the subdomains of the dispositional aspects (self-concept, relationships with others and neuroticism), 30 effect sizes in total.
For determining the significance of the effect sizes, we lowered the usual 5% level of significance to 0.1% (p= .001) because we calculated 42 (12 + 30) separate effect sizes. This correction was aimed at diminishing the risk of type I errors (“false positives”) given the large number of separate tests. 2.7.3. The random-effects model
Calculations of effect sizes were based on the random-effects model, because we expected the true effect size to vary between studies due to varying measures, used within very different populations under various circumstances. This has its effect on the weight assigned to each individual study as a function of the within-study variance.
2.8. Heterogeneity analysis
potential sources of heterogeneity, thereby simultaneously testing our hypotheses.
2.9.1. Subgroup analyses
Our hypotheses are about differences in aggregated effect sizes, caused by differences between dimensions of God representation or caused by differences between subdomains of adjustment or disposition measures (lower level). These differences were examined by subgroup analyses based on the fixed-effects model, as this is the common approach (Cuijpers,2016).
When examining these differences between subgroups for explaining heterogeneity, studies that had outcomes for both subgroups were excluded, to avoid violating the assumption of indepen-dence. This often led to the exclusion of many available effect sizes. Only for a few subgroup analyses, if independent comparisons were impossible, we used all available effect sizes, treating them as independent.
2.9.2. Moderator analyses
For examining the possible effects of moderator variables, meta-regression analyses were con-ducted on the two highest levels. With these analyses, the influence of three continuous variables (year and quality of study and quality of God representation measures) and of six categorical variables (respondent status, method of measurement, religiosity, religion/denomination, sex, and age) were established.
We included categorical variables for analyses if a variable had at least two categories with four or more studies for the subgroup. This broad approach was chosen to be able to detect potential differences in a majority of the small subgroups.
2.10. Publication bias
In meta-analyses there is always the risk of overestimating the strength of the combined effect size because of the well-known“file-drawer effect”(Thornton & Lee,2000), implying that non-significant findings, which are more likely in small studies, are less likely to be published. Therefore it is important to check if small studies with relatively small effect sizes are underrepresented in meta-analyses. A useful method for examining this is looking at the funnel plot. An indication for publication bias are“missing”studies at the lower-left corner of the plot. These“missing”studies are the (smaller) studies with lower standard errors and with lower effect sizes. A more quantita-tive approach to checking publication bias is by simulating a meta-analysis that corrects for potentially missing effect sizes by making the funnel plot symmetrical and comparing the simu-lated with the observed results. This is done with Duval and Tweedie (2000) trim and fill analysis. We conducted these trim and fill analyses on all three levels.
To test the robustness of the found effect sizes, we did Orwin’s (1983) fail-safe analyses on the first level. With these analyses, we calculated how many studies with a correlation ofr= 0 would be needed to lower the found effect size to r = .10, the usually found association between religiosity and well-being/mental health. On the third level, we also examined the robustness of the significant effect sizes of the associations of specific God representations with well-being and distress withr> .20, because they are based on much smaller numbers of studies.
3. Results
3.1. Summary of study characteristics and results of meta-analysis
Table 4. Characteristics of effect sizes at three levels of analysis
God representations dimension
Table
4.
(
Continued
)
God representations dimension
Table
4.
(
Continued
)
God representations dimension
Table
4.
(
Continued
)
God representations dimension
Adj.
or
Disp.
dimension
kr
p
a
Qp
b
I
2
T
DT
95%
CI
95%
PI
Self
7
.050
.36974
31.305
.00002
57
.125
0
[
−
.060, .160]
[
−
.293,
.382]
Neur
7
.185**
<.00001
5.816
.44412
20
<.001
2
R
[.109, .259]
[.085,
.281]
p
a
=
p
-value
of
significance
test
of
r;
p
b
=
p
-value
of
significance
test
of
Q
,
DT
=
Duval
and
Tweedie
’
s
trim
and
fill
analysis;
PI
=
Prediction
interval;
L
=
“
missing
”
studies
at
left
side
of
mean;
LB
=
“
missing
”
studies
at
left
side
with
SE
>
0.10,
Sec
ATG
=
Secure
attachment
to
God
dimension,
Anx
ATG
=
Anxious
attachment
to
God
dimension,
Avd
ATG
=
Avoidant
attachment
to
God
dimension;
Pos
GR
=
Positive
God
representations
dimension,
Neg
GR
=
Negative
God
representations
dimension,
God
Cntr
=
God
control
dimension.
Adj.
=
Adjustment
al;
Disp.
=
Dispositional,
Undif.
=
undifferentiated,
Wellb
=
Wellbeing;
Distr
=
distress;
Rwo
=
Relationships
with
others;
Self
=
Self-concept;
Neur
=
Neuroticism.
**
p
<
adjustmental aspects of psychological functioning was highly significant,r= .196, and approximated the expected effect size ofr= .20, as stated in hypothesis 1. We compared this result with a new computation in CMA of Bergin’s (1983) studies, which yielded a nonsignificant effect size ofr= .072. A test of the difference between the two effect sizes was significant,Q= 5.481,p= .019. Comparing our results with those of Hackney and Sanders (2003), their overall effect size ofr= .10,CI 95%[.10, .11] differed significantly from our average effect size, as the not overlapping confidence intervals indi-cated. At last we compared our results with the meta-analytical outcome of Smith et al. (2003), who found a random-effects weighted average effect size ofr=−.096,CI 95%[−.011,−.08]. Converted to positive values, thisr= .096,CI 95%[.08, .11] differed significantly from ourr= .196, indicated by the clearly not overlapping confidence intervals.
The association between undifferentiated God representations and undifferentiated disposi-tional aspects was also highly significant,r= .242, as expected by hypothesis 2.
The substantial or considerable heterogeneity of both effect sizes asks for further examination. At the next level, we aim at finding sources of heterogeneity in the differences between the various God representation dimensions in the strength of associations with adjustmental and dispositional measures.
3.3. Analyses on level 2
3.3.1. Associations of differentiated God representation measures with undifferentiated adjustmental aspects
Five out of six dimensions of God representations had highly significant associations with undiffer-entiated adjustmental aspects of psychological functioning (well-being/distress). Anxious attach-ment to God and negative God representation, with effect sizes of respectively r = .263, and r = .218, had the strongest associations with well-being/distress, in accordance with hypothesis 1, which expected effect sizes > .20. The highly significant associations of positive God representa-tion, r = .194, and secure attachment, r = .189, with well-being/distress were just below the expected strength. The highly significant association of avoidant attachment,r = .099, and the not significant association of God control,r= .068, with well-being/distress were much lower. From the significant associations with wellbeing/distress, the heterogeneity for the association with avoidant attachment to God—according to I2—was substantial, but the standard deviation of the effect size was low (T= .076), indicating that differences between effect sizes of individual studies were relatively small. The heterogeneity of the significant effect sizes for the associations between the other God representation measures and well-being/distress was still considerable, asking for further analyses for its potential sources.
The omnibus test for subgroup analysis (see Table5) detected no significant differences between the effect sizes of the six subgroups of God representation measures. Because there were no studies that used only avoidant attachment to God measures in combination with adjustmental aspects, we could not test these differences by treating the effect sizes as dependent. Therefore we did this subgroup analysis again, treating all available 167 effect sizes as independent. Now the omnibus test yielded highly significant differences between effect sizes, and results of post hoc analyses showed that the associations of God Control and avoidant attachment to God with undifferentiated adjustmental aspects (well-being/distress) were significantly lower than the asso-ciations of the other God representation measures with well-being/distress.
3.3.2. Associations of differentiated God representation measures with undifferentiated dispositional aspects
Table
5.
Differences
between
God
representation
dimensions
in
strength
of
association
with
adjustmental
aspects
Dependent
Independent
God
representation
dimensions
kr
QB
pk
r
QB
p
Combined
measures
49
.182
9.390
.094
-36.491
<
.001
Secure
attachment
to
God
6
.120
13
.211
Anxious
attachment
to
God
4
.293
41
.263
Avoidant
attachment
to
God
-29
.109
Positive
God
representations
dimension
7
.201
41
.208
Negative
God
representations
dimension
6
.184
35
.232
God
Control
1
.201
8
.071
Boldfaced
p
-values
<
sizes,r = .307 andr= .307, respectively, followed by positive God representation and negative God representations, that had effect sizes of respectively r = .224, and r = .198, for their associations with dispositional aspects. The weakest associations with dispositional aspects were found for the God representation dimensions avoidant attachment to God,r = .159, and God Control,r= .084.
Heterogeneity, based on I2, was substantial for the association of dispositional aspects with secure attachment to God, and it was considerable for the association with the other five God representation measures. Only the effect size of the association of dispositional aspects with avoidant attachment to God had a low standard deviation(T= .080), indicating that differences between effect sizes of individual effect studies were relatively small. Sources of potential hetero-geneity must be examined for the association of the other God representation dimensions with dispositional aspects.
3.3.3. Subgroup analyses
The omnibus test for subgroup analysis (see Table6) detected no significant differences between the effect sizes of the six subgroups in their associations with undifferentiated dispositional aspects. To examine the potential difference between avoidant attachment to God versus other God representation dimensions in their associations with dispositional aspects, we used all 181 effect sizes in a new subgroup analysis by treating them as independent. Results of post hoc analyses showed that the association between God control and undifferentiated dispositional aspects was significantly lower than the associations of the secure and anxious attachment to God dimensions and of the positive God representations dimension with undifferentiated disposi-tional aspects. The associations of the negative God representations dimension and of avoidant attachment to God with the undifferentiated dispositional aspects were significantly lower than the associations of secure and anxious attachment to God with the undifferentiated dispositional aspects.
3.4. Analyses on level 3
3.4.1. Associations between differentiated God representations and differentiated adjustmental aspects
3.4.1.1. Associations of God representations dimensions with well-being. Four out of six God repre-sentation dimensions were highly significantly associated with well-being. Secure and anxious attachment to God and positive God representations had the strongest associations, withr> .20, as expected (hypothesis 1). The negative God representation dimension had an association with well-being less thanr= .20. The associations of avoidant attachment to God with well-being and of God Control with well-being were non-significant.
Heterogeneity of the significant effect sizes was very low for the association of well-being with secure attachment, according toI2andT. For the association with positive God representations it was substantial, but T was smaller than 0.10, indicating that differences between individual effect sizes were relatively small. For the associations of well-being with anxious attachment to God, with positive God representations, and with negative God representations, heterogeneity was consider-able or substantial.
Table
6.
Differences
between
god
representation
dimensions
in
strength
of
association
with
dispositional
aspects
Dependent
Independent
God
representation
dimensions
kr
QB
pk
r
QB
p
Combined
measures
47
.214
5.780
.328
-34.281
<
.001
Secure
attachment
to
God
7
.298
17
.309
Anxious
attachment
to
God
9
.258
39
.306
Avoidant
attachment
to
God
-22
.160
Positive
God
representations
dimension
14
.293
50
.220
Negative
God
representations
dimension
8
.276
36
.196
God
Control
2
.117
17
.095
Boldfaced
p
-values
<
tress. According toI2, heterogeneity was moderate for the association between avoidant attach-ment to God and distress, withT< 0.10, indicating that this effect size might be a rather precise estimate.
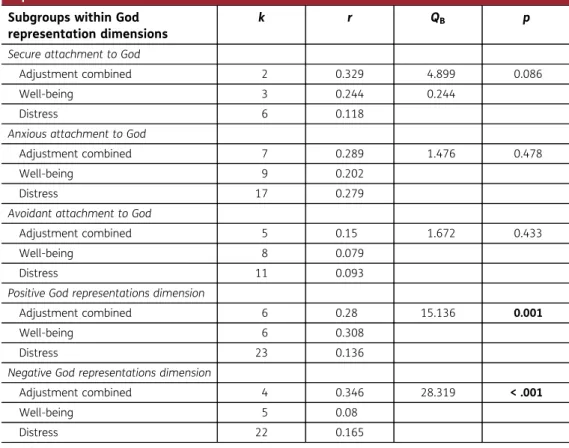
3.4.1.3. Subgroup analyses. Results of subgroup analyses (see Table 7) confirmed significant differences in strength of the associations between well-being and distress on the one hand and the positive and negative God representation dimensions on the other. The positive God represen-tation dimension had significantly stronger associations with well-being than with distress; the negative God representation dimension had significantly stronger associations with distress than with well-being. There were no significant differences between well-being and distress regarding their associations with attachment to God measures.
3.4.2. Associations between differentiated God representations and differentiated dispositional aspects
3.4.2.1. Associations of God representation dimensions with relationships with others. As shown in Table4, five of the six associations of God representation dimensions with relationships with others were highly significant; only the association of God Control with relationships with others was non-significant.
Heterogeneity of the associations was considerable or substantial. The associations of avoidant attachment to God and of the negative God representation dimension with relationships with others had standard deviations ofT< 0.10, suggesting valid estimates.
Table 7. Differences between adjustmental aspects in strength of association with the God representation dimensions
Subgroups within God representation dimensions
k r QB p
Secure attachment to God
Adjustment combined 2 0.329 4.899 0.086
Well-being 3 0.244 0.244
Distress 6 0.118
Anxious attachment to God
Adjustment combined 7 0.289 1.476 0.478
Well-being 9 0.202
Distress 17 0.279
Avoidant attachment to God
Adjustment combined 5 0.15 1.672 0.433
Well-being 8 0.079
Distress 11 0.093
Positive God representations dimension
Adjustment combined 6 0.28 15.136 0.001
Well-being 6 0.308
Distress 23 0.136
Negative God representations dimension
Adjustment combined 4 0.346 28.319 < .001
Well-being 5 0.08
Distress 22 0.165
3.4.2.2. Associations of God representation dimensions with self-concept. Three out of six associa-tions of self-concept with the God representation dimensions were (highly) significant: secure attachment to God, anxious attachment to God and positive God representations. Heterogeneity of the effect sizes of all three significant associations was considerable.
3.4.2.3. Associations of God representation dimensions with neuroticism. All six God representation dimensions showed significant associations with neuroticism. Heterogeneity of the aggregated effect sizes was low for the association of secure attachment to God and of God control with neuroticism. It was substantial or considerable for the association of positive God representations and anxious attachment to God with neuroticism.
All in all, on the third level all associations were positive, and 73% of the associations were significant at thep= .001 level. From these significant associations, 82% still had substantial or considerable heterogeneity, to be examined further with moderator analyses.
3.4.2.4. Subgroup analyses. For the associations with secure attachment to God and God control, studies with measures of the dispositional dimension did not meet the criterion of at least two categories with at least four studies. For the other four God representation dimensions, none of the differences in strength of associations between dispositional aspects and God representations was significant (see Table8).
3.5. Publication bias
To check whether small studies with relatively small effect sizes were underrepresented in these meta-analyses, we generated two funnel plots (see Figure2), based on separate meta-analyses for the associations between undifferentiated God representation measures and undifferentiated
Subgroups within God representation dimensions
k r QB p
Anxious attachment to God
Disposition combined 3 0.322 5.276 0.153
Relationships with others 20 0.251
Self-concept 8 0.395
Neuroticism 5 0.388
Avoidant attachment to God
Disposition combined 3 0.166 5.768 0.123
Relationships with others 7 0.2
Self-concept 4 0.068
Neuroticism 5 0.164
Positive God representations dimension
Disposition combined 10 0.21 1.557 0.669
Relationships with others 10 0.237
Self-concept 9 0.279
Neuroticism 11 0.182
Negative God representations dimension
Disposition combined 3 0.174 1.57 0.666
Relationships with others 12 0.196
Self-concept 5 0.105
Neuroticism 13 0.245
state measures and for the associations between undifferentiated God representation measures and undifferentiated trait aspect measures.
For the effect sizes of God representations with adjustmental aspects, Duval and Tweedie’s trim and fill analysis indicated that there were seventeen“missing”studies at the left side of the mean. Inspecting the funnel plot showed that these missing studies were distributed equally over the standard error axis, so there was no overrepresentation of “missing”studies at the lower–left corner of the plot (representing the smaller studies with lower standard errors and with lower effect sizes). According to Orwin’s fail-safe analysis, it would take 63 studies with a correlation of r = 0 to lower the aggregated effect size (based on 73 studies) tor = .10 (the generally found association between religiosity and well-being).
For the effect sizes of God representations with dispositional aspects, based on 87 studies, inspection of the funnel plot and Duval and Tweedie’s trim and fill analysis indicated that there were no“missing”studies at the left side of the mean. It would take 128 studies with a correlation ofr= 0 to lower the aggregated effect size tor= .10.
Therefore, there were no indications of publication bias for the aggregated effect size of undifferentiated God representations with undifferentiated state aspects and with undifferentiated trait aspects, so the estimate of the associations was sufficiently robust.
Because specific God representations on the second and third level of analysis differed in their associations with state and trait aspects from the associations on the first level, we also checked for“missing”effect sizes at the left side on the second and third level and if positive, looked at their distribution accross the standard error axis. Overall, these funnel plots also yielded no indications of publication bias. Only three of the 30 associations on level 3 had a slight under-representation of small studies with low effect sizes, with for two of them (the associations of anxious and avoidant attachment to God with well-being) two out of three missing studies with low precision, and for the third (the association between the positive God representation
God representation measures with undifferentiated adjust-mental measures (left) and with undifferentiated disposi-tional measures (right). On the x-axis the strength of effect size in Fisher’sZ-score. On the y-axis the standard error as an indication of the precision of the studies. The open circles represent observed effect sizes for each study, closed circles represent the“missing”effect sizes. The open diamond-shaped symbol represents the overall effect size based on observed effect sizes, the black symol represents the estimated effect size affter imputing the
At last, we did Orwin’s fail-safe analyses on the third level to examine the robustness of the significant effect sizes of the associations of specific God representations with well-being and distress withr > .20, because they are based on much smaller numbers of studies. We again checked the robustness by calculating how many studies with a correlation ofr= 0 would be needed to lower the found effect size to r = .10. For the association between secure attach-ment to God and well-being (based on 5 studies) this would take 10 studies; for the association between anxious attachment to God and well-being (based on 16 studies) it would take 19 studies; for the association between anxious attachment to God and distress (based on 24 studies) it would take 48 studies; for the association between the positive God representations dimension and well-being (based on 12 studies) it would take 25 studies; and for the associa-tion between the negative God representaassocia-tions dimension and distress (based on 26 studies) it would take 31 studies withr= 0 to lower the aggregated correlation tor < .10.
We consider the results at level three to be sufficiently robust, because also for these associa-tions there were no indicaassocia-tions of publication bias.
3.6. Moderator analyses
Moderator analyses were performed to further examine heterogeneity. On the third level, the subgroups were too small to do these analyses. In fact, this was also the case for many combina-tions on level 2. For reasons of limited space, we report only the results of analyses on level 1. On this level, Religion/denomination and Year of study were the only factors that explained some variation.
3.6.1. Religion/denomination
There was a significant effect of religion/denomination on the association between God repre-sentations and adjustmental aspects, explaining 12% of the total between-study variance (see Table 9). Post hoc analyses of the differences revealed that mixed religious/not religious samples showed lower associations between God representations and adjustmental aspects, than the orthodox, evangelical/Baptist and mainstream Christian samples. There was also a significant effect on the association between God representations and dispositional aspects, explaining 9% of the total between-study variance. The association was significantly stronger for Evangelical/Baptist and for mixed Christian/other religions samples than for mainstream Christian and for mixed religious/not religious samples.
3.6.2. Year of study
The effect of the continuous moderator variable year of study on the associations between God representations and dispositional measures (see Table10) was significant, explaining 9% of the total between-study variance. More recent studies showed stronger associations.
Taken together, most of the substantial or considerable heterogeneity of the effect sizes could not be explained by the selected moderator variables.
4. Discussion
Table
9.
Effects
of
categorical
moderator
variables
Undifferentiated
adjustmental
aspects
Undifferentiated
dispositional
aspects
Categorical
moderator
variables
kE
S
QB
df
p
r
2
kE
S
QB
df
p
r
2
Respondent
status
no
problems
57
0.203
0.98
2
0.614
0
81
0.239
1.63
2
0.669
0
serious
life
problems
11
0.159
5
0.291
mental
health
problems
5
0.167
1
0.347
Lv2:
Anxious
attachment
to
God
no
problems
27
0.239
16.05
2
0
28
Serious
life
problems
5
0.05
mental
health
problems
1
0.37
Method
of
measurement
Only
self-report
82
0.249
2.72
2
0.257
0
Trait
not
self-report
4
0.099
God
repr.
not
self-report
1
0.131
Religiosity Not
highly
religious
65
0.196
0.01
1
0.913
0
77
0.239
0.37
1
0.544
3
Highly
religious
8
0.191
10
0.264
Religion/denomination orthodox
Christian
2
0.332
11.18
5
0.048
12
2
0.25
12.47
5
0.029
9
evang./Baptist
8
0.25
4
0.396
mainstream
and
mixed
Christian
42
0.202
45
0.231
mixed
Christian/other
religions
5
0.182
5
0.367
Jewish
1
0.297
1
0.217
mix
religious/not
religious
15
0.125
26
0.194
Lv2:
Avoidant
attachment
to
God
orthodox
Christian
1
0.005
15.1
4
0.005
61
(