Brian Foster
A thesis submitted to the faculty at the University of North Carolina at Chapel Hill in partial fulfillment of the requirements for the degree of Master of Arts in the Department of Sociology.
Chapel Hill 2013
Approved by:
Anthony Perez
Karolyn Tyson
ii
© 2013 Brian Foster
Subsequent Educational Attainment Outcomes (Under the direction of Anthony Perez)
Adolescents express multiple, sometimes conflicting school-related beliefs, including
educational aspirations and expectations that do not align. Although the independent effects of
aspirations and expectations on academic outcomes are robust and widely documented, it is
unclear how consequential these beliefs may be when they are discordant. Using data from the
National Longitudinal Study of Adolescent Health, I find that adolescents who express
aspirations that do not align with their expectations attain fewer years of education than their
counterparts who do not. In addition, a notable proportion of adolescents express aspirations that
are lower than their expectations. Findings from this study offer new insights regarding how
adolescents process mixed interpersonal and institutional messages about their academic
iv
ACKNOWLEDGEMENTS
This material is based upon work supported by the National Science Foundation under
Grant No. 2012141439. This material also received support from the Population Research
Training grant (T32 HD007168) and the Population Research Infrastructure Program (R24
HD050924) awarded to the Carolina Population Center at the University of North Carolina at
Chapel Hill by the Eunice Kennedy Shriver National Institute of Child Health and Human
Introduction…..……….………...1
Background…..……….………...2
Attitude-Achievement Paradox………….………...2
Abstract and Concrete Schooling Attitudes………….………3
Aspiration-Expectation Mismatch……….………..4
Data……….……….………..…..5
Dependent Variable: Educational Attainment……….………6
Independent Variables: Aspiration-Expectation Mismatch………....7
Additional Variables: Adolescent Demographic Characteristics, Family Background Characteristics, and Adolescent School Experiences/Attitudes………..9
Sample Selection……….………...10
Results………….……….………..12
Descriptive Results……….………...12
Multivariate Results……….………..15
Discussion………….……….………16
Limitations/Future Research………….………….……….………...18
Conclusion………….……….………...19
vi
LIST OF TABLES
Table 1. Raw Aspiration-Expectation Mismatch Scores and Absolute
Value Recodes………..………...………..7
Table 2. Weighted Bivariate OLS Coefficients for Educational Attainment
Differences by Magnitude of Aspiration-Expectation Mismatch………..…8
Table 3. Weighted Means/(Standard Deviations) and Proportions for Aspiration-Expectation Mismatch, Adolescent Educational Attainment and
other Covariates …..………...………...13
Table 4. Weighted OLS Coefficients for Educational Attainment
INTRODUCTION
Educational aspirations and expectations are important mechanisms in the processes of
status attainment and social reproduction (Bourdieu 1973; Bowles and Gintis 1976; Collins
1971; Duncan, Featherman, and Duncan 1972; Haller 1982; Sewell, Haller, and Ohlendorf 1970;
Sewell, Haller, and Portes 1969; Spenner and Featherman 1978). Aspirations are predictive of
many educational outcomes, including academic grades and educational attainment (Beal and
Crockett 2010; Downey, Ainsworth, and Qian 2009; Kao and Thompson 2003). They are
conceptualized as desires for a level of education and thought to reflect general valuation of
schooling without conscious considerations of structural constraints (for a review see Kao and
Tienda 1998). Educational expectations are drawn from adolescents’ personal experiences and
refer to the perceived likelihood of reaching a level of attainment via a specific educational
pathway (Museus, Harper, and Nichols 2010). They shape the timing and sequencing of
postsecondary educational experiences. For example, students who expect to go further in school
enroll in college earlier and, upon enrollment, finish their degree programs sooner than their
counterparts (Morgan 2005). These relationships have been replicated using diverse
methodological approaches and datasets, suggesting that adolescent educational aspirations and
expectations have robust impacts on overall status attainment trajectories (Andrew and Hauser
2
Although the independent effects of aspirations and expectations on educational
outcomes are widely documented, it is unclear how consequential mismatch between these
beliefs may be for educational attainment. Using data from the National Longitudinal Study of
Adolescent Health, this paper examines whether exhibiting aspiration-expectation mismatch
during adolescence is associated with differential levels of postsecondary educational attainment
among a nationally representative sample of US adolescents. This paper takes a broader
approach than previous examinations by expanding the operational definition of mismatch and
by extending analyses to a representative sample of US adolescents. Findings suggest that
exhibiting aspiration-expectation mismatch during adolescence is detrimental for educational
attainment in early adulthood. These findings may offer new insights on how adolescents process
mixed interpersonal and institutional messages about their academic potential, and at what cost.
BACKGROUND
Most adolescents include postsecondary education in their plans for the future. By eighth
grade, nine in ten aspire to at least “some college,” with about six in ten aspiring to complete a
four-year degree or more (Kao and Tienda 1998). Since 1980, the proportion of high school
sophomores expecting to complete a four-year degree has risen from less than half to greater
than three-fourths (Goyette 2008). These patterns are broadly consistent across race and gender
lines and have been linked to many educational outcomes, including high school academic
achievement and postsecondary educational attainment (Kao and Tienda 1998; Morgan 2005).
Attitude-Achievement Paradox
Not all adolescents’ positive school-related attitudes translate to high levels of
educational attainment. Specifically, although the positive attitudes of female adolescents are
2003), the attitudes of black adolescents consistently translate to lower levels of attainment than
those of their white counterparts (Downey et al. 2009; Morgan 2005). These patterns suggest an
“attitude-achievement paradox” in which adolescents’ schooling attitudes differentially translate
to future educational attainment depending on their racial/ethnic background (Mickelson 1990).
Indeed, (Morgan 2005) finds that each additional year of education expected during the
sophomore year of high school is associated with .182 additional years of attained education for
white male students but only .080 additional years for black male students.
The differential returns to school-related attitudes for black and white students have been
linked to many factors, including measurement error (Fuller 2009), structural processes
(Kerckhoff 1976; MacLeod 1995), and cultural particularities (Fordham and Ogbu 1986; Fryer Jr
and Torelli 2010). However, there is little consensus regarding whether these alternate
possibilities fully explain the gap between beliefs and outcomes (for a review see (Morgan
2005). Other scholars have continued to focus on the conceptual distinctions between types of
attitudes (see also (Eccles and Wigfield 2000).
Abstract and Concrete Schooling Attitudes
Mickelson (1990) distinguishes between abstract and concrete attitudes, finding that
concrete, or personalized, attitudes are more important for academic outcomes than abstract, or
general, ones. For example, believing that a family member will be mistreated at work “no
matter how much education they have” (i.e., a concrete attitude) has a larger impact on academic
achievement than believing that education can “help poor people become middle class” (i.e., an
abstract attitude). (Harris 2011) distinguishes between adolescent valuation of schooling and
beliefs in barriers to upward mobility, finding that attributing value to education is an important
4
Findings from (Mickelson 1990) and (Harris 2011) are relevant for two reasons. First,
they demonstrate that adolescents may simultaneously express multiple, potentially conflicting
beliefs about their schooling trajectories. For example, an individual may hold positive abstract
attitudes about the societal value of schooling while expressing more modest concrete attitudes
about the utility of schooling in their own lives. Further, students may attribute value to
schooling but still anticipate encountering structural obstacles. Next, although the findings add to
extant literature linking school-related attitudes to academic outcomes, they do not examine the
potential consequences of expressing attitudes that do not align. This study builds on these
analyses by examining two additional types of school-related beliefs, educational aspirations and
expectations, and how mismatch between them during adolescence impacts educational
attainment in early adulthood.
Aspiration-Expectation Mismatch
Previous studies find some evidence of mismatched educational aspirations and
expectations among US adolescents. In an analysis of high-achieving high school seniors,
(Hanson 1994)found that 16 percent of adolescents had aspirations that exceeded their
expectations. She referred to these adolescents, along with their counterparts who developed but
did not realize expectations of a college degree or who developed but did not maintain
expectations of a college degree, as “lost talent.” Other scholars have built upon these findings
by examining the background characteristics associated with unfulfilled expectations (Trusty and
Niles 2004) and by considering the long-term implications of unfulfilled expectations on
adolescent depressive symptomology (Reynolds and Baird 2010). Still, aspiration-expectation
mismatch remains an understudied type of lost talent with potential psychosocial and material
Boxer et al. (2011) examines the psychosocial implications associated with
aspiration-expectation mismatch, focusing on depressive symptomology, test anxiety, and school bonding.
They find that adolescents who exhibit aspiration-expectation mismatch have heightened levels
of emotional and behavioral difficulties (assessed through the Strengths and Difficulties
Questionnaire), higher levels of test anxiety, and lower levels of school bonding than their
counterparts. Although this study suggests that there are potentially detrimental psychosocial
effects associated with aspiration-expectation mismatch, it does not consider the ramifications of
mismatch for other types of outcomes, specifically educational attainment. Through an analysis
of panel data from a nationally representative sample of US adolescents, this paper examines (1)
the extent to which adolescents express educational aspirations and expectations that do not align
and (2) how this aspiration-expectation mismatch impacts future educational attainment.
In previous work on this topic, aspiration-expectation mismatch has been operationalized
in only one direction--aspirations that exceed expectations--and analyses have been restricted to
high-achieving adolescents with expectations of a college degree (Boxer et al. 2011; Hanson
1994). This paper imposes no such constraints. First, I consider any type of mismatch, including
that in which students report aspirations that are lower than their expectations. Although (Hanson
1994) cites structural disadvantage as a potential reason that adolescents express aspirations that
exceed their expectations, youth who develop expectations that are higher than their aspirations
may represent an entirely different, more advantaged group who do not “need” college
credentials (Mangino 2012). Next, I extend analyses to a representative sample of US
adolescents, ensuring a valid assessment of mismatch and making findings generalizable to the
6
DATA
This paper uses data from Wave I and Wave IV of the National Longitudinal Study of
Adolescent Health (Hereafter Add Health). Add Health is an ongoing project that focuses on
developmental and health trajectories across the life course. It has followed a nationally
representative cohort of US adolescents in grades 7-12 in 1994-95 for over fifteen years as they
completed high school and transitioned to early adulthood. The study used a multistage,
stratified, cluster sampling design and drew from a total of 132 schools, varying in size from 100
to over 3,000 students. In the first stage of Wave I data collection, over 90,000 adolescents were
issued an in-school survey (a self-administered instrument) during a 45- to 60-minute class
period (Harris 2009). Of these 90,000 adolescents, 20,745 adolescents also received in-home
surveys. Wave IV of the survey was administered in 2008 when individuals were between 24 and
32 years old. The Wave IV response rate was over 80 percent. While response rates did vary by
gender, age, and immigrant status, sampling weights adjust for this attrition, limiting the amount
of bias introduced and allowing the Wave IV sample to adequately represent the baseline
population (Harris 2009).
Dependent Variable: Educational Attainment
The outcome variable in this analysis comes from Wave IV of Add Health. Respondents
were asked, “What is the highest level of education that you have achieved to date?” Responses
ranged from “8th
grade or less” to “completed post baccalaureate professional education.” To
convert these ordinal groupings to a more desirable, interval level measure of education, I utilize
the popular midpoint scoring transformation (Shryock, Siegel, and Larmon 1980). For example,
individuals who report attainment levels of “8th
grade or less” are coded as having 4 years of
analysis of educational attainment differences than would be possible with dichotomous or
categorical specifications.
Independent Variables: Aspiration-Expectation Mismatch
The primary explanatory variable in this analysis is aspiration-expectation mismatch,
which is derived from two survey items. Respondents were first asked about their aspirations:
“On a scale of 1 to 5, where 1 is low and 5 is high, how much do you want to go to college?”
That question was followed by an assessment of their expectations: “On a scale of 1 to 5, where
1 is low and 5 is high, how likely is it that you will go to college?” Mismatch scores are
computed by taking the absolute value of the difference between an adolescent’s aspirations and
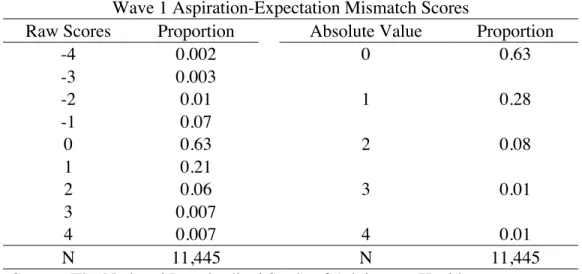
expectations (Mismatch1 = Aspirations1 – Expectations1). Table 1 shows the distribution of raw
mismatch scores as well as their absolute value recodes.
Table 1. Raw Aspiration-Expectation Mismatch Scores and Absolute Value Recodes (N=11,445)
Wave 1 Aspiration-Expectation Mismatch Scores
Raw Scores Proportion Absolute Value Proportion
-4 0.002 0 0.63
-3 0.003
-2 0.01 1 0.28
-1 0.07
0 0.63 2 0.08
1 0.21
2 0.06 3 0.01
3 0.007
4 0.007 4 0.01
N 11,445 N 11,445
Source: The National Longitudinal Study of Adolescent Health
In previous research, mismatch was either coded dichotomously (yes/no) (Hanson 1994)
or continuously (Boxer et al. 2011). In both cases, however, only individuals with aspirations
8
adolescents (~8%) express aspirations that are lower than their expectations. This pattern of
“reverse mismatch” represents 23 percent of all aspiration/expectation discrepancies, validating
the need for a broader operational definition. Thus, while I follow (Boxer et al. 2011) strategy of
treating mismatch as a continuous variable, I include adolescents whose aspirations are lower
than expectations as well as those who exhibit the more common, opposite pattern.
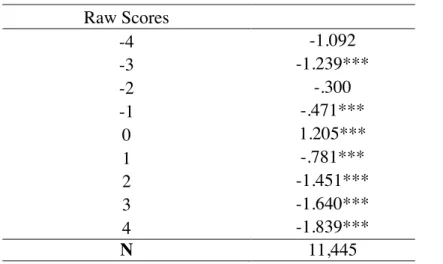
Table 2 further validates the coding strategy. Bivariate coefficients show that educational
attainment decreases as magnitude of mismatch increases for both positive and negative
mismatch scores. Thus, while the direction of aspiration-expectation mismatch does matter for
educational attainment (i.e., positive mismatch scores are associated with fewer years of
schooling than negative mismatch scores), focusing on the magnitude of mismatch effectively
demonstrates the overall pattern.
Table 2. Weighted Bivariate OLS Coefficients for Educational Attainment Differences by Magnitude of
Aspiration-Expectation Mismatch (N=11,445)
Raw Scores
-4 -1.092
-3 -1.239***
-2 -.300
-1 -.471***
0 1.205***
1 -.781***
2 -1.451***
3 -1.640***
4 -1.839***
N 11,445
Additional Variables: Adolescent Demographic Characteristics, Family Background Characteristics, and Adolescent School Experiences/Attitudes
All covariates come from Wave I of the survey and include adolescent demographic
characteristics, adolescent’s family background characteristics, and adolescent’s schooling
experiences and attitudes. Adolescent race is based on self-reports from the in-home interview. I
use a four-category classification: white, black, Asian, and American Indian/Other (Harris,
Perreira, and Lee 2009). Following recent scholarship in the study of the measurement of race
and ethnicity, I treat Hispanic/Latino as an ethnic category (Lee and Bean 2004; Perez and
Hirschman 2009; Perez 2007). For analysis, I group all adolescents who reported
Hispanic/Latino ethnicity and combine this category with the four-category race variable. Thus,
the final race classification includes non-Hispanic white, non-Hispanic black, non-Hispanic
Asian, non-Hispanic American Indian/Other, and Hispanic (Harris et al. 2009).
Adolescent’s family background characteristics include parental education, family
structure, perceived parental educational expectations, and parental involvement in
school-related activities. Parental education is included as a proxy for family socioeconomic status. It is
derived from the highest level of educational attainment between an adolescent’s parents and
ranges from “no school” to “professional training after college” (Harris and Ryan 2004).
Following the same method of coding used for adolescent educational attainment, I recode
parental education to its corresponding midpoint in years. Family structure distinguishes between
adolescents who lived in a household with (1) both of their biological parents or two adoptive
parents, (2) one biological parent and one non-biological parent, (3) a single parent, or (4) two
step parents or some other arrangement (Harris and Ryan 2004). Perceived parental educational
expectations is based on a survey instrument that asked adolescents, “On a scale of 1 to 5, where
10
from high school?” Parental involvement is based on three items asking adolescents whether
they had talked about school or worked on a school-related project with their (parent figure) in
the four weeks prior to the survey.
Adolescent schooling experiences include grade point average (GPA) and responses to
questions asking if they had ever repeated/been held back a grade, received out of school
suspension, or skipped school. Adolescent GPA corresponds to the average of adolescent
self-reports of their most recent grades in English/language arts, mathematics, history/social studies,
and science. Adolescent general attitudes about schooling are assessed via two standardized
composite measures. First, school connectedness (α=0.76) is assessed with a five-item scale adapted from other frameworks (Ozer 2005). The scale includes items like “I feel close to people
at my school” and “The teachers at my school treat students fairly.” Student engagement (α=.70) is assessed with two-items (Simons-Morton and Crump 2003), including “I have had trouble
paying attention in school,” and “I have had trouble getting my homework done.” Composite
scores are calculated and tested for consistency using Cronbach’s alpha values. The appendix
includes a full description of all variables included in analysis.
Sample Selection
The initial sample size for this study included 15,701 respondents who received
interviews at Wave I and Wave IV. Before analysis, however, several sequential sample
restrictions were necessary. First, to take Add Health’s complex survey design into account,
analyses were limited to respondents with valid sampling weights (n=14,800) (Chantala and
Tabor 2012). Only adolescents who were in school at Wave I (n=14,534) and had valid
responses for educational aspirations and expectations (n=14,466) were retained. Next,
Wave IV survey was administered (n=12,031). Finally, I used casewise deletion to address cases
with missing values for one or more of the included covariates. Thus, the full analytic sample
includes adolescents who were enrolled in middle or high school at Wave I, not enrolled in a
postsecondary program at Wave IV, and had values for educational attainment, aspirations,
expectations, and the included covariates (N=11,445).
I first report univariate and bivariate descriptive statistics for variables included in
analysis. Next, I report OLS regression coefficients for the relationship between educational
attainment and aspiration-expectation mismatch for the entire sample. Model 1 includes the
bivariate relationship between aspiration-expectation mismatch and educational attainment.
Given extant literature citing the independent effects of educational aspirations and expectations
on attainment (Morgan 2005; Museus et al. 2010), I account for aspirations and expectations in
Model 2. In Model 3, I add adolescent demographic characteristics. Model 4 adjusts for family
background characteristics, and Model 5 accounts for adolescents’ schooling experiences. The
final Model 6 includes adolescents’ general attitudes about schooling.
Because Add Health is a school-based survey and because post-secondary educational
attainment is associated with school-level characteristics such as geographic location (Garner
and Raudenbush 1991), school resources (Dearden, Ferri, and Meghir 2002), and institutional
practices (Oakes 2005; Tyson 2011), it is important to consider potentially significant variation
in long-term educational attainment between students who attended different childhood schools
as adolescents. This could manifest in many ways, including schools in particular regions
exhibiting higher aggregate levels of attainment (Ryan and Siebens 2012), schools from affluent
12
2012), or racialized tracking practices placing some students on different educational and
vocational pathways (Oakes 2005; Tyson 2011).
To assess this concern, I calculated the interclass correlation coefficient for educational
attainment. The coefficient for the analytic sample is 0.120, suggesting that about 90 percent of
the variation in educational attainment is within schools (i.e., between individuals). Thus,
although multi-level models are often ideal for analysis of nested data, they provide little added
value here because little of the variation in educational attainment is attributable to
between-school differences. Still it is necessary to account for Add Health’s stratified sampling strategy,
clustered sampling design, and nonresponse bias. I address potential design effects by using
appropriate sample weights and survey analysis techniques. Specifically, poststratification
sample weights ensure that population estimates at Wave IV conform to population estimates
from individuals eligible for Wave I interviews; thus results are representative of the US school
population in grades 7-12 in 1994-1995. In addition, I use software (e.g., STATA 12) that
incorporate stratum and cluster variables, which account for the stratified, clustering design
effects of Add Health
RESULTS
Descriptive Results
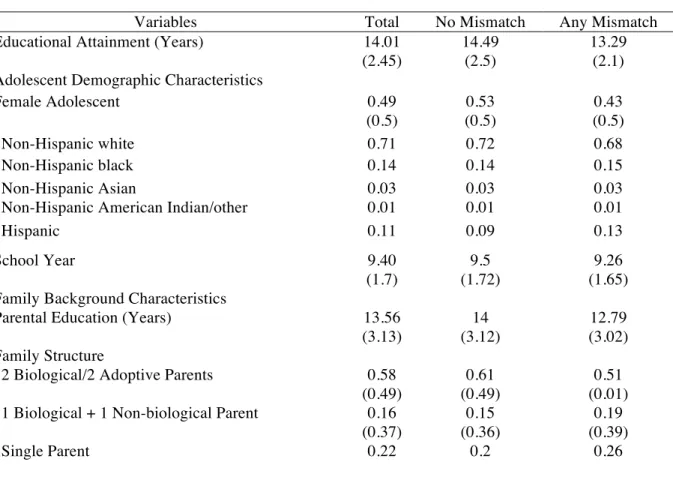
Descriptive statistics are reported in Table 3. Means and standard deviations are reported
for dichotomous and continuous variables. Proportions are reported for categorical variables (i.e.,
race). In general, adolescents expressed both high educational aspirations and expectations.
Eighty-three percent and seventy-six percent selected greater than a “3” for their aspirations and
expectations respectively. Further, the average response for both aspirations and expectations
respondents exhibited some level of aspiration-expectation mismatch. This demonstrates that
defining mismatch only in terms of aspirations that exceed expectations and limiting analyses to
high-achieving adolescents with expectations of a college degree underestimates the prevalence
of mismatch by greater than half.
By Wave IV, 71 percent of the sample had continued their education beyond high school.
Of those respondents who continued beyond high school, a third stopped their education at a
Bachelor’s degree, and about 13 percent continued to a post-baccalaureate program. These
respondents with a Bachelor’s degree or more constitute 43 percent of the entire sample. The
modal category for educational attainment was 14 years, the equivalent of “some college
(including vocational/technical training) but no four-year degree.”
Table 3. Weighted Means (and Standard Deviations) for Adolescent Demographic Characteristics, Family Background Characteristics, Adolescent Schooling Experiences, and Adolescent General
Schooling Attitudes (N=11,445)
Variables Total No Mismatch Any Mismatch Educational Attainment (Years) 14.01 14.49 13.29
(2.45) (2.5) (2.1) Adolescent Demographic Characteristics
Female Adolescent 0.49 0.53 0.43
(0.5) (0.5) (0.5)
*Non-Hispanic white 0.71 0.72 0.68
*Non-Hispanic black 0.14 0.14 0.15
*Non-Hispanic Asian 0.03 0.03 0.03
*Non-Hispanic American Indian/other 0.01 0.01 0.01
*Hispanic 0.11 0.09 0.13
School Year 9.40 9.5 9.26
(1.7) (1.72) (1.65) Family Background Characteristics
Parental Education (Years) 13.56 14 12.79
(3.13) (3.12) (3.02) Family Structure
2 Biological/2 Adoptive Parents 0.58 0.61 0.51 (0.49) (0.49) (0.01) 1 Biological + 1 Non-biological Parent 0.16 0.15 0.19
(0.37) (0.36) (0.39)
14
(0.42) (0.40) (0.44)
2 step Parents/Other 0.04 0.03 0.04
(0.19) (0.18) (0.2) Parental Educational Expectations 4.01 4.2 3.86 (1.22) (1.17) (1.27)
Parental Involvement 1.38 1.42 1.31
(1.00) (1.01) (0.99) Adolescent Schooling Experiences
Repeated a Grade 0.21 0.17 0.29
(0.41) (0.38) (0.45) Received Out of School Suspension 0.26 0.22 0.34
(0.44) (0.42) (0.47)
Expelled from School 0.04 0.028 0.056
(0.19) (0.17) (0.23)
Skipped School 0.27 0.23 0.33
(0.44) (0.42) (0.47)
Grade Point Average 2.8 2.94 2.56
(0.77) (0.74) (0.75) General Schooling Attitudes
School Connectedness 0.04 0.127 -.117
(1.00) (0.97) (1.03)
Student Engagement -.02 0.09 -.21
(1.00) (0.95) (1.06)
Aspirations 4.41 4.54 4.2
(1.05) (1.02) (1.05)
Expectations 4.14 4.54 3.46
(1.16) (1.02) (1.06)
Source: The National Longitudinal Study of Adolescent Health
Note: Weighted means and standard deviations are reported for dichotomous and continuous variables. *Proportions are presented for adolescent race.
Of adolescents exhibiting aspiration-expectation mismatch, about 43 percent were
female. The distribution of mismatch across racial groups mirrored that of the full sample, except
for among Hispanics, who were slightly overrepresented in the mismatch category. Adolescents
expressing mismatched aspirations and expectations indicated that they had more problem
experiences in school, reported lower grade point averages, less educated parents, lower
perceived parental educational expectations, and lower levels of parental involvement. This
pattern extended to postsecondary educational attainment, with adolescents exhibiting mismatch
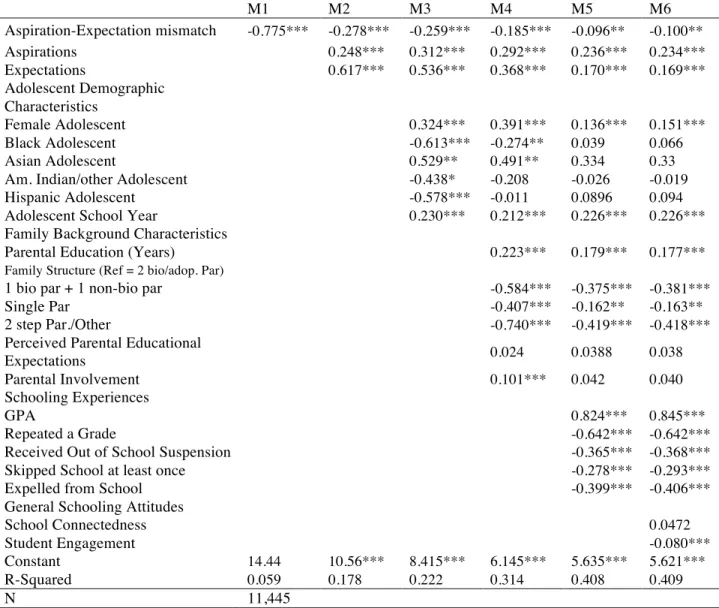
Multivariate Results
Weighted OLS coefficients are presented in Table 4. Bivariate results from Column 1
show that individuals who exhibit aspiration-expectation mismatch during adolescence go on to
earn fewer years of postsecondary educational attainment than their counterparts whose
aspirations match their expectations. Specifically, as the magnitude of aspiration-expectation
mismatch increases, whether aspirations are lower or higher than expectations, individuals earn
about .78 fewer years of educational attainment. Thus, an adolescent with an
aspiration-expectation mismatch value of “-2” or “2” (~8% of the entire sample) earns about one and one
half fewer years of educational attainment than their counterparts with no mismatch
Results in Column 2 show that more than a third of the mismatch effect persists even
after accounting for levels of aspirations and expectations directly. This highlights the
importance of assessing the interplay between these constructs in addition to their independent
influences. Column 3 shows that very little of the mismatch effect is explained by adolescent
background characteristics and that after including family background characteristics in the
model, 73 percent of the effect remains. Most of the effects of family background characteristics
are attributable to parental educational attainment and family structure. School experiences
explain about half of the remaining mismatch effect. That is, once adverse experiences in the
school environment (e.g., repeating a grade, receiving out of school suspension, etc.) are
accounted for, aspiration-expectation mismatch is less detrimental for overall levels of
educational attainment. Still, it remains important. Coefficients for the full model are included in
Column 6, and show that net of adolescent background characteristics, parent background,
16
expectations, aspiration-expectation mismatch remains detrimental to overall levels of
postsecondary educational attainment.
Table 4. Weighted OLS Coefficients for Educational Attainment Differences (N=11,445)
M1 M2 M3 M4 M5 M6
Aspiration-Expectation mismatch -0.775*** -0.278*** -0.259*** -0.185*** -0.096** -0.100**
Aspirations 0.248*** 0.312*** 0.292*** 0.236*** 0.234***
Expectations 0.617*** 0.536*** 0.368*** 0.170*** 0.169***
Adolescent Demographic Characteristics
Female Adolescent 0.324*** 0.391*** 0.136*** 0.151***
Black Adolescent -0.613*** -0.274** 0.039 0.066
Asian Adolescent 0.529** 0.491** 0.334 0.33
Am. Indian/other Adolescent -0.438* -0.208 -0.026 -0.019
Hispanic Adolescent -0.578*** -0.011 0.0896 0.094
Adolescent School Year 0.230*** 0.212*** 0.226*** 0.226***
Family Background Characteristics
Parental Education (Years) 0.223*** 0.179*** 0.177***
Family Structure (Ref = 2 bio/adop. Par)
1 bio par + 1 non-bio par -0.584*** -0.375*** -0.381***
Single Par -0.407*** -0.162** -0.163**
2 step Par./Other -0.740*** -0.419*** -0.418***
Perceived Parental Educational
Expectations 0.024 0.0388 0.038
Parental Involvement 0.101*** 0.042 0.040
Schooling Experiences
GPA 0.824*** 0.845***
Repeated a Grade -0.642*** -0.642***
Received Out of School Suspension -0.365*** -0.368***
Skipped School at least once -0.278*** -0.293***
Expelled from School -0.399*** -0.406***
General Schooling Attitudes
School Connectedness 0.0472
Student Engagement -0.080***
Constant 14.44 10.56*** 8.415*** 6.145*** 5.635*** 5.621***
R-Squared 0.059 0.178 0.222 0.314 0.408 0.409
N 11,445
Source: The National Longitudinal Study of Adolescent Health *** p<0.01, ** p<0.05, * p<0.1 (two-tailed)
DISCUSSION
Adding to current findings documenting the independent effects of aspirations and
expectations on educational outcomes (Andrew and Hauser 2011; Beal and Crockett 2010;
show that adolescents attain fewer years of postsecondary education when these attitudes do not
align. The effect of aspiration-expectation mismatch persists after accounting for demographic
and family background characteristics as well as schooling experiences and attitudes.
Importantly, although independent measures of aspirations and expectations account for a large
proportion of the mismatch effect, they do not completely explain it away. Thus, this study
suggests that in addition to examining schooling attitudes independently, it is important to
consider how they relate to each other, especially when they do not align.
Given the prevalence of aspiration-expectation mismatch among US adolescents and its
implications for educational attainment, it is important to consider its potential underlying
determinants. While these processes were not the focus of the present study, findings do provide
some clues. First, after accounting for independent measures of aspirations and expectations,
adolescent schooling experiences explain the largest percentage of the mismatch effect,
suggesting that something occurs within schools that generates mismatched beliefs about one’s
academic future. One possible source is the disciplinary policies and practices instituted in
schools. Students may interpret multiple encounters with school sanctioning and other negative
experiences like academic failure as an indicator of their future academic potential and develop
mismatched beliefs (e.g., aspirations that exceed expectations) that reflect this uncertainty. Given
literature suggesting that students from disadvantaged backgrounds are more likely than their
counterparts to receive in-school sanctioning and/or be held back/repeat a grade (Entwisle et al.
2007; Kao and Tienda 1998; Pascoe 2011), this may serve to widen extant achievement
disparities.
Adolescents may also exhibit aspirations that are lower than their expectations. In this
18
family members who expect them to serve as a source of economic capital (Harding 2010;
MacLeod 1995). This pressure could cultivate feelings of ambivalence about future schooling
pathways such that adolescents may begin to expect to achieve higher levels of attainment than
they actually aspire to. To be sure, adolescents whose aspirations are lower than their
expectations could represent an entirely different, more advantaged, population of adolescents. In
this case, because advantaged youth rely less on education for economic and occupational
mobility (Mangino 2012), they may develop high educational expectations that comply with
family norms, both in terms of parental expectations and educational attainment, while also
maintaining more modest aspirations. These explanations seem plausible given that family
background characteristics explained the second largest proportion of mismatch effect, although
perceived parental educational expectations were not significant in any of the models.
Limitations/Future Research
Given past findings that there are racial and gender differences in the expression of
school-related attitudes (Downey et al. 2009; Harris 2010, 2011; Lopez 2003; Mickelson 1990)
and differential returns to these attitudes along lines of race (Downey et al. 2009), findings from
this study should be extended to include race and gender comparisons. For example, both black
and female students attribute value to schooling and maintain positive attitudes about their
educational and occupational future although they expect to encounter structural obstacles
(Harris 2010, 2011; Lopez 2003; MacLeod 1995; Tyson, Darity, and Castellino 2005). Do these
patterns extend to aspiration-expectation mismatch? That is, are black and/or female youth less
likely to express mismatched aspirations and expectations than their counterparts? Are they less
Next, while this study provides strong evidence that the magnitude of
aspiration-expectation mismatch has robust effects on educational attainment, it does not include a test of
whether direction of mismatch is also important. For example, do adolescents whose aspirations
exceed their expectations earn more or less education than their counterparts whose aspirations
are lower than their expectations? While bivariate results from Table 1 provide some evidence,
additional analysis is needed. Further, what are the characteristics of adolescents with aspirations
that are lower than their expectations? Are they more or less advantaged than their counterparts?
Finally, future analyses should use more sophisticated modeling techniques (e.g.,
multi-level models) that account for between-school variation in educational attainment. While the
interclass correlation coefficient for educational attainment suggests that much of the variation in
educational attainment occurs between individuals and not between schools, it is still useful to
consider school-level characteristics in analyses. This would allow for a more direct assessment
of the role that structural process, including institutional practices (Oakes 2005; Tyson 2011),
play in the prevalence and effect of aspiration-expectation mismatch.
CONCLUSION
School-related attitudes are important mechanisms in the educational attainment process.
They represent student motivation and often times reflect students’ social location and personal
experiences. This study demonstrates that discordance between these beliefs during adolescence
may translate to fewer years of educational attainment in early adulthood. Findings also raise
new questions about the structural processes that cultivate this mismatch and whether or not its
effect differs across lines of race and gender. Given the prevalence of aspiration-expectation
20
its micro and macro determinants may provide new insights on the persistence of achievement
Appendix A. Description and Coding Information for Variables Included in Analysis
Variable Descriptions Question Wording/Coding
Independent Variable(s)
Educational Aspirations On a scale of 1 to 5, where 1 is low and 5 is high, how much do you want to go to college?
Educational Expectations On a scale of 1 to 5, where 1 is low and 5 is high, how likely is it that you will to go to college?
Dependent Variable Wave IV Educational
Attainment What is your highest level of education that you have achieved?
Original Response Wording Recoded Response
8th Grade or Less 4 Years
Some High School 10 Years
High School Graduate 12 Years
Some Vocational/Technical Training (after High School) 13 Years
Completed Vocational/Technical Training (after High School) 14 Years
Some College 14 Years
Completed College (BA Degree) 16 Years
Some Graduate School 17 Years
Completed a Master's Degree 18 Years
Some Graduate Training Beyond an MA 20 years
Completed a Doctoral Degree 22 Years
Some Post Bacc./Professional Education (Law School, Med. School) 20 years Completed Post Bacc./Professional Education (Law School, Med.
School) 22 Years
Adolescent Characteristics
Gender 1 = Female, 0=Not Female
Race non-Hispanic white
non-Hispanic black non-Hispanic Asian
non-Hispanic American Indian/other Hispanic
School Year 7th - 12th Grade
Family Characteristics
Parental Education Original Response Wording Recoded
Response
8th Grade or Less 4 Years
>8th Grade/Vocational School 10 Years
GED 11 Years
High School Graduate 12 Years
Vocational School/Not Completed College 14 Years
Completed college (BA Degree) 16 years
22
Family Structure 2 biological parents/2 adoptive parents
1 biological parent + 1 other non-biological parent Single parent
2 step parents/other
Perceived Parental Educational Expectations
On a scale of 1 to 5, where 1 is low and 5 is high, how disappointed would (your mom) be if you did not graduate from college?
On a scale of 1 to 5, where 1 is low and 5 is high, how disappointed would (your dad) be if you did not graduate from college?
Parental Involvement Which of the things listed on this card have you done with your
(mother/adoptive mother/stepmother/foster mother/etc.) in the past 4 weeks
talked about yoru school work or grade worked on a project for school
talked about other thing you're doing at school
Adolescent Schooling Experiences
Adolescent GPA Average based on self-reports to the following question: At the (most recent
grading period/last grading period in the spring), what was your grade in…
English Mathematics Social Studies Science
Repeated a Grade Have you ever repeated a grade or been held back a grade?
1 = Yes 0=No
Received Out of School
Suspension Have you ever received an out-of-school suspension from school?
1 = Yes 0=No
Skipped School at least once
During this school year how many times have you been absent from school for a full day without an excuse?
1 = At least once 0=Never
Expelled from School Have you ever been expelled from school?
1 = Yes 0=No
General Schooling Attitudes
School Connectedness Standardized Composite Variable: Since School started this year, how often
have you had trouble
paying attention in school? getting your homework done?
Student Engagement Standardized Composite Variable:
You feel close to people at your school. You feel like you are part of your school. You are happy to be at your school.
The teachers at your school treat students fairly. You feel safe in your school.
Source: The National Longitudinal Study of Adolescent Health, 1994-95
REFERENCES
Andrew, Megan, and Robert M. Hauser. 2011. “Adoption? Adaptation? Evaluating the Formation of Educational Expectations.” Social Forces 90(2):497–520.
Beal, Sarah J., and Lisa J. Crockett. 2010. “Adolescents’ Occupational and Educational Aspirations and Expectations: Links to High School Activities and Adult Educational Attainment.” Developmental psychology 46(1):258.
Bennett, Pamela R., Amy C. Lutz, and Lakshmi Jayaram. 2012. “Beyond the Schoolyard The Role of Parenting Logics, Financial Resources, and Social Institutions in the Social Class Gap in Structured Activity Participation.” Sociology of Education 85(2):131–57.
Bourdieu, Pierre. 1973. “Cultural Reproduction and Social Reproduction.” in Knowledge, Education and Cultural Change: Papers in the Sociology of Education
[contributed to the Annual Conference of the British Sociological Association Held at the University of Durham, 7-10 April 1970], vol. 2, edited by Richard K. Brown. New York: Taylor & Francis.
Bowles, Samuel, and Herbert Gintis. 1976. Schooling in Capitalist America: Educational Reform and the Contradictions of American Life. New York: Basic Books.
Boxer, Paul, Sara E. Goldstein, Tahlia DeLorenzo, Sarah Savoy, and Ignacio Mercado. 2011. “Educational Aspiration-expectation Discrepancies: Relation to
Socioeconomic and Academic Risk-related Factors.” Journal of adolescence 34(4):609–17.
Chantala, Kim, and Joyce Tabor. 2012. “Strategies to Perform a Design-based Analysis Using the Add Health Data.” Carolina Population Center, University of North Carolina at Chapel Hill, Chapel Hill, NC.
Collins, Randall. 1971. “Functional and Conflict Theories of Educational Stratification.” American Sociological Review 1002–19.
Dearden, Lorraine, Javier Ferri, and Costas Meghir. 2002. “The Effect of School Quality on Educational Attainment and Wages.” Review of Economics and Statistics 84(1):1–20.
Downey, Douglas B., James W. Ainsworth, and Zhenchao Qian. 2009. “Rethinking the Attitude-achievement Paradox Among Blacks.” Sociology of Education 82(1):1– 19.
Duncan, Otis Dudley, David L. Featherman, and Beverly Duncan. 1972. “Socioeconomic Background and Achievement.” New York: Seminar Press.
24
Entwisle, Doris R., Karl L. Alexander, and Linda S. Olson. 2007. “Early Schooling: The Handicap of Being Poor and Male.” Sociology of Education 80(2):114–38. Fordham, Signithia, and John U. Ogbu. 1986. “Black Students’ School Success: Coping
with the ‘burden of “acting White.”’” The urban review 18(3):176–206.
Fryer Jr, Roland G., and Paul Torelli. 2010. “An Empirical Analysis of ‘acting White’.” Journal of Public Economics 94(5):380–96.
Fuller, Wayne A. 2009. Measurement Error Models. Wiley.com.
Garner, Catherine L., and Stephen W. Raudenbush. 1991. “Neighborhood Effects on Educational Attainment: A Multilevel Analysis.” Sociology of education 251–62.
Goyette, Kimberly A. 2008. “College for Some to College for All: Social Background, Occupational Expectations, and Educational Expectations over Time.” Social Science Research 37(2):461–84.
Haller, Archibald O. 1982. “Reflections on the Social Psychology of Status Attainment.” Social structure and behavior: Essays in honor of William Hamilton Sewell 3–28.
Hanson, Sandra L. 1994. “Lost Talent: Unrealized Educational Aspirations and Expectations Among US Youths.” Sociology of education 159–83.
Harding, David J. 2010. Living the Drama: Community, Conflict, and Culture Among Inner-city Boys. University of Chicago Press.
Harris, Angel L. 2010. “Gender, Perceptions of Opportunity, and Investment in Schooling.” Growing Gaps: Educational Inequality around the World: Educational Inequality around the World 284.
Harris, Angel L. 2011. Kids Don’t Want to Fail: Oppositional Culture and the Black-White Achievement Gap. Cambridge, Mass.: Harvard University Press.
Harris, Kathleen Mullan. 2009. “The National Longitudinal Study of Adolescent Health (Add Health), Waves I & II, 1994–1996; Wave III, 2001–2002; Wave IV, 2007– 2009 [machine-readable Data File and Documentation].” Chapel Hill, NC: Carolina Population Center, University of North Carolina at Chapel Hill.
Harris, Kathleen Mullan, Krista M. Perreira, and Dohoon Lee. 2009. “Obesity in the Transition to Adulthood: Predictions Across Race/ethnicity, Immigrant Generation, and Sex.” Archives of pediatrics & adolescent medicine 163(11):1022.
Kao, Grace, and Jennifer Thompson. 2003. “Racial and Ethnic Stratification in
Educational Achievement and Attainment.” Annual review of sociology 29:417– 42.
Kao, Grace, and Marta Tienda. 1998. “Educational Aspirations Among Minority Youth.” American Journal of Education 106:349–84.
Kerckhoff, Alan C. 1976. “The Status Attainment Process: Socialization or Allocation?” Social Forces 55(2):368–81.
Lee, Jennifer, and Frank D. Bean. 2004. “America’s Changing Color Lines: Immigration, Race/Ethnicity, and Multiracial Identification.” Annual Review of Sociology 30(1):221–42.
Lopez, Nancy. 2003. Hopeful Girls, Troubled Boys: Race and Gender Disparity in Urban Education. Routledge New York.
MacLeod, Jay. 1995. Ain’t No Makin’it: Aspirations and Attainment in a Low-income Neighborhood. Westview Press Boulder, CO.
Mangino, William. 2012. “Why Do Whites and the Rich Have Less Need for Education?” American Journal of Economics and Sociology 71(3):562–602.
Mello, Zena R. 2009. “Racial/ethnic Group and Socioeconomic Status Variation in Educational and Occupational Expectations from Adolescence to Adulthood.” Journal of Applied Developmental Psychology 30(4):494–504.
Mickelson, Roslyn Arlin. 1990. “The Attitude-achievement Paradox Among Black Adolescents.” Sociology of education 44–61.
Morgan, Stephen Lawrence. 2005. On the Edge of Commitment: Educational Attainment and Race in the United States. Stanford University Press.
Museus, Ph D., Ph D. Harper, and Ph D. Nichols. 2010. “Racial Differences in the Formation of Postsecondary Educational Expectations: A Structural Model.” Teachers College Record 112(3):811–42.
Oakes, Jeannie. 2005. Keeping Track: How Schools Structure Inequality. Yale University Press.
Ozer, Emily J. 2005. “The Impact of Violence on Urban Adolescents Longitudinal Effects of Perceived School Connection and Family Support.” Journal of Adolescent Research 20(2):167–92.
26
Perez, Anthony D. 2007. “Who Is HIspanic? Shades of Ethnicity Among Latino/a Youth.” Social Forces 86(2):561–77.
Perez, Anthony Daniel, and Charles Hirschman. 2009. “The Changing Racial and Ethnic Composition of the US Population: Emerging American Identities.” Population and Development Review 35(1):1–51.
Reynolds, John R., and Chardie L. Baird. 2010. “Is There a Downside to Shooting for the Stars? Unrealized Educational Expectations and Symptoms of Depression.” American Sociological Review 75(1):151–72.
Ryan, Camille L., and Julie Siebens. 2012. “Educational Attainment in the United States: 2009.” Current Population Reports: February 2012.
Sewell, William H., Archibald O. Haller, and George W. Ohlendorf. 1970. “The
Educational and Early Occupational Status Attainment Process: Replication and Revision.” American Sociological Review 1014–27.
Sewell, William H., Archibald O. Haller, and Alejandro Portes. 1969. “The Educational and Early Occupational Attainment Process.” American Sociological Review 82– 92.
Shryock, Henry S., Jacob S. Siegel, and Elizabeth A. Larmon. 1980. The Methods and Materials of Demography. Department of Commerce, Bureau of the Census.
Simons-Morton, Bruce G., and Aria Davis Crump. 2003. “Association of Parental Involvement and Social Competence with School Adjustment and Engagement Among Sixth Graders.” Journal of School Health 73(3):121–26.
Spenner, Kenneth I., and David L. Featherman. 1978. “Achievement Ambitions.” Annual review of sociology 4:373–420.
Sum, Andrew et al. 2003. The Growing Gender Gaps in College Enrollment and Degree Attainment in the US and Their Potential Economic and Social Consequences. Center for Labor Market Studies, Northeastern University Boston, MA.
Trusty, Jerry, and Spencer G. Niles. 2004. “Realized Potential or Lost Talent: High School Variables and Bachelor’s Degree Completion.” The Career Development Quarterly 53(1):2–15.
Tyson, Karolyn. 2011. Integration Interrupted: Tracking, Black Students, and Acting White after Brown. Oxford University Press, USA.
Tyson, Karolyn, William Darity, and Domini R. Castellino. 2005. “It’s Not ‘a Black Thing’: Understanding the Burden of Acting White and Other Dilemmas of High Achievement.” American Sociological Review 70(4):582–605.