Standardized Tobacco Assessment for Retail Settings
(STARS): dissemination and implementation research
Lisa Henriksen,
1Kurt M Ribisl,
2Todd Rogers,
3Sarah Moreland-Russell,
4Dianne M Barker,
5Nikie Sarris Esquivel,
3Brett Loomis,
3Erin Crew,
1Todd Combs
4▸Additional material is published online only. To view please visit the journal online (http://dx.doi.org/10.1136/ tobaccocontrol-2016-053076).
1Stanford Prevention Research
Center, Stanford University School of Medicine, Stanford, California, USA
2Gillings School of Global
Public Health, University of North Carolina—Chapel Hill, Chapel Hill, North Carolina, USA
3
RTI International, Research Triangle Park, North Carolina, USA
4Center for Public Health
Systems Science, Brown School of Social Work, Washington University in St. Louis, St., Louis, Missouri, USA
5
Barker Bi-Coastal Health Consultants, Calabasas, California, USA
Correspondence to
Dr Lisa Henriksen, Stanford Prevention Research Center, Stanford University School of Medicine, Stanford, CA 94305-5705, USA; [email protected]
Received 28 May 2016 Accepted 27 June 2016
To cite:Henriksen L, Ribisl KM, Rogers T,et al. Tob Control2016;25:i67– i74.
ABSTRACT
Objective The Standardized Tobacco Assessment for Retail Settings (STARS) was designed to characterise the availability, placement, promotion and price of tobacco products, with items chosen for relevance to regulating the retail tobacco environment. This study describes the process to develop the STARS instrument and protocol employed by a collaboration of US government agencies, US state tobacco control programmes (TCPs), advocacy organisations, public health attorneys and researchers from the National Cancer Institute’s State and Community Tobacco Control (SCTC) Research Initiative.
Methods To evaluate dissemination and early implementation experiences, we conducted telephone surveys with state TCP leaders (n=50, response rate=100%), and with individuals recruited via a STARS download registry on the SCTC website. Website registrants were surveyed within 6 months of the STARS release (n=105, response rate=66%) and again after
∼5 months (retention rate=62%).
Results Among the state TCPs, 42 reported conducting any retail marketing surveillance, with actual or planned STARS use in 34 of these states and in 12 of the 17 states where marketing surveillance was not previously reported. Within 6 months of the STARS release, 21% of surveyed registrants reported using STARS and 35% were likely/very likely to use it in the next 6 months. To investigate implementationfidelity, we compared data collected by self-trained volunteers and by trained professionals, the latter method being more typically in retail marketing surveillance studies. Results suggest high or moderate reliability for most STARS measures.
Conclusion The study concludes with examples of states that used STARS to inform policy change.
INTRODUCTION
Point of sale is the dominant channel for tobacco industry marketing, and the widespread availability of tobacco products and the visibility of tobacco mar-keting at the point of sale remain a significant public health concern, particularly in the poorest countries and communities.1 2 In the USA, there were
∼375 000 tobacco retailers in 2013,3and the largest
tobacco companies spent $8.6 billion (91% of annual marketing dollars) to increase the visibility of tobacco products at the point of sale and to reduce their price.4 More youth and young adults recall seeing
tobacco marketing in stores than any other channel.5 Such exposure encourages youth to start smoking6 7
and makes it more difficult for smokers to quit.8 9 For these reasons, regulating the retail environment for tobacco is an increasing priority for many state and local tobacco control programmes (TCPs).10
Monitoring tobacco industry activity in the retail environment is essential to evidence-based policy-making and enforcement. However, tobacco control research and practice lacks a standardised, widely used measure for retail marketing surveillance.11
For example, the Nutrition Environment Measures Survey12 has >150 citations, but the most
fre-quently cited instruments that assess retail tobacco marketing have six or fewer citations.11An
access-ible, standard instrument is needed to make compar-isons within and between jurisdictions, and to inform evidence-based policymaking in the USA and in other countries. The current study addresses this significant gap in the literature.
The National Cancer Institute (NCI) established the State and Community Tobacco Control (SCTC) Research Initiative to address high-priority research gaps, including tobacco industry marketing and pro-motion as well as tax and pricing policies. A steering committee of SCTC investigators—led by researchers from Stanford Prevention Research Center (SPRC), the University of North Carolina at Chapel Hill, RTI International and the University of Illinois at Chicago, and other partners, including five state TCPs, the Centers for Disease Control and Prevention (CDC) Office on Smoking and Health and the Tobacco Control Legal Consortium—developed the Standardized Tobacco Assessment for Retail Settings (STARS) survey and training materials in 2013–2014 (see online supplementary appendix). The main innovation of the present study is to examine system-atically the dissemination and implementation of STARS, the first surveillance tool for retail tobacco marketing that was designed for practitioners to inform state and local tobacco control policy efforts.
OVERVIEW AND PURPOSE OF STARS
A 2002 National Tobacco Monitoring, Research and Evaluation Workshop reviewed and identified improvements to the existing infrastructure for tobacco surveillance and evaluation.13Focusing on
STARS was designed to be a rapidly deployable, low-cost method to assess retail tobacco product marketing and provide observational data to inform tobacco control policy, planning and practice. STARS was not intended to replace rigorous retail tobacco surveillance and evaluation efforts that have been employed by and for many state TCPs, including California,13
Florida,14 Massachusetts15 and New York,16 and conducted in other countries;2 17–19 rather, as illustrated in the policy
cross-walk (figure 1), STARS was designed to inform policy options for regulating the retail environment.
The STARS policy crosswalk is organised around the 4P’s of marketing: product availability, promotion, placement and price, and also addresses policies that regulate ‘place’ (eg, the type and location of stores that sell tobacco). STARS items (column 2) are grouped where a single policy could address var-iations in the same general policy problem. For instance, in the
first row of the Promotion section, items 6a–6f ask about exter-ior ads for cigarettes, menthol cigarettes, cigarillos, cigars, chew and e-cigarettes. If exterior advertisements for one or all of these products are a particularly pervasive problem in specific jurisdictions, or if partners deem outdoor advertising restrictions
as a politically feasible option from their localised knowledge and experience, a content-neutral policy that restricts the quan-tity of advertising on store windows and doors could advance tobacco control efforts.
The third column of the policy crosswalk offers examples of how to use the data collected with STARS, such as comparing the availability of specific products across neighbourhoods, near schools or between different types of stores. Summary data from STARS are meant to inform policy responses identified in the last column. For example, if STARS assessors document especially low prices for the cheapest pack of cigarettes, one solution would be to establish or strengthen state or local laws that increase minimum prices.20
Released in June 2014 on the SCTC website (http:// sctcresearch.org), STARS included a two-page PDF form, self-guided training materials (a 91-slide PowerPoint file and a 12-page Pocket Guide for field use) and an Excel data entry widget. The training materials were based on those developed by SPRC for the California TCP.21Dissemination activities were designed to reach an audience of state and local health depart-ments and tobacco control advocacy organisations. Activities
included webinars and teleconferences organised by CDC’s Office on Smoking and Health with state TCPs and national partners, pointers to the SCTC website from others (eg, http:// www.CounterTobacco.Org and http://www.Tobacconomics.org), email announcements to key non-governmental agencies (eg, Campaign for Tobacco-Free Kids) as well as social media post-ings (Twitter and Facebook).
Instrument development
The steering committee selected STARS items from candidate measures that had previously demonstrated reliability and policy relevance. For example, the committee deliberated whether STARS measures should include a count of tobacco advertise-ments, because such measures are widely used and informative in some contexts.2However, the quantity of advertising did not seem amenable to state and local policymaking, because inevitable legal challenges to regulating commercial speech in the USA22defy the
old adage that‘What gets measured gets changed’. Other candi-date items for STARS were generated by the steering committee, drawing from the literature and experience with retail observa-tions. Reliability data were gleaned from publications,23–28report
to state TCPs,29and the authors’unpublished data.30 31
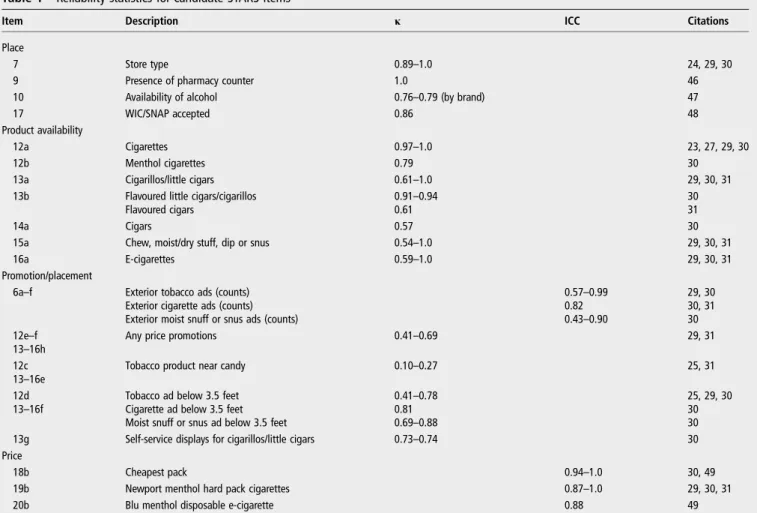
Table 1summarises reliability statistics for the candidate items for STARS, many of which were extracted from studies that used trained professional data collectors. For categorical measures, Cohen’sκ and per cent agreement were obtained or assessed.32
Intraclass correlation coefficients (ICC) assessed inter-rater reli-ability for continuous measures, such as price.33Consistent with
reports from a systematic review,11items about the availability of cigarettes, generally, and menthol cigarettes, specifically, were the most reliable (κ 0.79–1.0). Measuring the availability of other tobacco products was less reliable in some studies (seetable 1). One challenge for novice data collectors is that many tobacco companies promote cigarette and non-cigarette tobacco products with the same brand name.34 In addition, lower reliability obtained for the presence of e-cigarettes may be because these products were relatively new, and reliability may improve as the products become more prevalent. Items that characterise other attributes of the store environment, such as store type and phar-macy counter, were also reliable (seetable 1).
To assess price promotions more reliably, STARS captures their presence or absence for each item, without requiring data collectors to categorise types of promotions, such as single-pack or volume price discounts. Among the three items about placement of products and advertising, the presence of tobacco products near candy was the least reliable (κ 0.10–0.27), although per cent agreement indicated higher reliability in one study (see table 1). For price of cigarettes and e-cigarettes, Newport (the leading menthol cigarette), cheapest cigarette pack (regardless of brand) and a disposable e-cigarette (Blu, the leading brand when STARS was developed) all exhibited high reliability (ICC 0.87–1.0).
Table 1 Reliability statistics for candidate STARS items
Item Description κ ICC Citations
Place
7 Store type 0.89–1.0 24, 29, 30
9 Presence of pharmacy counter 1.0 46
10 Availability of alcohol 0.76–0.79 (by brand) 47
17 WIC/SNAP accepted 0.86 48
Product availability
12a Cigarettes 0.97–1.0 23, 27, 29, 30
12b Menthol cigarettes 0.79 30
13a Cigarillos/little cigars 0.61–1.0 29, 30, 31
13b Flavoured little cigars/cigarillos 0.91–0.94 30
Flavoured cigars 0.61 31
14a Cigars 0.57 30
15a Chew, moist/dry stuff, dip or snus 0.54–1.0 29, 30, 31
16a E-cigarettes 0.59–1.0 29, 30, 31
Promotion/placement
6a–f Exterior tobacco ads (counts) 0.57–0.99 29, 30
Exterior cigarette ads (counts) 0.82 30, 31
Exterior moist snuff or snus ads (counts) 0.43–0.90 30 12e–f
13–16h
Any price promotions 0.41–0.69 29, 31
12c 13–16e
Tobacco product near candy 0.10–0.27 25, 31
12d 13–16f
Tobacco ad below 3.5 feet 0.41–0.78 25, 29, 30
Cigarette ad below 3.5 feet 0.81 30
Moist snuff or snus ad below 3.5 feet 0.69–0.88 30
13g Self-service displays for cigarillos/little cigars 0.73–0.74 30 Price
18b Cheapest pack 0.94–1.0 30, 49
19b Newport menthol hard pack cigarettes 0.87–1.0 29, 30, 31
20b Blu menthol disposable e-cigarette 0.88 49
Cell entries are Cohen’sκor intraclass correlation coefficients. The Special Supplemental Nutrition Programme for Women, Infants and Children (WIC) provides federal grants to states for supplemental foods, healthcare referrals and nutrition education for low-income pregnant, breastfeeding and non-breastfeeding postpartum women, and to infants and children up to age 5 who are found to be at nutritional risk. Supplemental Nutrition Assistance Programme (SNAP) offers nutrition assistance to millions of eligible, low-income individuals and families and provides economic benefits to communities. Reliability for this item was obtained in combination with the presence of other signage.
A few items with unknown reliability (eg, tobacco products sold as single units, tobacco products advertised for less than $1, cross-product promotions and presence of signs with graphic health warnings) were included in STARS because of their relevance to state and local policymaking, such as increas-ing minimum package size, establishincreas-ing/increasincreas-ing minimum price and mandating countermarketing at the point of sale.35
Six states (Colorado, Indiana, Kansas, Massachusetts, Oregon and Texas) volunteered to pilot test STARS in a total of∼300 stores. The average completion time was <10 min per store (M=9.7, SD=5.6). Based on feedback from pilot testing, the
final instrument included a new item about the availability of little cigars/cigarillos for less than $1, and the form was revised to improve question order and data entry format for prices (see online supplementary appendix).
DISSEMINATION AND IMPLEMENTATION RESEARCH
Following a framework for dissemination and implementation research,36 the substudies reported here address dissemination
reach, implementationfidelity and diffusion. To study dissemin-ation reach, we conducted a telephone survey of individuals who registered to download STARS from the SCTC website. To study implementationfidelity, we examined the degree to which self-trained data collectors using the STARS instrument could obtain reliable measures by examining measurement concord-ance with professionally trained data collectors in the same stores. To study the diffusion of STARS, we surveyed state TCP leaders ∼1 year after STARS was released. Each substudy is described in the following sections.
STARS user registry survey
Following a protocol approved by the Institutional Review Board at the Stanford University School of Medicine and the University of North Carolina, the website registry asked
potential users to provide consent to be contacted for a survey, and to select from a list of reasons for downloading STARS.
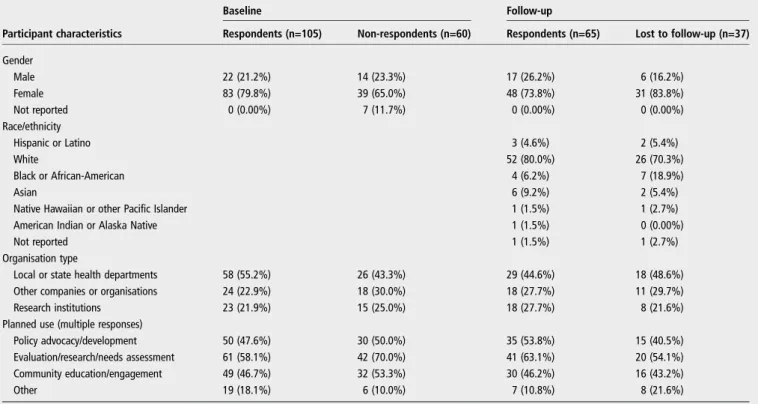
Between June 2014 and January 2015, there were 180 unique downloads of STARS from the SCTC website and the 171 registered users that agreed to be surveyed comprised the sample. Baseline surveys were conducted ∼4 months from the participants’ registry date, and follow-up surveys were con-ducted∼5 months after baseline. Excluding 15 cases that could be not be contacted (eg, invalid email, changed organisation or unable to download STARS), 105 registered users completed a 15-min telephone survey at baseline (response rate=66%). After excluding 17 cases who were ineligible (eg, left employment or email address failure), the retention rate at follow-up was 62%.
The baseline survey contained 33 questions about the use and opinions of STARS, including prior experience using store audits, experience with or planned use of the STARS form and accompanying materials, intentions for using the collected data and tobacco control policy priorities. The follow-up survey was identical to baseline with additional questions about the useful-ness of additional resources to inform the future development of STARS: training videos, a document that links STARS ques-tions to policy strategies, and optional modules for vape shops as well e-cigarettes and other ENDS.
Results
Participants from 46 states and from India, Costa Rica and the US territory Palau completed the telephone survey at baseline.
Table 2 compares characteristics of participants and non-respondents at baseline and follow-up. At baseline, the majority of participants (55.2%) were from local or state health depart-ments, 21.9% were from research institutions and 22.9% were from other organisations.
Among the 105 respondents at baseline, 21% of participants reported using STARS and 35% reported being likely or very
Table 2 Characteristics of STARS user registry survey participants
Baseline Follow-up
Participant characteristics Respondents (n=105) Non-respondents (n=60) Respondents (n=65) Lost to follow-up (n=37)
Gender
Male 22 (21.2%) 14 (23.3%) 17 (26.2%) 6 (16.2%)
Female 83 (79.8%) 39 (65.0%) 48 (73.8%) 31 (83.8%)
Not reported 0 (0.00%) 7 (11.7%) 0 (0.00%) 0 (0.00%)
Race/ethnicity
Hispanic or Latino 3 (4.6%) 2 (5.4%)
White 52 (80.0%) 26 (70.3%)
Black or African-American 4 (6.2%) 7 (18.9%)
Asian 6 (9.2%) 2 (5.4%)
Native Hawaiian or other Pacific Islander 1 (1.5%) 1 (2.7%)
American Indian or Alaska Native 1 (1.5%) 0 (0.00%)
Not reported 1 (1.5%) 1 (2.7%)
Organisation type
Local or state health departments 58 (55.2%) 26 (43.3%) 29 (44.6%) 18 (48.6%) Other companies or organisations 24 (22.9%) 18 (30.0%) 18 (27.7%) 11 (29.7%) Research institutions 23 (21.9%) 15 (25.0%) 18 (27.7%) 8 (21.6%) Planned use (multiple responses)
Policy advocacy/development 50 (47.6%) 30 (50.0%) 35 (53.8%) 15 (40.5%) Evaluation/research/needs assessment 61 (58.1%) 42 (70.0%) 41 (63.1%) 20 (54.1%) Community education/engagement 49 (46.7%) 32 (53.3%) 30 (46.2%) 16 (43.2%)
Other 19 (18.1%) 6 (10.0%) 7 (10.8%) 8 (21.6%)
likely to use STARS in the next 6 months. This subset of respon-dents reported three primary uses for STARS: 32% would use the data to inform policy change or educate decision makers; 21% to raise awareness about retail tobacco marketing and 19% to conduct retailer surveillance (eg, report writing and mapping). Most users (71%) either customised STARS or planned to do so, either by programming for electronic data col-lection or by adding more items about e-cigarettes, alcohol or food. A few users reported omitting items, such as collecting prices, which sometimes require interaction with a store clerk.
Among the 65 respondents at follow-up, 14 had used STARS at baseline. Of the 51 participants who had not used STARS at baseline, 12 (18%) had used STARS since baseline assessment, 12 (18%) planned to use it within 6 months, 21 (32%) reported intended to use STARS in the future and 6 (9%) reported that they would never use it. Combining responses from baseline and follow-up, we estimated that 82% of the user registry either used STARS or were likely to use it in the future. This estimate assumed that particpants who did not use STARS at baseline, and were lost to follow-up, would never use STARS.
Between 58% and 88% of respondents rated each additional resource as being very useful. Practitioners were as interested as researchers in additional modules for e-cigarettes and vape shops, which is consistent with state TCP surveys about priori-tising regulation of e-cigarettes.37 38Both of these modules are under development. Users also identified a few barriers to implementation: underestimating the importance of field prac-tice before data collection and a desire for more technical assist-ance, with analysis and with guidance on how to use the data in their community.
IMPLEMENTATION FIDELITY OF THE STUDY
STARS is intended to be implemented by self-trained data col-lectors, and was developed with the expectation that independ-ent use of the STARS form, protocol and supporting materials, without technical assistance from the developers, would yield valid and reliable estimates of the retail tobacco marketing envir-onment. It was not known, however, how the quality of data collected with STARS would compare to data collected by trained, professional data collectors. To assess the measurement concordance between self-trained and professional data collec-tors, an intermethod reliability study was conducted in New York State in conjunction with the 2014 New York Retailer Advertising Tobacco Survey.16
Methods
A convenience sample of 160 stores from a probability sample of licensed tobacco retailers was visited by a professional data collector and by a self-trained data collector. Data collectors visited stores independently during July–October 2014, with an average of 42 days between the two visits (range 0–73 days). Professional data collectors used an electronic data collection instrument modified to include a subset of 45 STARS survey items; the self-trained data collectors used the paper-and-pencil STARS instrument.
Data from professional and self-trained data collectors were matched based on reported store name and address. A total of 14 stores were dropped from the sample for the following reasons: non-matching store name or address (n=4), store does not sell tobacco (n=3), unsafe neighbourhood (n=2), store does not exist (n=2), store closed when data collector visited (n=2) and store burned down (n=1). The final sample included 146 tobacco retailers located throughout New York State, with the greatest concentration in New York City. Item-specific
concordance between self-trained and professional data collec-tors was assessed using percentage agreement and Cohen’sκfor categorical variables, and percentage agreement and ICC for continuous variables. Since κ is sensitive to the distribution of responses, known as the κ paradox,32 we also include for context the measure distribution by source (ie, self-trained vs professional data collectors) and percentage agreement. Our data are similar to Shrout-Fleiss’s ICC Model 1 because each store was rated by a different set of data collectors.33 ICCs are scaled from 0 (no agreement) to 1 ( perfect agreement); however, negative ICCs and ICCs >1 are possible.
Results
Box 1summarises the strength of intermethod reliability (concord-ance of self-trained with professionally trained data collectors), categorising several measures as having‘High’reliability (κor ICC
≥0.80; or κ≤0.20 and percentage agreement ≥90%), moderate reliability (κ≥0.30 or ICC <0.80) or‘Low’reliability (κ>−1.0 or ICC<0.30). The majority of STARS measures were found to have high or moderate reliability, with data collected by self-trained observers yielding values consistent with those of trained, profes-sional, data collectors.39 Some items that involve judgements about distance (for product placement), recognising the presence of promotions and identifying product prices were less reliable, which might be explained by the∼6-week average delay between store visits by professional and self-trained data collectors.
Diffusion study: state TCP leader survey
Methods
State TCP leaders were contacted by email for recruitment and scheduling, and then participated in 30-min, semistructured
Box 1 Summary of Standardized Tobacco Assessment for Retail Settings item reliability between self-trained and professionally trained data collectors: New York State (2014)
High reliability*
▸ Cigars, smokeless tobacco within 12 inches of gum, candy and toys;
▸ Price of Newport menthol pack;
▸ Price of cheapest cigarette pack.
Moderate reliability†
▸ Presence of exterior advertising for cigarettes, cigars, smokeless tobacco or e-cigarettes;
▸ Presence offlavoured cigars, smokeless tobacco or e-cigarettes;
▸ E-cigarettes within 12 inches of gum, candy and toys.
Low reliability‡
▸ Cigarettes within 12 inches of gum, candy and toys;
▸ Cigarettes, cigars, smokeless tobacco or e-cigarettes placed at or below child’s eye level;
▸ Price of blu menthol e-cigarettes.
▸ Presence of price promotions for cigarettes, menthol cigarettes, cigars, smokeless tobacco or e-cigarettes. *High reliability is defined as:κor intraclass correlation coefficients≥0.80; orκ≤0.20 and percentage agreement
≥90%.
†Moderate reliability is defined as:κ≥0.30 or intraclass correlation coefficients <0.80.
telephone interviews about tobacco control activities. The recruitment and survey procedures are described elsewhere.3
Interviewers asked about the policy environment, prior experi-ence with retail marketing surveillance and frequent or occa-sional use of several point-of-sale resources, including STARS. Responses from state TCP leaders (n=50, response rate=100%) were coded to indicate if state or local groups conduct either one-time or routine marketing surveillance, and what instru-ment was used.
Results
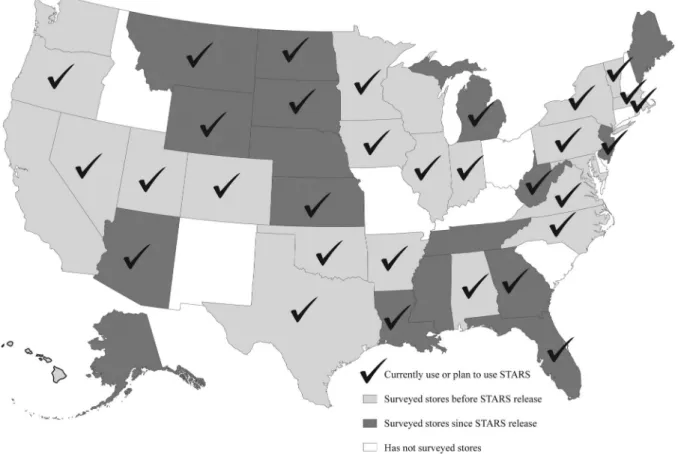
In 2015, 64% of state TCP leaders reported using STARS or planned to do so (seefigure 2). In the subset of 42 states where retail marketing surveillance was underway or planned, 32 either used or planned to use STARS. Among the 17 states that
first conducted tobacco retail marketing surveillance since STARS was released in 2014, 12 of reported that they currently used STARS or planned to use it in the future.
Four of these states were featured in case studies about how STARS was used to inform policy change.30Noticing a
prolifer-ation of vape shops around the state’s colleges and universities, student leaders from the‘Peers Against Tobacco’programme at the University of Texas at Austin used STARS to document the availability of e-cigarettes. In Indiana and Oregon, STARS was used to raise awareness about youth exposure to retail tobacco marketing and disparities among different neighbourhoods, and between rural and urban environments. Vermont incorporated STARS into a statewide, comprehensive audit of retailers.
These case studies illustrated how STARS had been be used by different audiences, including youth, college students, com-munity partners, local and state health departments. They
demonstrated that the instrument can be modified readily: All four sites added more detailed items that were important in their communities, such as e-hookah near Texas colleges and smokeless tobacco in Indiana. In the Texas case study, STARS was also customised for electronic data collection. Users in Oregon and Vermont integrated STARS with nutrition, alcohol and lottery audits, which eased implementation and increased the scope of dissemination.
The four sites employed various dissemination efforts for their STARS results. In Texas, Peers Against Tobacco shared results at campus events in order to campaign for 100% tobacco-free campus policies. In Indiana, results were presented through community forums and middle schools. County health departments in Oregon presented STARS results to County Boards and earned media coverage,40 whereas the state public health agency featured STARS results on its website and Facebook page. Representatives of Vermont’s‘Counter Balance’ campaign held a press event to announce the STARS results and earned television, print and online media coverage. In all four cases, STARS data helped to dramatise the need for policy change.
CONCLUSIONS
This research described the development, dissemination and implementation of STARS, which was designed with the object-ive of increasing state and local capacity to conduct retail tobacco marketing surveillance to inform policy change. STARS dissemination activities achieved broad reach (downloaded by users in 46 US states and several countries globally), and found its intended audience: nearly half of registry participants were from state and local health departments. Results from surveys
suggested that the majority of registered users intended to use STARS results to raise awareness or advance policy goals.
This research also provides evidence of good implementation
fidelity. Self-trained data collectors obtained reliable data from STARS, and measures with low reliability were generally those assessing product price and price promotions, which tend vary over time to reflect industry marketing activities. The reliability of these items might be improved if training materials include more detailed examples and practice questions. Alternative modalities, such as brief, web-based training videos, may also help to improve the reliability of data collected by self-trained observers. If reliability remains low for certain measures even after training improvements, then these may need to be revised or removed from STARS. Hiring and training residents of disad-vantaged neighbourhoods to conduct marketing surveillance in nearby stores have been a successful strategy.41 Future research
should evaluate advantages of collaborating with youth and other priority populations for collecting data with STARS.
Results from a survey of state TCP leaders found that more than half of states now use or plan to use STARS. Its launch coincided with a burst of local and state policy activity in the retail setting.10 Reports of customising STARS were common,
such as modifying the brands for which prices were collected, adding items about alcohol and assessing availability of fresh fruit/vegetables and energy drinks. Research is needed to evalu-ate the extent to which additional time spent in stores decreases completion rates or decreases reliability when a more complex instrument demands additional training for data collectors.
Beyond the dissemination and implementation examples documented in this research, STARS has been used to evaluate a sales restriction onflavoured tobacco products,42and to docu-ment tobacco marketing strategies at stores in tribal jurisdic-tions.43 STARS was also added to the PhenX Measures for Tobacco Regulatory Research, which is intended to enhance cross-study analysis in large-scale research to inform tobacco regulation.44In addition, practitioners could use STARS to raise
awareness about lower prices for menthol cigarettes, greater availability of cheap little cigars/cigarillos and other disparities in tobacco marketing by neighbourhood race/ethnicity and income. Finally, a vape shop version, vSTARS, and e-cigarette version, eSTARS will be released in summer 2016.
A strength of this multicomponent, coordinated dissemination and implementation research is the focus on different types of end users: state TCP leaders, individuals who downloaded the tool and materials from the user registry and self-trained data collectors. A limitation of this research is that the user registry survey investigated the 39.5% of unique page views that down-loaded STARS, which was a relatively small and self-selected
sample of early adopters. More research over a longer time period is needed to understand the global diffusion and applica-tions of STARS to inform and evaluate policy change.45
Given the importance of the retail environment to the tobacco industry’s overall marketing strategies,4 sustained use and refinement of STARS will improve state and local capacity to document changes in industry efforts as well as inform place-based tobacco control strategies and tobacco regulatory approaches that mitigate the influence of tobacco product mar-keting in the retail setting.
Acknowledgements The authors gratefully acknowledge the collaborative developmental funding from NCI’s State and Community Tobacco Control Initiative, U01-CA154281, U01-CA154248 and U01-CA154241. The funding agency had no part in the study design, data collection, analysis, interpretation or decision to publish. The STARS steering committee members were: Kirsten Aird, Oregon Public Health Division; Kate Armstrong, Tobacco Control Legal Consortium; Dianne Barker, Barker Bi-Coastal Health Consultants; Lisa Henriksen, Stanford Prevention Research Center, Michael Johns, New York City Department of Health and Mental Hygiene; Harlan Juster, New York State Department of Public Health; Lois Keithly, Massachusetts Department of Public Health; Brian King, Office on Smoking and Health CDC; Brett Loomis, RTI International; Maggie Mahoney, Tobacco Control Legal Consortium; Allison Myers, Counter Tobacco; Kurt Ribisl, University of North Carolina Chapel Hill; April Roeseler, California Tobacco Control Program; Todd Rogers, RTI International; Stephanie Walton, Colorado Department of Public Health and Environment. Thanks are due to Kimberly Watson for data analysis, Nina Parikh for managing pilot testing, and to Kimberly Ababseh and Trent Johnson for manuscript preparation.
Contributors LH, KMR, TR and DMB designed the studies; SM-R, TC, BL, NSE and EC managed data collection and analyses. All authors contributed to the manuscript draft and revised for critical content.
Funding National Cancer Institute’s State and Community Tobacco Control Initiative (U01-CA154241; U01-CA154281; U01-CA154248).
Competing interests None declared.
Ethics approval Stanford University School of Medicine, University of North Carolina at Chapel Hill, and Washington University at St Louis.
Provenance and peer reviewNot commissioned; externally peer reviewed.
Open Access This is an Open Access article distributed in accordance with the Creative Commons Attribution Non Commercial (CC BY-NC 4.0) license, which permits others to distribute, remix, adapt, build upon this work non-commercially, and license their derivative works on different terms, provided the original work is properly cited and the use is non-commercial. See: http://creativecommons.org/ licenses/by-nc/4.0/
REFERENCES
1 Lee JG, Henriksen L, Rose SW,et al. A systematic review of neighborhood disparities in point-of-sale tobacco marketing.Am J Public Health2015;105: e8–18.
2 Savell E, Gilmore AB, Sims M,et al. The environmental profile of a community’s health: a cross-sectional study on tobacco marketing in 16 countries.Bull World Health Organ2015;93:851–861G.
3 Center for Public Health Systems Science. Point-of-sale report to the nation: the tobacco retail and policy landscape. St. Louis, MO: Center for Public Health Systems Science at the Brown School at Washington University in St. Louis and the National Cancer Institute, State and Community Tobacco Control Research Initiative, 2014. 4 Federal Trade Commission. Federal Trade Commission Cigarette Report for 2013. 2016. https://www.ftc.gov/system/files/documents/reports/federal-trade-commission-cigarette-report-2013/2013cigaretterpt.pdf
5 Agaku IT, King BA, Dube SR. Trends in exposure to pro-tobacco advertisements over the Internet, in newspapers/magazines, and at retail stores among U.S. middle and high school students, 2000–2012.Prev Med2014;58:45–52.
6 Henriksen L, Schleicher NC, Feighery EC,et al. A longitudinal study of exposure to retail cigarette advertising and smoking initiation.Pediatrics2010;126: 232–8.
7 Robertson L, Cameron C, McGee R,et al. Point-of-sale tobacco promotion and youth smoking: a meta-analysis.Tob Control. Published Online First: 4 Jan 2016. doi:10.1136/tobaccocontrol-2015-052586
8 Reitzel LR, Cromley EK, Li Y,et al. The effect of tobacco outlet density and proximity on smoking cessation.Am J Public Health2011;101:315–20. 9 Young-Wolff KC, Henriksen L, Delucchi K,et al. Tobacco retailer proximity and
density and nicotine dependence among smokers with serious mental illness. Am J Public Health2014;104:1454–63.
What this paper adds
▸ Numerous studies in the USA and many other countries use retail surveillance research to examine tobacco industry marketing practices.
▸ Tobacco control research and practice lacks a standardised instrument for measuring changes over time, comparing results across jurisdictions and informing evidence-based policymaking.
10 Luke DA, Sorg AA, Combs T,et al. The Tobacco Retail Policy Landscape: a longitudinal survey of US States. Under review for SCTC Science supplement.Tob Control2016;25: i44–51.
11 Lee JG, Henriksen L, Myers AE,et al. A systematic review of store audit methods for assessing tobacco marketing and products at the point of sale.Tob Control 2014;23:98–106.
12 Glanz K, Sallis JF, Saelens BE,et al. Nutrition Environmental Survey in stores (NEMS-S): development and evaluation.Am J Prev Med2007;32:282–9. 13 Cruz TB. Monitoring the tobacco use epidemic IV. The vector: tobacco industry data
sources and recommendations for research and evaluation.Prev Med2009;48(1 Suppl):S24–34.
14 Loomis BR, Herbert CJ, Dench DL,et al.Highlights from the Florida retail advertising tobacco survey 2013. Prepared for Bureau of Tobacco Free Florida, 2013. 15 Laws MB, Whitman J, Bowser DM,et al. Tobacco availability and point of sale
marketing in demographically contrasting districts of Massachusetts.Tob Control 2002;11(Suppl 2):ii71–73.
16 Kim AE, Loomis BR, Busey AH,et al. Influence of retail cigarette advertising, price promotions, and retailer compliance on youth smoking-related attitudes and behaviors.J Public Health Manag Pract2013;19:E1–9.
17 Gong T, Lv J, Liu Q,et al. Audit of tobacco retail outlets in Hangzhou, China.Tob Control2013;22:245–9.
18 Hall MG, Kollath-Cattano C, Reynales-Shigematsu LM,et al. Inter-rater reliability of measures to characterize the tobacco retail environment in Mexico.Salud Publica Mex2015;57:514–18.
19 Mistry R, Pednekar M, Pimple S,et al. Banning tobacco sales and advertisements near educational institutions may reduce students’tobacco use risk: evidence from Mumbai, India.Tob Control2015;24:e100–107.
20 McLaughlin I, Pearson A, Laird-Metke E,et al. Reducing tobacco use and access through strengthened minimum price laws.Am J Public Health2014;104:1844–50. 21 Healthy Stores for a Healthy Community. 2015. http://www.healthystoreshealthy
community.com/
22 Lange T, Hoefges M, Ribisl KM. Regulating tobacco product advertising and promotions in the retail environment: a roadmap for states and localities.J Law Med Ethics2015;43:878–96.
23 Bernstein SL, Cabral L, Maantay J,et al. Disparities in access to over-the-counter nicotine replacement products in New York City pharmacies.Am J Public Health 2009;99:1699–704.
24 Devlin E, Anderson S, Borland R,et al. Development of a research tool to monitor point of sale promotions.Soc Mark Q2006;12:29–39.
25 Feighery EC, Ribisl KM, Schleicher N,et al. Cigarette advertising and promotional strategies in retail outlets: results of a statewide survey in California.Tob Control 2001;10:184–8.
26 Henriksen L, Feighery EC, Schleicher NC,et al. Reaching youth at the point of sale: cigarette marketing is more prevalent in stores where adolescents shop frequently. Tob Control2004;13:315–18.
27 Hosler AS, Dharssi A. Reliability of a survey tool for measuring consumer nutrition environment in urban food stores.J Public Health Manag Pract2011;17:E1–8. 28 Jason LA, Pokorny SB, Mikulski K,et al. Assessing storefront tobacco advertising
after the billboard ban.Eval Health Prof2004;27:22–33.
29 Schleicher NC, Johnson TO, Dauphinee AL,et al.Tobacco Marketing in California’s Retail Environment (2008–2011). Final report for the California Tobacco Advertising Survey (2011) Submitted to the California Tobacco Control Program, California Department of Public Health, 2013. https://www.cdph.ca.gov/programs/tobacco/ Documents/Resources/Publications/CTAS11-FinalReport-FINAL%20APPROVED.pdf 30 Barker DC, Jackson K, Rimkus L. Bridging the Gap Community Obesity
Measures Project, Tobacco Store Observation Form Reliability Table.unpublished data2009.
31 Center for Public Health Systems Science.Assessing retail environments with STARS. George Warren Brown School of Social Work at Washington University in St. Louis
and the Tobacco Control Legal Consortium, 2015. http://cphss.wustl.edu/Products/ ProductsDocuments/ASPiRE_2015_STARS_Report.pdf
32 Feinstein AR, Cicchetti DV. High agreement but low kappa: I. The problems of two paradoxes.J Clin Epidemiol1990;43:543–9.
33 Shrout PE, Fleiss JL. Intraclass correlations: uses in assessing rater reliability.Psychol Bull1979;86:420–8.
34 Mejia AB, Ling PM. Tobacco industry consumer research on smokeless tobacco users and product development.Am J Public Health2010;100:78–87. 35 Coady MH, Chan CA, Auer K,et al. Awareness and impact of New York City’s
graphic point-of-sale tobacco health warning signs.Tob Control2013;22:e51–56. 36 Proctor E, Silmere H, Raghavan R,et al. Outcomes for implementation research:
conceptual distinctions, measurement challenges, and research agenda.Adm Policy Ment Health2011;38:65–76.
37 Center for Public Health Systems Science. Point-of-Sale Report to the Nation: Realizing the Power of State and Communities to Change the Tobacco Retail and Policy Landscape. 2016. http://cphss.wustl.edu/Products/Documents/ASPiRE_2014_ ReportToTheNation.pdf
38 Schmitt CL, Lee YO, Curry LE,et al. Research support for effective state and community tobacco control programme response to electronic nicotine delivery systems.Tob Control2014;23(Suppl 3):iii54–57.
39 Esquivel NS, Liedtke CD, Watson KA,et al. Reliability of self-trained data collection for tobacco retail surveillance: STARS dissemination and implementation research. Paper presented at: American Public Health Association’s 143rd Annual Meeting & Exposition. November 2015, Chicago, IL: 2015.
40 Murray M.Tobacco placement targets teens in county. Hermiston Herald, 2015. http://www.hermistonherald.com/hh/local-news/20150203/tobacco-placement-targets-teens-in-county
41 Flood J, Minkler M, Hennessey Lavery S,et al. The collective impact model and its potential for health promotion: overview and case study of a Healthy Retail Initiative in San Francisco.Health Educ Behav2015;42:654–68.
42 Slater SJ, Barker DC, Bontu A,et al. Evaluating implementation of Chicago’s city ordinance restricting sales offlavored tobacco products near schools.Annual Meeting for SRNT2016. http://tobacconomics.org/research/evaluating- implementation-of-chicagos-city-ordinance-restricting-sales-of-flavored-tobacco-products-near-schools/
43 Leischow SJ, Henderson PN, Laux F,et al.Implementing STARS in Indian Country: observations and experiences society for research on nicotine and tobacco. Chicago, IL: 2016.
44 PhenX Toolkit.Standardized Tobacco Assessment for Retail SettingsJune 24, 2015; A surveillance instrument for observational measures of point-of-sale tobacco marketing, including product availability, advertising, promotions, and price. 2016. https://www.phenxtoolkit.org/index.php?pageLink=browse.protocols&id=741000 45 Siripachot P, Wongsuriyanan S, Hamann S. Development andfindings from an
instrument for retail point of sale assessment in youth-frequented locations in Thailand.Paper presented at: Annual Meeting of the Society for Research on Nicotine & Tobacco. March 2016, Chicago, IL: 2016.
46 Rimkus L, Powell LM, Zenk SN,et al. Development and reliability testing of a food store observation form.J Nutr Educ Behav2013;45:540–8.
47 Cohen DA, Schoeff D, Farley TA,et al. Reliability of a store observation tool in measuring availability of alcohol and selected foods.J Urban Health2007;84:807–13. 48 Ghirardelli A, Quinn V, Sugerman S,et al. Reliability of a retail food store survey
and development of an accompanying retail scoring system to communicate survey findings and identify vendors for healthful food and marketing initiatives.J Nutr Educ Behav2011;43:S104–112.