Body Size Measures, Hemostatic and Inflammatory Markers and
Risk of Venous Thrombosis: the Longitudinal Investigation of
Thromboembolism Etiology
Mary Cushman, MD, MSca, Ellen S. O’Meara, PhDb, Susan R. Heckbert, MD, PhDc, Neil A. Zakai, MD, MSca, Wayne Rosamond, PhDd, and Aaron R. Folsom, MDe
aUniversity of Vermont
bGroup Health Research Institute cUniversity of Washington
dUniversity of North Carolina, Chapel Hill eUniversity of Minnesota
Abstract
Objective—Obesity is an important venous thrombosis (VT) risk factor but the reasons for this are unclear.
Materials and Methods—In a cohort of 20,914 individuals aged 45 and older without prior VT, we calculated the relative risk (RR) of VT over 12.6 years follow-up according to baseline body size measures, and studied whether associations were mediated by biomarkers of hemostasis and inflammation that are related to adiposity.
Results—Greater levels of all body size measures (weight, height, waist, hip circumference, calf circumference, body-mass index, waist-hip ratio, fat mass and fat-free mass) were associated with increased risk of VT, with 4th versus 1st quartile RRs of 1.5–3.0. There were no multiplicative interactions of biomarkers with obesity status. Adjustment for biomarkers associated with VT risk (factor VIII, von Willebrand factor, partial thromboplastin time, D-dimer and factor XI) only marginally lowered, or did not impact, the RRs associated with body size measures.
Conclusions—Greater body size, by multiple measures, is a risk factor for VT. Associations were not mediated by circulating levels of studied biomarkers suggesting that body size relates to VT because of physical factors associated with blood flow, not the hypercoagulability or
inflammation associated with adiposity.
Corresponding Author: Mary Cushman, MD, MSc, Departments of Medicine and Pathology, Cardiovascular Research Institute, University of Vermont, 360 South Park Drive, Colchester, VT 05446, Phone: 802-656-8968, Fax: 802-656-8956,
Publisher's Disclaimer: This is a PDF file of an unedited manuscript that has been accepted for publication. As a service to our
customers we are providing this early version of the manuscript. The manuscript will undergo copyediting, typesetting, and review of the resulting proof before it is published in its final citable form. Please note that during the production process errors may be discovered which could affect the content, and all legal disclaimers that apply to the journal pertain.
HHS Public Access
Author manuscript
Thromb Res
. Author manuscript; available in PMC 2017 August 01.Published in final edited form as:
Thromb Res. 2016 August ; 144: 127–132. doi:10.1016/j.thromres.2016.06.012.
A
uthor Man
uscr
ipt
A
uthor Man
uscr
ipt
A
uthor Man
uscr
ipt
A
uthor Man
uscr
Keywords
venous thrombosis; risk factor; obesity; blood coagulation; inflammation
Obesity is epidemic worldwide, with little evidence of improvement in recent years[1]. Other than age, obesity is the major atherosclerotic risk factor associated with risk of venous thrombosis (VT)[2–9]. In 2008 the United States Surgeon General called for more research on the reasons for an association of obesity with VT[10] yet few studies have
comprehensively assessed obesity as a VT risk factor by including evaluation of many body size measures or by assessing mediating factors for associations of obesity with VT.
Mechanisms linking obesity to VT are speculative. The association may be due to physical factors related to obesity such as impaired venous return, biochemical effects of adipose tissue such as enhanced inflammation or hypercoagulability, or venous vessel wall alterations.
In the Longitudinal Investigation of Thromboembolism Etiology (LITE) we previously reported that obesity (BMI >30 kg/m2) was associated with a 2-fold higher risk of future VT[4]. With longer follow up and more than 200 additional VT events, we report here more detail on associations of body size measures, hemostasis and inflammation with VT. We hypothesized that several measures of body size are positively associated with VT risk and that the body fat component is more strongly related than non-fat mass. Under a hypothesis that adipose tissue directly influences the inflammatory and procoagulant state, we expected some degree of mediation of associations of body size by levels of hemostasis and
inflammation markers.
Methods
Subjects
LITE is a prospective population-based study of 21,680 participants of the Cardiovascular Health Study (CHS) and the Atherosclerosis Risk in Communities (ARIC) study[11]. Both studies examined risk factors at baseline and followed participants for cardiovascular diseases. Detailed methods have been published[11]. In 1987–89, 15,792 men and women 45–64 years of age were enrolled in ARIC; 27% were African American. In 1989–90, 5,201 men and women age 65–100 were enrolled in CHS, and 687 African American participants were enrolled in 1992–93. Six communities are represented in LITE: Forsyth County, North Carolina; Jackson, Mississippi; suburbs of Minneapolis, Minnesota; Washington County, Maryland; Sacramento County, California; and Pittsburgh, Pennsylvania. All participants provided written informed consent with methods approved by local institutional review committees.
At baseline, extensive information was collected using standardized methods, including medical history, medication use, measured height, weight, waist circumference, and hip circumference. BMI was calculated as weight in kg / height in m2, and waist-hip ratio was calculated. ARIC also measured calf circumference at the widest point of the right calf while the participant sat high enough that their feet did not touch the floor. CHS measured fat mass
A
uthor Man
uscr
ipt
A
uthor Man
uscr
ipt
A
uthor Man
uscr
ipt
A
uthor Man
uscr
and fat-free (lean) mass using bioelectric impedance with participants in the supine position wearing standard clothing[12]. Resistance was measured with a TVI-10 Body Composition Analyzer (Danninger Medican Technology Inc, Columbus, OH) at 50 kHz. Fat-free mass was estimated using the formula of Deurenberg: 6710*height2/(R + 3.1*S + 3.9), where R is resistance in ohms and S is sex (0 for women, 1 for men)[13]. Fat mass was calculated as the difference between weight and fat-free mass. Obesity status was categorized as normal, overweight, obese and severely obese by BMI <25, 25–30, 30–40, and 40+ kg/m2, respectively. The latter two categories were combined for some analyses. Elevated waist circumference was defined as ≥88 cm in women and ≥102 cm in men. Waist and hip circumferences, waist-hip ratio, fat and fat-free mass and calf circumference were also analyzed as continuous variables or in sex-specific quartiles of the distribution. Race was categorized as black and non-black. Diabetes was defined as fasting glucose ≥126 mg/dL, non-fasting glucose ≥200 mg/dL, use of diabetes medications or self-reported diabetes.
The two studies maintained longitudinal contact with participants to identify all hospitalizations. Potential cases of hospitalized VT were identified from ICD discharge codes and validated by medical record review by two physicians as previously reported[11]. VT events included deep vein thrombosis (DVT) and pulmonary embolism (PE).
Classification as VT required positive imaging. VT cases ascertained in both cohorts with complete follow up through the end of 2001 (when CHS follow up for VT stopped) were included in this analysis. Cases were defined as provoked if they were associated with cancer, major trauma, surgery or marked immobility, and as unprovoked otherwise.
Laboratory Methods
For some hemostasis and inflammation factors, levels were measured in all participants of both cohorts. For others, a nested case-control study was used to randomly select two controls per case, frequency-matched to the cases by 5-year age group, sex, race (African-American, white), follow-up time, and study (ARIC, CHS) [14].
In ARIC and CHS, fasting morning blood samples were obtained at baseline. Blood was centrifuged at 4°C, and plasma frozen at −70°C until analysis in central laboratories. Baseline levels of fibrinogen, factor VII and VIII coagulant activity (FVIIc, FVIIIc), and were measured, and in ARIC only, the activated partial thromboplastin time (aPTT), protein C and von Willebrand factor were measured, as previously described[15, 16]. Both studies measured white blood count at laboratories near each field center. In CHS only, baseline C-reactive protein (CRP) and interleukin-6 (IL-6) were measured in the full cohort with high-sensitivity assays[17]. In the nested case-control sample D-dimer was measured by immunoturbidometry using the Liatest D-dimer assay on the STAR analyzer (Diagnostica Stago) and factor XI by sandwich enzyme-linked immunoassay using reagents with affinity purified polyclonal antibodies from Enzyme Research Laboratories (South Bend, IN).
Statistical Methods
We excluded 729 participants reporting either prebaseline VT (n=590) or baseline warfarin use (n=185). Incidence rates were estimated as the number of VT events divided by the total number of person-years at risk. Some analyses only included one study (ARIC or CHS) if
A
uthor Man
uscr
ipt
A
uthor Man
uscr
ipt
A
uthor Man
uscr
ipt
A
uthor Man
uscr
variables of interest were only available in one study. Spearman correlation coefficients among study variables were calculated in the full cohort (or control group only for D-dimer and factor XI). In the full cohort, Cox regression models were used to estimate adjusted relative risks (hazard ratios) and 95% confidence intervals of VT associated with body size measures. In the nested case-control study, logistic regression was used to calculate odds ratios as estimates of relative risk. All models were adjusted for baseline age, sex and race. To assess whether biomarkers mediated the relationship of body size with VT we first ruled out presence of interactions between biomarkers and body size by using interaction terms in each model (all p interaction >0.05; supplementary table). We then used multivariable models adding the biomarkers and examined change in relative risk for the body size measure. Stratification was used for some analyses by whether the VT was provoked or unprovoked and by type of VT (DVT or PE+/−DVT). Differences in associations of body size measures by whether the outcome was DVT versus PE were assessed using the method of van Langervelde[18], concluding that associations were larger for PE than DVT if the RRPE/RRDVT was >2.0 and that they were larger for DVT than PE if this ratio was <1.0.
Results
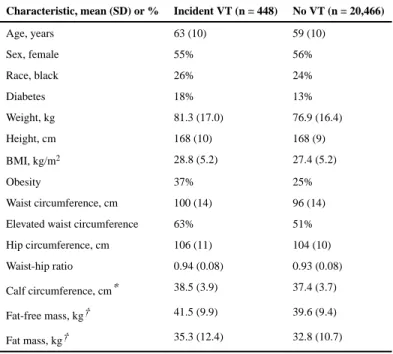
With a median 12.6 years of follow up the incidence rate of first VT was 1.8 per 1,000 person-years. Table 1 shows baseline characteristics of the 448 participants with first-time VT (269 in ARIC, 179 in CHS) and the 20,466 participants without VT. Older age and diabetes were more prevalent among cases and each body size measurement was larger among cases on average, except height, which was similar. Figure 1 shows the crude incidence rates for ARIC and CHS separately by categories of body size. There was a monotonically greater incidence of VT across BMI categories and quartiles of weight, waist circumference in ARIC, waist-hip ratio, and calf circumference (measured in ARIC only), but not height in either cohort and not waist circumference in the older CHS cohort, for which there was a J-shaped relationship. In the younger ARIC participants VT rates ranged from 0.7 to 1.0 per 1000 person years in the bottom category of each factor to 1.7 to 2.6 per 1000 in the top category. Corresponding rates in the older CHS participants were 2.3 to 2.5 per 1000, up to 3.3 to 6.2 per 1000. The inset in figure 1 shows that VT incidence rates in CHS also increased across categories of fat mass and fat-free mass, although for fat mass the rate was lower in the 3rd quartile than the 1st and 2nd.
Figure 2 shows associations of biomarkers with body size measures. The largest associations were direct associations of inflammation sensitive proteins with higher body size, and inverse associations of FXI with height and fat-free mass. The largest correlation was for CRP and fat mass in CHS participants, at 0.30. In CHS participants biomarkers tended to have direct associations with fat mass and inverse associations with fat free mass. D-dimer was weakly associated or unassociated with body size measures.
Table 2 shows the relative risk of VT for categories of each body size measure and biomarker combining CHS and ARIC since associations were similar by study (data not shown). All models were adjusted for age, sex and race. For all body size measures, there was a greater risk of VT across increasing categories of body size. The fourth versus first quartile adjusted relative risks ranged from 1.5 for height to 2.6 for weight. The adjusted
A
uthor Man
uscr
ipt
A
uthor Man
uscr
ipt
A
uthor Man
uscr
ipt
A
uthor Man
uscr
relative risk also increased across obesity status categories. For elevated versus normal waist circumference the relative risk was 1.7 (95% CI 1.4–2.1). Interpretations of the findings did not differ for any body size measure when analyses were limited to participants with complete biomarker data. Among the hemostasis and inflammation markers, higher levels of factors VII, VIII, XI, von Willebrand factor, D-dimer, CRP (marginally) and lower aPTT were associated with greater risk of VT, while the other factors were not.
There was no appreciable difference in the associations of body size measures with overall compared to unprovoked VTE (data not shown). As shown in table 3, RRs of body size measures were larger for events that were PE+/−DVT compared to DVT alone, although absolute risk differences were mostly similar across exposures. Severe obesity was the only body size category that conferred more than a 2-fold greater RR for PE+/−DVT than for DVT, suggesting this exposure is more strongly related to PE+/−DVT. These relative risk estimates were less precise for measures performed only in CHS or only in ARIC, but patterns were similar except for fat-free mass, which had a similar association with DVT and PE+/−DVT (data not shown).
We next evaluated whether adjustment for biomarkers related to VT risk mediated the association of body size measures with VT risk. Analyses assessed the relative risk of VT associated with a 1-SD increment of each body size measure (estimates shown in table 2). Including both ARIC and CHS, in models including age, sex and race, adjustment of body size measures for factor VII and factor VIII only trivially changed the relative risks of VT, with trivial defined as <0.1 unit change in relative risk. In the ARIC cohort addition of factors VII, VIII, aPTT and von Willebrand factor to the models resulted in a 0.1 unit attenuation of the relative risks per SD for weight, BMI, hip circumference and waist-hip ratio, and the other measures were trivially attenuated. In CHS, addition of factors VII, VIII and CRP to the models only trivially affected the relative risks. In the nested case-control study, addition of D-dimer and factor XI to the models also only trivially affected the relative risks. In sensitivity analyses, interpretation of results did not differ if only unprovoked cases were considered.
Discussion
The main findings of this study are that increased levels of several body size measures including height, weight, body-mass index, waist, hip and calf circumference were all associated with increased risk of future VT in the general population. Further, both fat mass and fat-free mass were risk factors. Associations were not substantially mediated by circulating levels of hemostasis and inflammation markers that relate to VT risk.
A few other studies assessed body size measures other than BMI in relation to VT risk. Hansson reported higher VT risk with increased waist circumference in men[19]. In the Nurses’ Health Study, BMI was more strongly related to risk of PE than waist-hip-ratio [7]. In the Tromso Study, height was a risk factor for VT in men but not women[20]. Conversely, height was positively associated with VT in a study of women,[21] was not associated with VT in a Dutch study[5], and was associated with fatal PE in a meta-analysis of cohort studies[22]. In a Danish cohort study, measured levels of weight, hip and waist
A
uthor Man
uscr
ipt
A
uthor Man
uscr
ipt
A
uthor Man
uscr
ipt
A
uthor Man
uscr
circumference, fat weight and BMI were positively associated with risk of VT[23]. We previously reported an association of higher waist circumference with VT in a study focused on metabolic syndrome and VT risk[24]. In the Tromso study, among different measures of body size, the top quintile of waist circumference showed the highest risk estimates for VT; HR 3.6 in men and 2.3 in women [25]. The highest RR in the current study was for BMI in the top quartile, RR 3.0.
Few studies have addressed whether biomarkers might mediate the association between obesity and VT risk, and results are inconsistent. In two case-control studies the association of BMI categories with VT risk was slightly attenuated by adjustment for factor VIII and activated protein C resistance [26]. In a case-control study Abdollahi reported that
adjustment for levels of some coagulation and inflammation factors that are correlated with obesity and VT risk (factors VIII and IX, D-dimer, fibrinogen and C-reactive protein) did not attenuate the association of obesity (assessed as elevated BMI) with VT [5]. In contrast, the Reasons for Geographic and Racial Differences in Stroke cohort investigators reported, in a prospective study like that presented here, that CRP mediated 15% of the association of BMI (expressed as a continuous variable) with VT risk and that albumin, which was not studied here, mediated 41% of the risk [27]. That study included a larger representation of African-Americans, who have higher levels of inflammation markers than whites, the cohort had more obesity at baseline, and was enrolled later in time (2003–7) than the LITE cohorts. Taken together, findings suggest that hypercoagulability does not explain the association of obesity with thrombosis, and there is mixed information on whether inflammation plays a role, so further study is necessary.
Along with other work[5], findings here support a hypothesis that the physical impact of body size is more important in VT pathophysiology than the metabolic activity of adipose tissue in relation to hemostatic function[28]. Greater blood volume moving against gravity from the legs may also be important. Our prior report from the LITE study that persons with longer legs have higher risk of VT corroborates this hypothesis[29], as do the similar associations of fat-free mass and fat mass with VT seen here; this finding is also not surprising given the lack of mediation of obesity and VT risk by biomarkers related to adipose tissue that we observed. Obesity is also associated with venous insufficiency[30, 31], thus obesity may cause impaired venous return, which can lead to chronic venous insufficiency and/or DVT. One cross-sectional study reported higher levels of the adipokines resistin, leptin and tumor necrosis factor-alpha (TNF-alpha) with venous insufficiency, independent of BMI[32]. We are not aware of studies of resistin or leptin and VT risk, while one prospective study suggested no association of TNF-alpha with VT risk[33]. Adipokines appear to mediate a prothrombotic state in obesity manifest as higher factor VII,
plasminogen activator inhibitor-1 (PAI-1), fibrinogen and activation of platelets and tissue factor[34, 35]. Some of these factors, like fibrinogen and PAI-1, were not considered here since they were not risk factors for VT in the LITE study[36, 37]. Further study on adipokines and VT is needed to address these questions.
In this study severe obesity was more strongly related to PE than DVT, suggesting a hypothesis that physical factors might contribute to the likelihood of embolization in this group, making VT a more serious disease. We did not observe this for other body size
A
uthor Man
uscr
ipt
A
uthor Man
uscr
ipt
A
uthor Man
uscr
ipt
A
uthor Man
uscr
measures. A recent review, using the same method here to compare risks for DVT versus PE, suggested the opposite, that obesity status was more strongly associated with DVT than PE[18], but this was based on only two studies[38, 39]. In another report from two Danish cohorts the association of increasing BMI, and of a genetic variant for obesity (FTO rs9939609, thought to regulate appetite) was greater for DVT plus PE than for DVT alone [40], but the difference in the RR for PE versus DVT was <2.0 suggesting no greater absolute risk for PE with obesity. A limitation of most research in this area is shared by the current study; namely that in routine practice patients are not systematically evaluated for both DVT and PE upon presentation with one or the other disorder, and this may lead to misclassification of event type since the two manifestations are frequently asymptomatic. More work is needed to address this question.
This study has strengths and limitations. LITE is one of the few large prospective studies with measured risk factors that assessed incidence of VT, which eliminates the likelihood of reverse causality seen in retrospective studies and reduces some types of bias. However, misclassification of exposures is important to consider since baseline levels of risk factors could change over time, in particular levels of obesity and of some biomarkers such as D-dimer that rise with age[41]. The large majority of older adults have stable, increasing or cycling weight over time[42]. Measurement error also introduces misclassification in every epidemiologic study since baseline risk factors are measured with error. These issues may have caused underestimation of risk associations and also may have reduced our ability to detect mediation. Baseline risk factors and laboratory measures in ARIC and CHS were performed with standardized methods so we expect that the impact of measurement error was minimized, although we could not control error from within-person variability. In addition, we did not measure every biomarker that might link obesity with VT risk, nor did we assess liver steatosis or adipokines, so an unmeasured mediator might be considered. Despite the above limitations, careful data collection, inclusion of whites and African-Americans and a 12.6 year follow up with detailed ascertainment of VT events were strengths of the study.
Conclusion
In this study, several measures of body size were related to risk of VT, independent of biomarkers of hemostasis and inflammation that are related to obesity status. This suggests that in the setting of obesity, physical factors related to body size, are more likely to be causally related to VT than the biochemical effects of obesity evaluated in this study. Further, the seemingly differential associations of body size with PE compared to DVT in severe obesity suggest that VT might be a more serious disease in this situation. Since obesity is epidemic and increasing in both developed and developing nations[1], further study is required on the pathogenesis of VT in obese persons.
Supplementary Material
Refer to Web version on PubMed Central for supplementary material.
A
uthor Man
uscr
ipt
A
uthor Man
uscr
ipt
A
uthor Man
uscr
ipt
A
uthor Man
uscr
Acknowledgments
The authors thank the staff and participants of ARIC and CHS. A full list of principal CHS investigators can be found at http://www.chs-nhlbi.org/pi.htm.
Sources of Funding
ARIC is carried out as a collaborative study supported by the National Heart, Lung, and Blood Institute (NHLBI) contracts HHSN268201100005C, HHSN268201100006C, HHSN268201100007C, HHSN268201100008C, HHSN268201100009C, HHSN268201100010C, HHSN268201100011C, and HHSN268201100012C. CHS was supported by contracts HHSN268201200036C, HHSN268200800007C, N01 HC55222, N01HC85079,
N01HC85080, N01HC85081, N01HC85082, N01HC85083, N01HC85086, and grant HL080295 from the NHLBI, with additional contribution from the National Institute of Neurological Disorders and Stroke (NINDS) and AG023629 from the National Institute on Aging (NIA). The Longitudinal Investigation of Thromboembolism Etiology was funded by R01-HL59367. The content is solely the responsibility of the authors and does not necessarily represent the official views of the National Institutes of Health. The funding source had no role in the study design, manuscript writing or decision to publish.
Abbreviations
ARIC Atherosclerosis Risk in Communities
BMI body-mass index
CHS Cardiovascular Health Study
VT venous thrombosis
References
1. Mozaffarian D, Benjamin EJ, Go AS, Arnett DK, Blaha MJ, Cushman M, et al. Heart Disease and Stroke Statistics-2016 Update: A Report From the American Heart Association. Circulation. 2016; 133:e38–e360. [PubMed: 26673558]
2. Goldhaber SZ, Grodstein F, Stampfer MJ, Manson JE, Colditz GA, Speizer FE, et al. A prospective study of risk factors for pulmonary embolism in women. JAMA. 1997; 277:642–645. [PubMed: 9039882]
3. Samama MM. An epidemiologic study of risk factors for deep vein thrombosis in medical outpatients: the Sirius study. Arch Intern Med. 2000; 160:3415–3420. [PubMed: 11112234] 4. Tsai AW, Cushman M, Rosamond WD, Heckbert SR, Polak JF, Folsom AR. Cardiovascular risk
factors and venous thromboembolism incidence: the Longitudinal Investigation of
Thromboembolism Etiology. Arch Intern Med. 2002; 162:1182–1189. [PubMed: 12020191] 5. Abdollahi M, Cushman M, Rosendaal FR. Obesity: risk of venous thrombosis and the interaction
with coagulation factor levels and oral contraceptive use. Thromb Haemost. 2003; 89:493–498. [PubMed: 12624633]
6. Oren E, Smith NL, Doggen CJ, Heckbert SR, Lemaitre RN. Body mass index and the risk of venous thrombosis among postmenopausal women. J Thromb Haemost. 2006; 4:2273–2275. [PubMed: 16824186]
7. Kabrhel C, Varraso R, Goldhaber SZ, Rimm EB, Camargo CA. Prospective study of BMI and the risk of pulmonary embolism in women. Obesity (Silver Spring). 2009; 17:2040–2046. [PubMed: 19373223]
8. Holst AG, Jensen G, Prescott E. Risk factors for venous thromboembolism: results from the Copenhagen City Heart Study. Circulation. 2010; 121:1896–1903. [PubMed: 20404252]
9. Stein PD, Matta F, Goldman J. Obesity and pulmonary embolism: the mounting evidence of risk and the mortality paradox. Thromb Res. 2011; 128:518–523. [PubMed: 22078437]
10. The Surgeon General's Call to Action to Prevent Deep Vein Thrombosis and Pulmonary Embolism. U.S. Department of Health and Human Services; 2008.
A
uthor Man
uscr
ipt
A
uthor Man
uscr
ipt
A
uthor Man
uscr
ipt
A
uthor Man
uscr
11. Cushman M, Tsai AW, White RH, Heckbert SR, Rosamond WD, Enright P, et al. Deep vein thrombosis and pulmonary embolism in two cohorts: the Longitudinal Investigation of Thromboembolism Etiology. Am J Med. 2004; 117:19–25. [PubMed: 15210384]
12. Visser M, Langlois J, Guralnik JM, Cauley JA, Kronmal RA, Robbins J, et al. High body fatness, but not low fat-free mass, predicts disability in older men and women: the Cardiovascular Health Study. Am J Clin Nutr. 1998; 68:584–590. [PubMed: 9734734]
13. Deurenberg P, van der Kooij K, Evers P, Hulshof T. Assessment of body composition by bioelectrical impedance in a population aged greater than 60 y. Am J Clin Nutr. 1990; 51:3–6. [PubMed: 2296928]
14. Cushman M, O'Meara ES, Folsom AR, Heckbert SR. Coagulation factors IX through XIII and the risk of future venous thrombosis: the Longitudinal Investigation of Thromboembolism Etiology. Blood. 2009; 114:2878–2883. [PubMed: 19617576]
15. Chambless L, McMahon R, Finch A, Sorlie P, Heiss G, Lyles R, et al. ARIC Hemostasis Study - III. Quality control. Thromb Haemost. 1993; 70:588–594. [PubMed: 8115984]
16. Cushman M, Cornell ES, Howard PR, Bovill EG, Tracy RP. Laboratory methods and quality assurance in the Cardiovascular Health Study. Clin Chem. 1995; 42:264–270. [PubMed: 7874780] 17. Cushman M, Arnold AM, Psaty BM, Manolio TA, Kuller LH, Burke GL, et al. C-reactive protein
and the 10-year incidence of coronary heart disease in older men and women: the cardiovascular health study. Circulation. 2005; 112:25–31. [PubMed: 15983251]
18. van Langevelde K, Flinterman LE, van Hylckama Vlieg A, Rosendaal FR, Cannegieter SC. Broadening the factor V Leiden paradox: pulmonary embolism and deep-vein thrombosis as 2 sides of the spectrum. Blood. 2012; 120:933–946. [PubMed: 22496157]
19. Hansson PO, Eriksson H, Welin L, Svardsudd K, Wilhelmsen L. Smoking and abdominal obesity: risk factors for venous thromboembolism among middle-aged men: "the Study of Men born in 1913". Arch Intern Med. 1999; 159:1886–1890. [PubMed: 10493318]
20. Braekkan SK, Borch KH, Mathiesen EB, Njolstad I, Wilsgaard T, Hansen JB. Body height and risk of venous thromboembolism: The Tromso Study. Am J Epidemiol. 2010; 171:1109–1115. [PubMed: 20418276]
21. Lutsey PL, Virnig BA, Durham SB, Steffen LM, Hirsch AT, Jacobs DR Jr, et al. Correlates and consequences of venous thromboembolism: The Iowa Women's Health Study. Am J Public Health. 2010; 100:1506–1513. [PubMed: 19910349]
22. Emerging Risk Factors Collaboration. Adult height and the risk of cause-specific death and vascular morbidity in 1 million people: individual participant meta-analysis. Int J Epidemiol. 2012; 41:1419–1433. [PubMed: 22825588]
23. Severinsen MT, Kristensen SR, Johnsen SP, Dethlefsen C, Tjonneland A, Overvad K.
Anthropometry, body fat, and venous thromboembolism: a Danish follow-up study. Circulation. 2009; 120:1850–1857. [PubMed: 19858417]
24. Steffen LM, Cushman M, Peacock JM, Heckbert SR, Jacobs DR Jr, Rosamond WD, et al. Metabolic syndrome and risk of venous thromboembolism: Longitudinal Investigation of Thromboembolism Etiology. J Thromb Haemost. 2009; 7:746–751. [PubMed: 19175496] 25. Horvei LD, Braekkan SK, Mathiesen EB, Njolstad I, Wilsgaard T, Hansen JB. Obesity measures
and risk of venous thromboembolism and myocardial infarction. Eur J Epidemiol. 2014; 29:821– 830. [PubMed: 25213403]
26. Christiansen SC, Lijfering WM, Naess IA, Hammerstrom J, van Hylckama Vlieg A, Rosendaal FR, et al. The relationship between body mass index, activated protein C resistance and risk of venous thrombosis. J Thromb Haemost. 2012; 10:1761–1767. [PubMed: 22726452]
27. Olson NC, Cushman M, Lutsey PL, McClure LA, Judd S, Tracy RP, et al. Inflammation markers and incident venous thromboembolism: the REasons for Geographic And Racial Differences in Stroke (REGARDS) cohort. J Thromb Haemost. 2014; 12:1993–2001. [PubMed: 25292154] 28. Faber DR, de Groot PG, Visseren FL. Role of adipose tissue in haemostasis, coagulation and
fibrinolysis. Obesity Rev. 2009; 10:554–563.
29. Lutsey PL, Cushman M, Heckbert SR, Tang W, Folsom AR. Longer legs are associated with greater risk of incident venous thromboembolism independent of total body height. The
A
uthor Man
uscr
ipt
A
uthor Man
uscr
ipt
A
uthor Man
uscr
ipt
A
uthor Man
uscr
Longitudinal Study of Thromboembolism Etiology (LITE). Thromb Haemost. 2011; 106:113–120. [PubMed: 21655679]
30. Cushman M, Callas PW, Denenberg JO, Bovill EG, Criqui MH. Risk factors for peripheral venous disease resemble those for venous thrombosis: the San Diego Population Study. J Thromb Haemost. 2010; 8:1730–1735. [PubMed: 20492466]
31. Clark A, Harvey I, Fowkes FG. Epidemiology and risk factors for varicose veins among older people: cross-sectional population study in the UK. Phlebology. 2010; 25:236–240. [PubMed: 20870870]
32. Allison MA, Cushman M, Callas PW, Denenberg JO, Jensky NE, Criqui MH. Adipokines are associated with lower extremity venous disease: the San Diego Population Study. J Thromb Haemost. 2010; 8:1912–1918. [PubMed: 20546124]
33. Christiansen SC, Naess IA, Cannegieter SC, Hammerstrom J, Rosendaal FR, Reitsma PH. Inflammatory cytokines as risk factors for a first venous thrombosis: a prospective population-based study. PLoS Med. 2006; 3:e334. [PubMed: 16933968]
34. Napoleone E, A DIS, Amore C, Baccante G, di Febbo C, Porreca E, et al. Leptin induces tissue factor expression in human peripheral blood mononuclear cells: a possible link between obesity and cardiovascular risk? J Thromb Haemost. 2007; 5:1462–1468. [PubMed: 17425664] 35. Schafer K, Konstantinides S. Adipokines and thrombosis. Clin Exper Pharmacol Physiol. 2011;
38:864–871. [PubMed: 21848866]
36. Tsai AW, Cushman M, Rosamond WD, Heckbert SR, Tracy RP, Aleksic N, et al. Coagulation factors, inflammation markers, and venous thromboembolism: the Longitudinal Investigation of Thromboembolism Etiology (LITE). Am J Med. 2002; 113:636–642. [PubMed: 12505113] 37. Folsom AR, Cushman M, Heckbert SR, Rosamond WD, Aleksic N. Prospective study of
fibrinolytic markers and venous thromboembolism. J Clin Epidemiol. 2003; 56:598–603. [PubMed: 12873656]
38. Stein PD, Beemath A, Olson RE. Obesity as a risk factor in venous thromboembolism. Am J Med. 2005; 118:978–880. [PubMed: 16164883]
39. Pomp ER, le Cessie S, Rosendaal FR, Doggen CJ. Risk of venous thrombosis: obesity and its joint effect with oral contraceptive use and prothrombotic mutations. Br J Haematol. 2007; 139:289– 296. [PubMed: 17897305]
40. Klovaite J, Benn M, Nordestgaard BG. Obesity as a causal risk factor for deep venous thrombosis: a Mendelian randomization study. J Intern Med. 2015; 277:573–584. [PubMed: 25161014] 41. Lee AJ, Fowkes GR, Lowe GD, Rumley A. Determinants of fibrin D-dimer in the Edinburgh
Artery Study. Arterioscler Thromb Vasc Biol. 1995; 15:1094–1097. [PubMed: 7627701] 42. Arnold AM, Newman AB, Cushman M, Ding J, Kritchevsky S. Body weight dynamics and their
association with physical function and mortality in older adults: the Cardiovascular Health Study. J Gerontol Biol Sci Med Sci. 2010; 65:63–70.
A
uthor Man
uscr
ipt
A
uthor Man
uscr
ipt
A
uthor Man
uscr
ipt
A
uthor Man
uscr
Highlights
• Obesity is a leading risk factor for venous thrombosis (VT), with unknown mechanism
• Obesity drives a procoagulant, proinflammatory state
• We observed associations of most body size measures with VT risk
• Hemostasis and inflammation biomarkers did not substantially mediate associations
• Physical factors not biochemical effects, are more likely causal for VT in obesity
A
uthor Man
uscr
ipt
A
uthor Man
uscr
ipt
A
uthor Man
uscr
ipt
A
uthor Man
uscr
Figure 1.
Incidence of Venous Thrombosis by Body Size Measures. Incidence rates per 1000 person-years are shown by sex-specific quartiles of each body size measure, other than BMI. BMI is shown by obesity categories. Calf circumference was only available in ARIC. Fat mass and fat-free mass were only available in CHS, and are shown in the inset.
Cutpoints for quartiles in men were: weight 73.9, 82.1, 91.2 kg; height 171, 175, 180 cm; waist circumference 92, 98, 105 cm; waist-hip ratio 0.93, 0.96, 1.00; calf circumference 36, 38, 40 cm; fat mass 24.3, 29.9, 35.9 kg; fat-free mass 44.3, 48.1, 52.2 kg. Cutpoints for quartiles in women were: weight 60.1, 69.0, 80.3 kg; height 157, 161, 165 cm; waist circumference 83, 93, 104 cm; waist-hip ratio 0.84, 0.90, 0.96; calf circumference 34, 36, 39 cm; fat mass 26.9, 33.3, 40.9 cm; fat-free mass 29.8, 32.5, 35.7 kg.
A
uthor Man
uscr
ipt
A
uthor Man
uscr
ipt
A
uthor Man
uscr
ipt
A
uthor Man
uscr
Figure 2.
Spearman Correlation Coefficients of Body Size Measures and Biomarkers. The darker shaded boxes indicate higher correlation coefficients.
A
uthor Man
uscr
ipt
A
uthor Man
uscr
ipt
A
uthor Man
uscr
ipt
A
uthor Man
uscr
A
uthor Man
uscr
ipt
A
uthor Man
uscr
ipt
A
uthor Man
uscr
ipt
A
uthor Man
uscr
ipt
Table 1
Baseline Characteristics of Study Participants, LITE
Characteristic, mean (SD) or % Incident VT (n = 448) No VT (n = 20,466)
Age, years 63 (10) 59 (10)
Sex, female 55% 56%
Race, black 26% 24%
Diabetes 18% 13%
Weight, kg 81.3 (17.0) 76.9 (16.4)
Height, cm 168 (10) 168 (9)
BMI, kg/m2 28.8 (5.2) 27.4 (5.2)
Obesity 37% 25%
Waist circumference, cm 100 (14) 96 (14)
Elevated waist circumference 63% 51%
Hip circumference, cm 106 (11) 104 (10)
Waist-hip ratio 0.94 (0.08) 0.93 (0.08)
Calf circumference, cm* 38.5 (3.9) 37.4 (3.7)
Fat-free mass, kg† 41.5 (9.9) 39.6 (9.4)
Fat mass, kg† 35.3 (12.4) 32.8 (10.7)
* ARIC only
A
uthor Man
uscr
ipt
A
uthor Man
uscr
ipt
A
uthor Man
uscr
ipt
A
uthor Man
uscr
ipt
Table 2
Relative Risk of Incident VT by Body Size or Biomarker Categories, Adjusted for Age, Race and Sex
Factor, SD
Relative Risk by Category of Each Factor
Compared to Lowest Category* Relative Riskper SD Increment
2 3 4
Body Size
Weight, 16.4 kg 1.3 (0.9–1.7) 1.5 (1.2–2.1) 2.6 (2.0–3.5) 1.4 (1.3–1.6)
Height, 9.5 cm 1.1 (0.9–1.5) 1.2 (0.9–1.6) 1.5 (1.1–1.9) 1.2 (1.1–1.4)
BMI, 5.2 kg/m2 1.4 (1.1–1.7) 2.2 (1.7–2.8) 3.0 (1.8–5.0) 1.3 (1.2–1.5)
Waist circumference, 13.7 cm 1.2 (0.9–1.6) 1.3 (1.0–1.8) 2.2 (1.7–2.8) 1.3 (1.2–1.5)
Elevated waist circumference 1.7 (1.4–2.1) - -
-Hip circumference, 10.4 cm 1.3 (1.0–1.8) 1.6 (1.2–2.1) 2.3 (1.8–3.1) 1.3 (1.2–1.4)
Waist-hip ratio, 0.08 1.3 (1.0–1.7) 1.5 (1.1–2.0) 1.7 (1.3–2.2) 1.2 (1.1–1.3)
Calf circumference, 3.7 cm† 1.4 (0.9–2.0) 2.0 (1.4–2.8) 2.5 (1.8–3.5) 1.4 (1.2–1.5)
Fat-free mass, 9.4 kg‡ 1.2 (0.8–2.0) 1.5 (0.9–2.3) 2.0 (1.3–3.1) 1.6 (1.2–2.0)
Fat Mass, 10.7 kg‡ 1.1 (0.7–1.7) 0.9 (0.5–1.4) 1.7 (1.1–2.7) 1.3 (1.1–1.5)
Hemostasis
Factor VIIc, 29% 1.2 (0.9–1.6) 1.0 (0.8–1.4) 1.4 (1.1–1.9) 1.1 (1.0–1.2)
Factor VIIIc, 39% 1.2 (0.9–1.6) 1.6 (1.2–2.2) 2.5 (1.8–3.3) 1.4 (1.3–1.5)
Factor XI, 37%§ 1.4 (1.0, 1.9) 1.5 (1.1, 2.1) 2.0 (1.4–2.8) 1.2 (1.0–1.4)
von Willebrand factor, 1.5%†║ 1.6 (1.0–2.4) 1.3 (0.8–2.0) 3.4 (2.4–5.0) 1.7 (1.5–1.9)
Fibrinogen, 66 mg/dL 1.0 (0.8–1.4) 1.2 (0.9–1.5) 1.0 (0.8–1.3) 1.0 (0.9–1.1)
aPTT, 3.0 sec † 0.7 (0.5–1.0) 0.4 (0.2–0.5) 0.4 (0.3–0.6) 0.6 (0.6–0.7)
Protein C, 0.62 ug/ml † 1.2 (0.9–1.8) 1.3 (0.9–1.9) 1.1 (0.7–1.5) 1.0 (0.9–1.1)
D-dimer, 2.3 ug/ml §║ 1.1 (0.8, 1.6) 1.9 (1.4, 2.7) 2.1 (1.5, 3.0) 1.3 (1.2, 1.5)
Inflammation
Leukocyte count, 1.3 ×10⁹/L║ 0.8 (0.6–1.1) 0.9 (0.7–1.2) 0.9 (0.7–1.2) 1.0 (0.9–1.1)
C-reactive protein, 2.8 mg/L‡║ 1.1 (0.7–1.6) 0.9 (0.6–1.4) 0.9 (0.6–2.1) 1.1 (1.0–1.3)
Interkeukin-6, 1.9 pg/ml‡║ 0.9 (0.5–1.5) 1.1 (0.6–1.7) 1.1 (0.6–1.7) 1.0 (0.8–1.2)
*
Categories are quartiles except BMI was overweight (2), obese (3) or severely obese (4) compared to normal, and elevated waist circumference (2).
†
ARIC participants only
‡
CHS participants only
§
Nested case-control study only
║
A
uthor Man
uscr
ipt
A
uthor Man
uscr
ipt
A
uthor Man
uscr
ipt
A
uthor Man
uscr
ipt
T ab le 3Incidence Rates and Relati
v
e Risk of Deep V
ein Thrombosis Only or Pulmonary Embolus +/− Deep V
ein Thrombosis Associated with Body Size
Measures, Adjusted for Age, Race and Se
x.
D
VT only (n=312)
PE +/− D
VT (n=136)
RR PE / RR D
VT
Body Size Measur
e
Incidence Rate (95% CI)
*
RR (95% CI)
Incidence Rate (95% CI)
RR (95% CI)
BMI Normal
1.0 (0.8, 1.2)
1.0 (ref)
0.3 (0.2, 0.5)
1.0 (ref)
1.0
Ov
erweight
1.3 (1.1, 1.5)
1.3 (1.0–1.7)
0.5 (0.4, 0.6)
1.5 (1.0–2.5)
1.1
Obese
1.6 (1.3, 2.0)
1.8 (1.3–2.4)
1.0 (0.7, 1.3)
3.5 (2.2–5.6)
1.9
Se
v
erely Obese
1.7 (0.9, 3.1)
2.1 (1.1–4.1)
1.3 (0.7, 2.7)
5.9 (2.6–13.2)
2.8
W
eight
Quartile 1
1.0 (0.7, 1.2)
1.0 (ref)
0.4 (0.2, 0.6)
1.0 (ref)
1.0
Quartile 4
1.7 (1.4, 2.1)
2.3 (1.6–3.2)
1.0 (0.7, 1.2)
3.6 (2.2–5.9)
1.6
W
aist
Circumference Normal
1.0 (0.9, 1.2)
1.0 (ref)
0.3 (0.2, 0.5)
1.0 (ref)
1.0
Ele
v
ated
1.5 (1.3, 1.7)
1.5 (1.2–2.0)
0.7 (0.6, 0.9)
2.4 (1.6–3.5)
1.6