UNDERSTANDING RELATIONSHIPS BETWEEN CHILD CARE WORKERS’
EATING HABITS AND SPATIAL ACCESS TO FOOD OUTLETS AROUND
WORKERS’ HOMES, WORKPLACES, AND ALONG COMMUTES
Gabriela Arandia
A dissertation submitted to the faculty at the University of North Carolina at Chapel Hill in partial fulfillment of the requirements for the degree of Doctor of Philosophy in the Department
of Health Behavior in the Gillings School of Global Public Health.
Chapel Hill 2017
Approved by: Laura A. Linnan
Dianne S. Ward Leslie A. Lytle
iii ABSTRACT
Gabriela Arandia: Understanding Relationships between Child Care Workers’ Eating Habits and Spatial Access to Food Outlets around Workers’ Homes, Workplaces, and along Commutes
(Under the direction of Laura A. Linnan)
Research examining spatial access to food outlets in non-residential settings is rare, especially among at-risk populations. This dissertation examined associations between child care workers’ eating habits and spatial access to supermarkets/grocery stores, convenience stores, and fast food restaurants around home, work, and along commutes; and, explored moderation of these associations by self-efficacy for healthy eating and home and workplace census tract-level poverty.
Baseline data were analyzed from 638 child care workers enrolled in the CARE study, a cluster-randomized trial promoting healthy behaviors among child care workers in North Carolina. An Eating Habits Score (0-20) was derived from food intake frequency of 10 items, with higher scores reflecting healthier eating habits. Food outlet data from ReferenceUSA were analyzed within ArcGIS to create density measures of food outlets within 5 road network miles of home and work and along commutes (shortest network distance between home and work). Generalized Estimating Equations were used to analyze associations.
iv
supermarkets around work was associated with healthier eating habits among rural workers (β=0.323, p=0.017). Surprisingly, greater access to convenience stores (β=0.129, p=0.017), and fast food restaurants (β=0.078, p=0.012) around work were also associated with better eating habits among rural workers. Food outlet density along commutes and eating habits were unrelated. More convenience stores (β=0.274, p=0.006) and fast food restaurants (β=0.100, p=0.010) along commutes were associated with healthier eating habits among participants who were ‘moderately/very/extremely confident’ in eating healthy. Moreover, more small grocery stores around home was associated with poorer eating habits for participants living in medium poverty home census tracts (β=-0.167, p=0.016) (vs. low poverty).
Understanding child care workers’ food access is vital to helping them make healthier food choices and to reduce obesity and chronic disease risks. Future research should consider healthy/unhealthy food availability within locations, and shopping behaviors to further elucidate findings.
v To my family:
To my parents, thank you for modeling hard work and dedication, and for instilling the value of education from day one. You have given me access to a world of opportunities along with your blessing to pursue them, and for that, I am so grateful.
To my brothers, Luis Jr., Sebastian, and Nicholas, I love you all so much. Thank you for your support and encouragement throughout this journey. This is for us!
vi
ACKNOWLEDGEMENTS
So many people helped to make this dissertation possible. First and foremost, I extend my utmost gratitude to my dissertation committee: Drs. Laura Linnan (Chair), Dianne Ward, Leslie Lytle, Susan Ennett, and Michael Emch for their time, support, guidance, and helpful feedback throughout the dissertation process.
Dr. Laura Linnan, thank you for serving as my mentor throughout my doctoral training. I have learned so much working with you on grant proposals, manuscripts, and projects. Thank you for encouraging me to apply for a NIH National Heart, Lung, and Blood Institute Diversity Supplement to be able to join you, Dr. Ward, and the CARE team on the CARE study – an opportunity that has allowed me to strengthen my research skillset, learn GIS, and
collaborate on a large cluster-randomized worksite wellness trial for child care staff. Dr. Dianne Ward, it has been a pleasure to work with you these past few years. Thank you for your mentorship, words of encouragement, and confidence in me as I executed my responsibilities on the CARE project. Thank you for your thoughtful feedback throughout the dissertation process.
Dr. Susan Ennett, thank you for your kindness and gentle disposition serving as doctoral program director upon my entry to the doctoral program. I appreciate your thoughtful commentary and feedback, especially on the methodological considerations of my dissertation.
vii
on food environments, and keeping me on track with addressing my key research questions and aims.
Dr. Mike Emch, thank you for sharing your spatial health expertise. Your ‘GIS in Public Health’ course helped to solidify my understanding of important concepts related to neighborhoods and health as well as mapping techniques within ArcGIS software.
I am grateful to the entire CARE research team at the UNC Center for Health Promotion and Disease Prevention. I am especially appreciative of Ms. Lori Bateman and Ms. Amber Vaughn for their mentorship and encouragement along the way. Recruitment,
intervention implementation, data collection, data cleaning/processing were surely a team effort and I thank everyone who contributed to the CARE study. A special thank you goes to all the Research Assistants who worked so hard on CARE. It was a pleasure to work with and get to know each of you.
I would also like to thank the Health Behavior department – faculty, staff, and students for creating such a supportive and collaborative learning and working environment. I also want to thank the Odum Institute and the Davis Library, with a big thank you to Mr. Philip McDaniel, GIS Librarian at the UNC Davis Library, for providing helpful guidance on GIS techniques in ArcGIS software.
Lastly to my support system. To my friends, thank you for sharing good times, fun and laughter, and offering your support and assistance.
viii
TABLE OF CONTENTS
LIST OF TABLES ... xii
LIST OF FIGURES ... xiv
CHAPTER 1. INTRODUCTION ... 1
Problem Statement ... 1
Food Environments and Eating Habits: State of the Literature ... 2
Dissertation Study Overview ... 3
CHAPTER 2. LITERATURE REVIEW ... 7
Link between Food Environments, Eating Habits, and Obesity ... 7
Food Environment Research Methodology... 8
Categorizing the Food Environment ... 8
Food Environment Metrics ... 8
Defining Appropriate Spatial Scale for Proposed Study ... 10
Data Collection Methods ... 11
Research on Food Environments and Eating Habits ... 12
Studies exploring food exposures around home locations and associations with eating habits ... 12
Studies exploring food exposures around home and workplace/ activity space locations and associations with eating habits ... 15
Gaps in the Literature ... 21
CHAPTER 3. CONCEPTUAL MODEL ... 22
Conceptual Model for Understanding Relationships between Food Environments and Eating Habits ... 22
Social Ecological Framework ... 22
Social Cognitive Theory ... 22
Research Questions ... 25
ix
Introduction ... 27
Hypotheses... 30
Methods ... 32
Participant-Level Data Collection and Measures ... 34
Center-Level Data Collection and Measures ... 35
Dependent Variable - Eating Habits Score ... 36
Food Environment Measures ... 43
Independent Variables ... 48
Defining Urban-Rural Designation ... 52
Merging ReferenceUSA and CARE Study Data ... 53
Covariates ... 54
Descriptive Analyses ... 54
Statistical Analyses ... 54
Results ... 55
Sample ... 55
Descriptive Statistics ... 55
Descriptive Results: Food Outlet Coverage in Work, Home, and Commute Settings ... 60
Spatial Access to Food Outlets around Work ... 60
Spatial Access to Food Outlets around Home ... 61
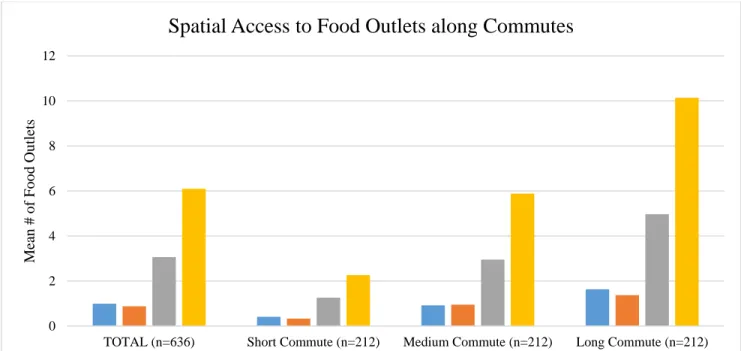
Spatial Access to Food Outlets along Commute ... 62
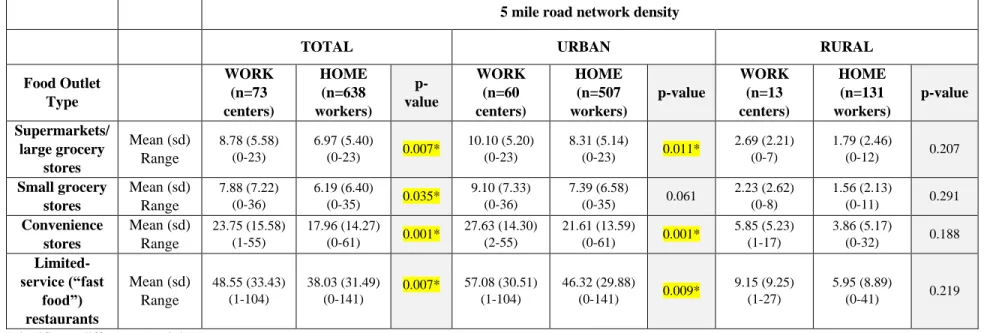
Comparing Food Outlet Coverage around 5 miles from Work vs. Home ... 64
Regression Analyses (GEE) Results: Unadjusted (Null) Model ... 66
Adjusted GEE Results ... 66
Discussion ... 74
Practice and Policy Implications ... 78
Strengths and Limitations ... 81
Conclusion ... 85
x
Introduction ... 87
Hypotheses... 90
Methods ... 92
Dependent Variable ... 92
Independent Variables ... 94
Moderator Variables ... 96
Participant Characteristics ... 97
Analyses ... 98
Descriptive Analyses ... 98
Moderation Analyses ... 98
Results ... 99
Sample ... 99
Descriptive Statistics: Sample ... 99
Descriptive Results: Food Outlet Coverage in Work, Home, and Commute Settings ... 100
Moderation Analyses Results ... 102
Discussion ... 108
Practice Implications ... 110
Strengths and Limitations ... 111
Conclusion ... 113
CHAPTER 6. SYNTHESIS & CONCLUSION ... 114
Summary of Dissertation Activities ... 114
Synthesis of Key Findings... 115
Implications for Research ... 118
Implications for Practice & Policy ... 120
Strengths and Limitations ... 121
Conclusion ... 123
APPENDIX 4.1: ADDITIONAL DESCRIPTIVE ANALYSES RESULTS USING 1MILE RADIAL AND ROAD NETWORK BUFFERS & 5 MILE RADIAL BUFFERS ... 124
xi
xii
LIST OF TABLES
Table 4.1 - Eating Habits Scoring Criteria……….39 Table 4.2 - NAICS Codes for Generating a List of Potential Food Outlets (Food Outlet Types) and # of Records Downloaded and Processed………46 Table 4.3 - Participant Characteristics (n=638)……….58 Table 4.4 - Child Care Center Characteristics (n=73)………...59 Table 4.5 - Food Outlets within 5 miles of Work (Child Care Centers) in Urban and Rural Areas (n=73 centers)……….61 Table 4.6 - Food Outlets within 5 miles of Home (n=638 Participants)………...62 Table 4.7 - Food Outlets along Commute (200 m from Commute Paths) by Commute Distance (n=636 participants^)……….63 Table 4.8 - Comparing Food Outlet Exposures within 5 miles (Road Network Density) of Work vs. Home, among Total Sample, and by Urban vs. Rural status of Workplace and Home Locations………...65 Table 4.9 - Associations between Spatial Access to Food Outlets and Eating
xiii
xiv
LIST OF FIGURES
Figure 3.1 - Conceptual Model for Understanding Relationships between Food Environments and Eating Habits………..26 Figure 4.1 - Map of Counties Targeted for Child Care Center Recruitment………...33 Figure 4.2 - Eating Habits Score Distribution………...43 Figure 4.3 - Radial Buffer (circle shown) and Road Network Buffer (polygon) around a Participant’s Home Address………50 Figure 4.4 - Buffered Commute Paths for Participants Working in
1
CHAPTER 1. INTRODUCTION
Problem Statement
Obesity remains a serious public health concern affecting more than one-third of adults (37.7%) in the U.S. (Flegal et al., 2016), increasing risks for many severe chronic disease and health conditions, including hypertension, Type 2 diabetes, and cardiovascular disease (National Heart, Lung, and Blood Institute (NHLBI), 2013). Obesity rates have been increasing among women (40.4% of all women), but not among men (35% of whom are obese) (Flegal et al., 2016). Obesity results from a combination of modifiable and non-modifiable risk factors ranging from individual-level factors (e.g., genetics, family history) to behavioral risk factors and
2
Food Environments and Eating Habits: State of the Literature
Greater availability/accessibility of healthy foods, such as fruits and vegetables, is essential for a healthy diet and overall health, while inadequate access to healthy foods and greater access to unhealthy foods (snack items, fast foods) can contribute to unhealthy diets, obesity, and obesity-related health problems. Numerous studies have found associations between greater spatial access (exposure) to nearby supermarkets and grocery stores and healthier diets, and greater access to convenience stores and fast food restaurants and unhealthy diets (Gordon-Larsen, 2014; Papas et al., 2007; Slawson, Fitzgerald, & Morgan, 2013). Yet reviews of existing literature have also uncovered a preponderance of mixed findings across the food environment literature (Black, Moon, & Baird, 2014; Gordon-Larsen, 2014).
A major limitation of the current food environment literature is that most studies tend to measure only the food environment near participants’ place of residence. While a focus on food access near homes is important, people travel beyond their residential neighborhoods and are regularly exposed to a variety of “food landscapes” in other settings as well (Sobal & Wansink, 2008, p. 286). Research on how individuals navigate these contexts, and the role of these contexts on behavior, embraces what is known commonly in the fields of zoology, human
geography, and transportation as the ‘activity space’ perspective (Rainham, McDowell, Krewski, & Sawada, 2010; Saarloos, Kim, & Timmermans, 2009). The activity space perspective
3
and vending machines onsite (CDC, 2017b; Goetzel & Ozminkowski, 2008; Hipp et al., 2015), along with mixed options nearby for making healthy food selections. Also, workplaces tend to be situated in business/commercial districts with a greater number of food outlets compared to residential neighborhoods. The commute is another important, yet understudied setting in which workers may visit nearby grocery stores or restaurants on their way to and from work (Kerr et al., 2012; McGuckin and Murakami, 1999; Sharkey, 2009; Ye, Pendyala, & Gottardi, 2007). Longer commutes would presumably increase one’s exposure to places which offer food — though research is needed in this area.
Other knowledge gaps remain in current food environment literature. Theoretical and/or conceptual frameworks are needed to guide the study of relationships between food
environments and eating habits. Also, a ‘gold standard’ spatial scale that captures one’s food environment remains elusive, and it is unclear how findings vary by scale. In addition, research has tended to focus on either urban settings or rural settings, but rarely both (Gordon-Larsen, 2014). Comparisons between urban and rural contexts can provide an improved understanding of spatial food access inequalities that exist across geographies. Lastly, a better understanding of moderating mechanisms can help to identify vulnerabilities among sub-populations most affected by relationships between food outlet density and eating habits.
Dissertation Study Overview
Given the scarcity of food environment research in settings other than the home, this dissertation addresses multiple literature gaps by addressing the influence of multiple food environments (around work, home, and along commutes) on eating habits among an
4
heightened risks for obesity, high blood pressure, diabetes/prediabetes, depressive symptoms, and lower health-related quality of life (i.e., reporting more physically and mentally unhealthy days) (Whitaker, Becker, Herman, & Gooze, 2013). On top of this, most child care workers lack employer-based health insurance and limited access to primary care and preventive services (Baron et al., 2013; Larson, Ward, Neelon, & Story, 2011).
A better understanding of the contextual barriers and challenges child care workers face when it comes to making healthy food choices may shed light on potential policy and
programmatic interventions that could help to offset obesity and health risks. This dissertation represents the first attempt to assess child care workers’ spatial access to food outlets and how these food exposures impact their eating habits. This study takes place in the context of a cluster-randomized controlled trial, CAring and REaching for Health (CARE): A Worksite Wellness Program for Child Care Staff (R01HL119568, Ward & Linnan, Multiple CO-Is). This trial aims to evaluate the efficacy of a 6-month worksite wellness intervention designed to improve physical activity, dietary intake, and other health behaviors among participating child care workers (Healthy Lifestyles program) compared to participants in an attention-controlled arm (Healthy Finances program). This dissertation uses baseline data for participants whose child care centers were recruited into the larger CARE study (prior to randomization). This dissertation includes an analytic sample of 638 participants from 73 child care centers in North Carolina who consented and were measured at baseline during the four waves of data collection (2015-2016).
Two studies comprise this dissertation. Study One examines the extent to which food outlet density around: 1) child care workers’ homes (home address), 2) child care centers
5
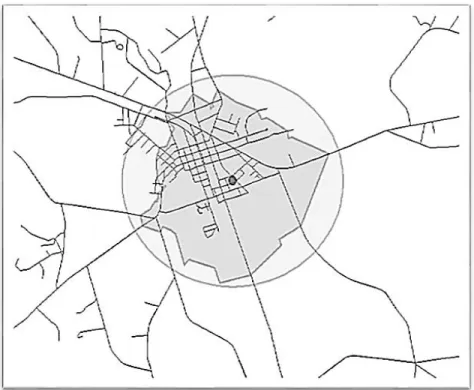
developed for this study). Analyses employed ArcGIS geographic information systems software that allowed for buffering home, work, and commute settings to create density measures of 1) supermarkets/grocery stores, 2) convenience stores, and 3) limited-service (“fast food”) restaurants. I also examined whether there were differences in food outlet densities by setting (home, work, commute), buffer method (radial buffer, road network buffer), spatial scale (1 mi., 5 mi.), and by urban-rural settings.
Study Two examines the role of individual- and community-level factors as moderators between food outlet density around settings and workers’ eating habits. Namely, self-efficacy for healthy eating as well as home and workplace census tract-level poverty are assessed as moderators. These factors may reveal for whom and under what conditions these relationships vary.
The research questions for each study are:
Study One: What is the association between child care workers’ eating habits and spatial access to food outlets around home, workplace and along commutes?
Study Two: Do self-efficacy for healthy eating and/or home and workplace census tract-level poverty moderate the relationship between child care workers’ eating habits and spatial access to food outlets around home, workplace and along commutes?
6
methodology, understanding of relationships between food environments and eating habits, and study aims. Chapter 3 describes the conceptual model guiding this dissertation. Chapter 4
7
CHAPTER 2. LITERATURE REVIEW
Link between Food Environments, Eating Habits, and Obesity
A thorough literature review informed my conceptualization, methodology, and
8 Food Environment Research Methodology
Categorizing the Food Environment
Food environments comprise an array of food stores, restaurants, and other food outlets; however, most studies have tended to look at one or two outlet types while only a few have looked at the full range of food retailers (Black et al., 2014). For example, Powell, Slater, Mirtcheva, Bao, and Chaloupka (2007) differentiated between chain supermarkets, non-chain supermarkets, grocery stores, and convenience stores, but ignored restaurants/fast food outlets. McKinnon, Reedy, Morrissette, Lytle, and Yaroch (2009) grouped food outlets by those
comprising the food store environment (e.g., grocery stores, supermarkets, specialty food stores, farmers’ markets, food pantries) and restaurant food environment (e.g., fast food and full-service restaurants). Still, others have differentiated between: food/grocery stores (further subdivided into chain food/grocery stores, non-chain food/grocery stores, convenience stores, and gas station food/grocery stores), restaurants (e.g., full-service eateries, bakeries, cafes), and fast food
restaurants (e.g., pizzerias and hamburger joints) (Kawakami, Winkleby, Skog, Szulkin, & Sundquist, 2011). My dissertation distinguishes food outlets among food stores (supermarkets, small grocery stores), convenience stores, and limited-service (fast food) restaurants.
Food Environment Metrics
There are many metrics to assess the healthfulness, availability, and accessibility of food environments, yet no consensus has been reached on which to use (Feng, Glass, Curriero,
9
network, radial/Euclidean/straight line distance, or travel time) (Feng et al., 2010),
diversity/variety of resources (Black et al., 2014), as well as objective and perceived measures on availability, price, and quality of food establishments (Gustafson, Christian, Lewis, Moore, & Jilcott, 2013). Despite their widespread use in the literature, these measurements have yet to be evaluated for validity, reliability, sensitivity to change, and use among diverse populations (Story et al., 2009).
Food outlet density is a popular metric because calculations are relatively simple to compute from available data and easy to interpret (Caspi, Sorensen, Subramanian, & Kawachi, 2012; Feng et al., 2010). Food outlet density calculations may include: total count of food outlets within a specific area (e.g., radial/Euclidean vs. line-based/road network buffer), count per population (e.g. defined area/100,000 people), or count per square area (Black et al., 2014; Caspi et al., 2012; Thornton, Pearce, Macdonald, Lamb, & Ellaway, 2012).
10
traversable (e.g., the buffer may include natural features, such as a body of water) (James et al., 2014). Alternatively, road network buffers are created by tracing a distance from a centroid (e.g., home) via the street network (James et al., 2014), providing greater accuracy than radial buffers.
Defining Appropriate Spatial Scale for Proposed Study
There is no consensus on the most appropriate spatial scale at which to measure environmental exposures (Story et al., 2009). Scale selection may depend on the following considerations: nature (and frequency of) exposure, the environmental exposure in question, individual characteristics, study area, health outcome, and whether potential or actual contact is of interest (Chaix et al., 2012). In health services research, the concept of “distance decay” stipulates that people tend to use resources that are close by and that their utilization of resources elsewhere decrease with distance (Cromley & McLafferty, 2002). Additional costs, time, and effort are required to get to places that are further away. Furthermore, knowledge of and familiarity with places declines with distance (Cromley & McLafferty, 2002).
11
buffer around homes encompassed 55% of all food establishments, 57% of fast
food/convenience stores, and 64% of grocery stores/supermarkets visited. Alternatively, 5 miles (a drivable distance) has been cited in previous food environment studies conducted in both rural (Sharkey, Horel, Han, & Huber, 2009) and urban areas (Reitzel et al., 2016). Liu and colleagues (2015) found that a 5 mile buffer around homes encompassed 80% of all food establishments, 82% of fast food/convenience stores, and 84% of grocery stores/supermarkets visited (Liu et al., 2015). Results from this dissertation will add insight about spatial scale in food environment research.
Data Collection Methods
Most food environment studies have been cross-sectional and have relied on primary and/or secondary data collection methods (Feng et al., 2010). Primary data collection involves environmental scans by walking or driving through neighborhoods and geocoding points with global position system (GPS) receivers (Charreire et al., 2010; Kelly, Flood, & Yeatman, 2011). Alternatively, secondary data collection methods, more commonly used, employ online
12 Research on Food Environments and Eating Habits
Food environment studies on food environments and eating habits have largely focused on residential neighborhood availability of food outlets (Gordon-Larsen, 2014). While many studies support associations between density of supermarkets/grocery stores and better dietary outcomes, and density of fast food outlets and convenience stores and poorer dietary outcomes, findings have been mixed across the literature (Black et al., 2014; Gordon-Larsen, 2014).
Studies exploring food exposures around home locations and associations with eating habits
Access to supermarkets/grocery stores, restaurants, and convenience stores in residential neighborhoods has been shown to be associated with eating habits. Several studies and their findings are highlighted below.
Access to supermarkets/grocery stores near home. Several noteworthy food
environment papers have emerged from the Multi-Ethnic Study of Atherosclerosis (MESA) – a large-scale, multi-site, longitudinal study of cardiovascular disease and its risk factors among U.S. adults aged 45-84 years. One MESA study involving 2,384 ethnically diverse,
13
supermarkets near home were 25% and 46% less likely to have a healthy diet, as measured by the AHEI and FPM, respectively, than those with more stores near their homes (Moore et al., 2008). As the authors suggest, access to nearby supermarkets is likely to encourage the purchase and consumption of healthier foods, like fresh produce.
The Atherosclerosis Risk in Communities Study (ARIC) is another large-scale,
longitudinal, cohort study involving predominantly low-income U.S. adults aged 45-64 living in Maryland, North Carolina, Mississippi, and Minnesota. Using data on 10,623 ARIC participants, Morland, Wing, and Roux (2002) geocoded participants’ home addresses to census tracts, and found that residents living in census tracts with greater access to neighborhood supermarkets consumed more fruits and vegetables. For every additional supermarket in a census tract, produce consumption increased 32 percent for African Americans and 11 percent for whites.
Access to restaurants near home. Another MESA study examined associations between neighborhood fast food exposure, fast food consumption, and diet among 5,633 ethnically
diverse, predominantly low-income participants living in Maryland, North Carolina, and New York (Moore, Diez-Roux, Nettleton, Jacobs, & Franco, 2009). Neighborhood fast food exposure (assessed by three measures: fast food outlet density within 1 mile of home; self-reported
exposure to fast foods within 1 mile of home; and informant perceptions on the quality of the food environment) was positively associated with fast food intake, but the strength of these associations differed by neighborhood fast food exposure measure. When neighborhood
14
the FPM measure described in aforementioned MESA study); particularly, the odds of having a healthy diet decreased by 12 percent (as measured by self-report measure) and 17 percent (as measured by informant report and fast food outlet density measures). When diet was measured by the AHEI (described in aforementioned MESA study), the odds of having a healthy diet decreased by 14 percent according to informant report; these associations were not significant according to self-report and fast food outlet density measures (Moore et al., 2009).
Access to convenience stores near home. Using data on 3,922 participants of the Coronary Artery Risk Development in Young Adult (CARDIA) study, a longitudinal study involving young black and white adults aged 18-30 living in Alabama, Illinois, Minnesota, and California, Rummo and colleagues (2015) investigated associations between neighborhood convenience store exposure (assessed by percentage of convenience stores relative to other food stores and restaurants within a 3 kilometer/1.86 mile road network buffer around home), diet quality, and consumption of single food items. The authors found that, among lower-income individuals, the presence of convenience stores near home was negatively associated with diet quality and whole grain consumption. These associations were found to be weaker for higher-income individuals.
15
however, appear across the literature as demonstrated by Black and colleagues’ (2014) review paper, which found a majority of studies reporting no significant associations at all. This review of 42 articles investigating neighborhood food environment exposures and dietary outcomes found that 27% of food outlet density findings confirm the association between
supermarket/grocery store density and better dietary outcomes, while 22% of density findings support the association between fast food outlet and convenience store density and poorer dietary outcomes (Black et al., 2014). Among findings related to proximity to the nearest food outlet, 20% of findings support the association between proximity to supermarkets/grocery stores and better dietary outcomes, while 13% of findings support the association between proximity to fast food outlets and convenience stores and poorer dietary outcomes (Black et al., 2014). Thus, while there is some evidence confirming associations in expected directions, the majority of the studies included in this review paper reported no associations. As the authors suggest,
heterogeneity across studies with respect to categorization of outlets, definition of neighborhood and measurement of exposure variables, as well as the ecological design of many studies is likely to contribute to these mixed findings. Further research is needed to provide clarity on
associations between food outlet availability and eating habits, and more importantly on environments that extend beyond the home.
Studies exploring food exposures around home and workplace/activity space locations and associations with eating habits
Simultaneous research on both residential and non-residential environments and eating habits are largely absent in the food environment literature. A systematic review of
16
diabetes, dyslipidemias, and the metabolic syndrome) found that 90% of 131 studies focused exclusively on the residential environment; 6% focused on non-residential environments (i.e., workplaces, schools); and 4% focused on both residential and non-residential environments (including several studies that have assessed environments around home and school among children, but only one study, Jeffery, Baxter, McGuire, and Linde (2006), that has looked at environmental influences around home and work) (Leal & Chaix, 2011). Since the review by Leal and Chaix (2011), there has been a growing interest in research that addresses both residential and non-residential environments. The following discussion summarizes seven studies that have looked at associations between food exposures in home and work environments and eating as well as Body Mass Index (BMI) outcomes.
17
restaurants and convenience stores. My dissertation explores a full range of food outlets that would be available to workers. Furthermore, the sample primarily included full-time workers, with higher income (mean = $65,786) and education (mean = 14.3 years), while my dissertation focuses exclusively on low-income child care workers.
Zenk and colleagues (2011) compared environmental features of residential
18
study explored a sample of low-income women, only 1/3 of whom were employed; thus a focus on low-income child care workers adds to literature pertaining to this population.
The Promoting Activity and Changes in Eating (PACE) study evaluated worksite neighborhood socioeconomic status (SES) (as measured by appraised worksite property value) and changes in obesogenic behaviors among 1,007 employees within 26 worksites (including blue-collar worksites: manufacturing, transportation and utilities, and distribution; and white-collar worksites: personal, professional, unclassified services) in Washington (Barrington, Beresford, Koepsell, Duncan, & Moudon, 2015). The authors also looked at densities of
residential units, intersections, food stores, and restaurants within 0.5 mile of worksites. Higher worksite SES was positively associated with access to food stores (grocery stores and specialty produce markets), convenience stores, dine-in restaurants, and fast food restaurants. In addition, the authors found a positive relationship between residential density and eating five or more fruits and vegetables, and that residential density completely mediated the relationship between worksite neighborhood SES and fruit and vegetable intake. The authors posit that residential density around worksites may contribute to neighborhood “walkability,” which could translate into greater access to healthy foods and physical activity opportunities. However, no statistically significant associations were found between food outlet density and eating habits (Barrington et al., 2015). It is important to note that the worksite neighborhood SES measure actually assesses the SES/‘value’ of the worksite itself, not the surrounding neighborhood, and that larger
19
where workers live also matters; workers’ residential neighborhood SES can reinforce or offset the impact of worksite neighborhood SES, so both environments are worthy of consideration. For these reasons, my dissertation considers the poverty level of census tracts where workers live and work as moderators on associations between workers’ eating habits and spatial access to food outlets.
Access to restaurants around home and work. Jeffery and colleagues (2006) investigated whether proximity to fast food and other food outlets around home or work locations was associated with eating at restaurants and BMI among a sample of 1,033 adults, who were generally older (mean age = 46), predominantly female, and of higher education, in Minnesota. They calculated food outlet density by counting the number of food outlets within radial/Euclidean buffers of 0.5 miles, 1 mile, and 2 miles of home and work addresses; and, found that over twice as many food outlets were located within 2 miles of workplaces than within 2 miles of homes. The authors found that working outside the home and having children were associated with higher frequency of eating at fast food outlets. Proximity to fast food places (defined as serving quick service burger, roast beef, and pizza) within 2 miles of homes was not associated with self-reported frequency of eating at those places or with BMI; however,
proximity of non-fast food places within 2 miles of homes was associated with eating at those places, but not BMI. No relationships were found between food outlet proximity around
workplaces and eating at those places. Among men, the authors observed an inverse relationship between restaurants around workplaces and BMI, whereby men with more restaurants (both fast food and non-fast food) close to their workplace were leaner. Overall, the authors found
20
environments around home and work locations are both examined. However, it is unclear what employment sectors are represented in the sample; conversely, my dissertation provides insight on a specific working population, child care workers. Furthermore, restaurant density was defined as the number of restaurants within radii of 0.5 miles, 1 mile, and 2 miles of home and work locations, while other studies have based their findings on only one buffer radius. The authors reported on findings at 2 miles because findings at 0.5 mile and 1 mile were
nonsignificant. Consequently, my dissertation assesses two scales representing walkable and drivable distances because there is no gold standard buffer size/scale.
21
exposures around workplaces and commutes. This study, however, did not investigate
associations with eating habits; thus, my dissertation supplements these findings. In a follow-up study, Burgoine, Forouhi, Griffin, Wareham, and Monsivais (2014) found that exposure to fast food outlets around the home and workplace was positively and significantly associated with fast food consumption, however, a dose-response relationship was found only for exposure around the workplace and fast food intake. Combined fast food exposures around the home, workplace, and commute was positively and significantly associated with fast food consumption and BMI. This study is limited in a couple of ways: the authors employed only 1-mile radial/Euclidean buffers around homes and workplaces to calculate fast food outlet density, and fast food intake was the only dietary outcome studied. My dissertation explores associations between not only fast food outlet density, but that of other food outlets as well, using two buffer shapes at two scales, and an overall eating habits measure.
Gaps in the Literature
My dissertation adds new knowledge and addresses gaps in the literature by: 1)
comparing food exposures around home and work locations, and along commutes; 2) exploring a full spectrum of supermarkets/grocery stores, convenience stores, and limited-service
restaurants; 3) using density measures to assess food environment exposures at two scales (1 mi. & 5 mi.) and by different buffer shapes (radial-based and road network-based buffers); 4)
22
CHAPTER 3. CONCEPTUAL MODEL
Conceptual Model for Understanding Relationships between Food Environments and Eating Habits
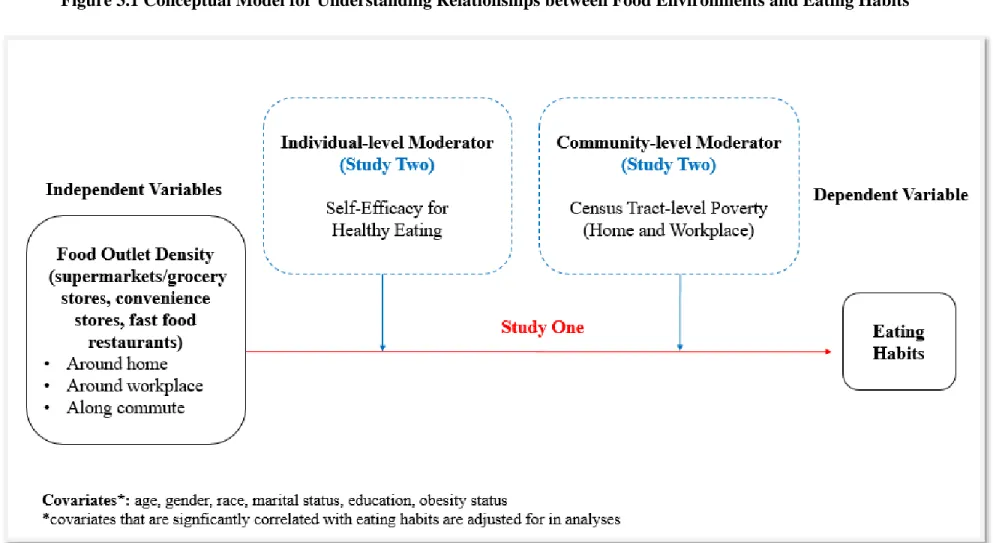
The conceptual model (Figure 3.1) for my dissertation draws upon the following theoretical and conceptual frameworks.
Social Ecological Framework
The social ecological framework (SEF) is a helpful organizing framework for thinking about the variety of determinants that act and interact at the individual, interpersonal,
organizational, community, and public policy levels to influence behavior (McLeroy, Bibeau, Steckler, and Glanz, 1988; Stokols, 1992; Stokols, Pelletier, & Fielding, 1996). The SEF
assumes that behavior both affects, and is affected by, multiple levels of influence; and, behavior both shapes, and is shaped by, environmental factors.
In the case of child care worker behaviors, this theoretical framework considers
influences from the worker (individual-level), the workers’ home and workplace environments, and the larger community as crucial to understanding environmental influences on eating habits among workers. Factors operating at these levels are explained in further detail below.
Social Cognitive Theory
23
framework, a key feature of the SCT is reciprocal determinism — the dynamic interplay between behavior, personal factors (sociodemographic characteristics and psychosocial factors) and the social and physical environment, in which behavior influences and is influenced by personal factors and the environment (Bandura, 1986). My dissertation’s conceptual model reflects the triadic dynamic among the three main components of the SCT: behavior, personal factors, and environment. The following discussion organizes these three components by the individual, organizational, and community levels of the SEF.
Individual-level factors
1. Behavior. Individuals’ eating habits (the outcome variable) is the behavior of interest in this study.
2. Personal factors. Eating habits emerge from a host of personal factors, including one’s preferences for particular foods, aversions to certain foods, emotions, and age (Furst, Connors, Bisogni, Sobal, & Falk, 1996). Simultaneously, food environments may affect people differently depending on factors that dictate one’s agency, such as socioeconomic status and transportation mode to work (Ball, Crawford, Timperio, & Salmon, 2010). The conceptual model captures ‘personal factors’ through the individual-level moderating variable to be studied: self-efficacy (confidence) for healthy eating.
24
Baranowski, 1999; Trapp et al., 2015). Thus, self-efficacy for healthy eating is included as a proposed moderator in the conceptual model (Study Two) and is expected to alter the
strength/direction of associations between food exposures and eating habits, thereby elucidating for whom and under what conditions food exposures and eating habits relate to one another. Other personal factors are included as potential covariates with eating habits and were informed by the literature: workers’ age, gender, race, marital status, highest level of education, and obesity status. These variables are described in detail in both studies.
Organization-level factors
25
Community-level factors
Community-level factors shape food outlet distribution and access across communities. Community-level factors are captured via the proposed moderators: home and workplace census tract-level poverty (Study Two).
Research Questions
The research questions driving this dissertation are:
Study One: What is the association between child care workers’ eating habits and spatial access to food outlets around home, workplace and along commutes?
Study Two: Do self-efficacy for healthy eating and/or home and workplace census tract-level poverty moderate the relationship between child care workers’ eating habits and spatial access to food outlets around home, workplace and along commutes?
26
27
CHAPTER 4. STUDY ONE: MAIN EFFECTS ASSOCIATIONS BETWEEN CHILD CARE WORKERS’ EATING HABITS AND SPATIAL ACCESS TO FOOD OUTLETS
AROUND WORKERS’ HOMES, WORKPLACES, AND ALONG COMMUTES
Introduction
Improving healthy food access is key to ensuring that people have the ability to make healthy food choices, thereby reducing risks for obesity, cancer, and related chronic illnesses. An important line of research explores linkages between food environments (i.e., the spatial
28
home is rare in the food environment literature. And, little attention has focused on assessing food access in both urban and rural settings simultaneously (Gordon-Larsen, 2014). Comparisons between urban and rural contexts can provide important insight into spatial food access
inequities. These knowledge gaps limit our ability to determine the breadth of upstream environmental determinants of eating habits (e.g., diet, dietary behaviors, dietary intake, and food intake). A greater understanding of food environments as they relate to eating habits is crucial to identifying structural determinants of obesity and other chronic diseases that could be targeted through environmental and policy interventions.
The workplace environment is especially important and relevant to adults, yet understudied with respect to its food environment. In the U.S., more than 60% of adults are employed (U.S. Bureau of Labor Statistics, 2017) spending a majority of their day (~8 hours) at the workplace — an environment that may or may not provide healthy food and beverage choices (CDC, 2017b; Goetzel & Ozminkowski, 2008; Hipp et al., 2015). Moreover, the environment surrounding the workplace may yield mixed options for making healthy food selections. In fact, one study by Burgoine and Monsivais (2013) compared food environment exposures around the home, workplace, and commute among working adults in Cambridgeshire, U.K., and found greater exposure to convenience stores, restaurants, supermarkets, and takeaway “fast food” outlets around work compared to home, though the authors did not investigate
29
understand the array of food options that are available to working adults, food environment research should explore eating habits and influences from food exposures around homes, workplaces, and commutes.
This present study advances food environment research by examining the influence of multiple food environments (around home, work, and along commutes) on eating habits among low-wage child care workers. With over 1.3 million workers in the U.S., majority of whom are women and over 40% of whom are racial and ethnic minorities (Whitebook, McLean, & Austin, 2016), the child care workforce endures physically, mentally, and emotionally demanding work while earning an average of $9.77 per hour or $20,320 annually (U.S. Bureau of Labor Statistics, 2017). In addition, they face heightened risks for obesity, high blood pressure,
30
Using baseline data from the CAring and REaching for Health (CARE) study, a large cluster-randomized trial conducted in NC evaluating the impact of a child care-based workplace health and safety intervention, this study will assess child care workers’ spatial access to
supermarkets/grocery stores, convenience stores, and fast food restaurants around home, work, along commutes, and how these food exposures impact their eating habits. This study examines the extent to which child care workers’ spatial access to food outlets (defined as food outlet density = food outlet count per defined buffer) around: 1) homes (home address), 2) child care centers (workplace address), and 3) the commute (road distance between home and work) are associated with workers’ eating habits (as measured by “eating habits score” based on an eating habits scoring system developed for this study).
Hypotheses
In this paper, I test the following hypotheses:
Hypothesis 1a: There is a positive relationship between supermarket/grocery store density and eating habits, such that the higher the number of supermarkets/grocery stores in a given
geographic area, the better the eating habits of child care workers.
31
Hypothesis 1b: There is a negative relationship between convenience store density and eating habits, such that the higher the number of convenience stores in a given geographic area, the poorer the eating habits of child care workers.
Rationale: Proximity to convenience stores near home is associated with poorer diets (Rummo et al., 2015). No available studies have been conducted around workplaces, but a similar negative relationship is expected. Greater exposure to conveniences stores along commutes is also expected to encourage the purchase of unhealthy snacks and beverages as workers travel to work, head back home from work, or stop by during the day.
Hypotheses 1c: There is a negative relationship between limited-service (“fast food”) restaurant density and eating habits, such that the higher the number of fast food restaurants in a given geographic area, the poorer the eating habits of child care workers.
Rationale: Proximity to fast food restaurants near home is associated with poorer diets (Moore et al., 2009). Exposure to fast food outlets around the home and workplace is positively associated with fast food consumption (Burgoine et al., 2014). Greater exposure to fast food restaurants along commutes is expected to encourage the purchase of unhealthy “fast food” as workers travel to work, head back home from work, or stop by during the day.
32 Methods
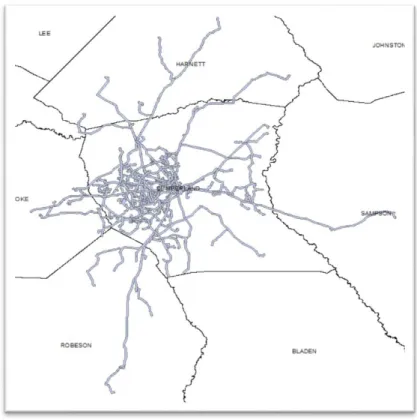
This cross-sectional study includes a sample of child care workers recruited into the CARE study, a cluster-randomized trial testing the efficacy of a Healthy Lifestyles Intervention vs. Healthy Finances program (attention-control arm) conducted in child care centers across seven counties in central North Carolina. Over the course of four waves of data collection, the research team targeted recruitment in counties that included urban and rural, moderate-to-low income, and similar racial and ethnic populations compared to the state. Baseline assessments were conducted in June 2015 for Wave 1, October 2015 for Wave 2, April 2016 for Wave 3, and October 2016 for Wave 4. Figure 4.1 highlights the selected counties: Cumberland (Waves 1 and 2), Forsyth, Rowan, and Davidson (Wave 3), and Franklin, Granville, and Vance (Wave 4) (Figure 4.1). Wave 1 - 3 counties were relatively more urban compared to the more rural Wave 4 counties.
33
34
Participant-Level Data Collection and Measures
During an on-site visit held during the baseline assessment period of each wave,
participants completed the Carolina Health Assessment & Risk Tool (CHART), an online survey with modules assessing socio-demographics, health behaviors (physical activity, diet, tobacco use, sleep habits, and stress), psychosocial factors related to health behaviors, as well as participation and interest in worksite wellness efforts at the center.
Socio-demographic characteristics. Participants reported their age, gender, race, Hispanic ethnicity, highest level of education, annual household income, marital status, household
composition (# of adults, # youth in home), mode of transportation to work, role/job position at the center, and insurance status. The response categories used to define these variables are listed in Table 4.3.
Physical measurements. Baseline assessments also included a series of physical measurements conducted by trained data collectors, including: 1) height (in.) using a Shorr measuring board (Shorr Productions, Olney, MD, USA), 2) weight (lb.) measured with Seca model 874 portable electronic scale (Seca Corporation, Columbia, MD, USA), and 3) waist circumference (cm.) measured with a Gulick II (Patterson Medical, Warrenville, IL, USA) measuring tape. Standard measurement protocols were followed (National Health and Nutrition Examination Survey (NHANES), 2007; Pickering et al., 2005). Measured height and weight were used to calculate BMI and weight status (underweight = BMI < 18.5; normal weight = BMI 18.5–24.9; overweight = BMI 25.0–29.9; obese = BMI > 30.0). These data were used in the present study to describe participant health characteristics.
35
eat the same meals and snacks that are provided for children? (response options: yes; no; no, it is against center policy); 2) is this your primary source of food daily? (yes/no). Participants who answered ‘no’ to eating the same meals and snacks provided for children were asked about the primary source of meals and snacks that they ate throughout the day at work (marking all the following options that applied yes/no): 1) packed from home; 2) on-site snack bar; 3) on-site vending machine; 4) food/catering truck; 5) local fast food restaurant; 6) local convenience store. These data were used for exploratory purposes to describe workers’ eating practices at work.
Center-Level Data Collection and Measures
Center administrators (i.e., owners, directors, assistant directors) were asked to complete additional questions pertaining to the center, such as size (# of staff, # of children served), years of operation, North Carolina Division of Child Development - Quality Rating and Improvement System (QRIS) star rating (1-5 stars; where 5 stars = highest quality and standards related to programing and staff education), current participation in the Child Adult Care Food Program (CACFP), and accreditation by the National Association for the Education of Young Children (NAEYC). These data were collected for the parent study and used in the present study to examine the external validity of the data. Only participant-level demographic data were used as covariates in this study.
36 Dependent Variable - Eating Habits Score
Overview of Eating Habits Scoring Development: For this study, in consultation with Dr. Leslie Lytle, I developed an eating habits score with items collected as part of the dietary
screener included in the CHART survey. At baseline, participants were asked to recall how frequently they consumed 23 food items during the past month. Items on this screener were slightly modified from the Dietary Screener Questionnaire, (Thompson et al., 2004; Thompson et al., 2005), which was used in the 2009-2010 National Health and Nutrition Examination Survey (CDC, 2017c), and the Diet History Questionnaire (Block et al., 1990). A previous validation study found that estimated intakes from this screener have moderate to high correlations (0.5 to 0.8) with estimated intakes from dietary recalls (Thompson et al., 2004). Original screener items capture intake of fruits, vegetables, fiber/whole grains, added sugars, diary/calcium, and red and processed meat. To tailor the screener to the needs of the CARE study, some items were merged (e.g., separate questions on soda and sweetened fruit drinks were combined into one item about sugar-sweetened beverages), other items were eliminated (e.g., salsa, pizza, tomato sauce), and a few new items were added (e.g., dark green vegetables, eggs, lean meats, seafood, salty snacks, premade foods, dining out).
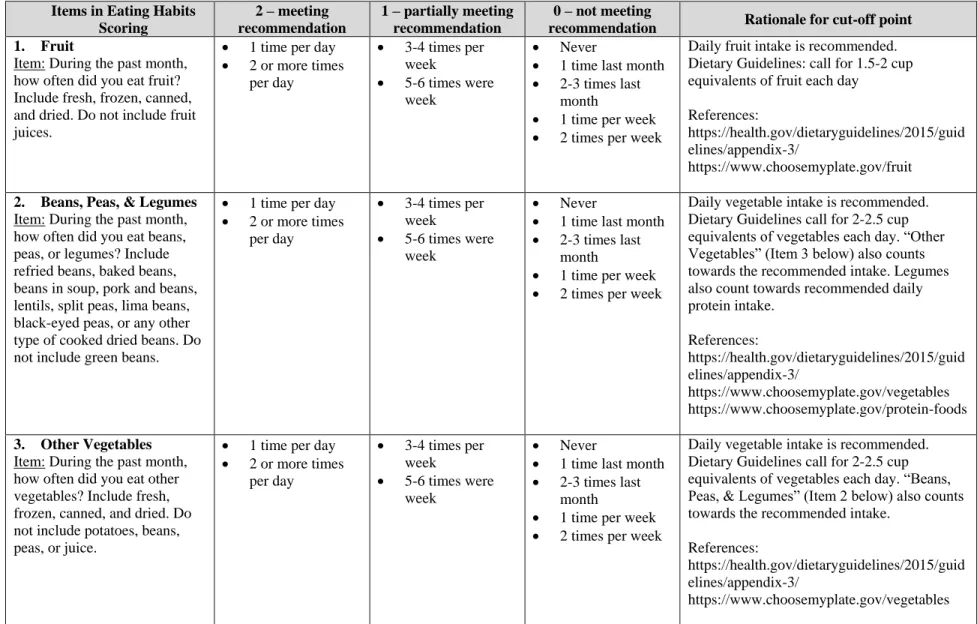
Eating Habits Items and Scoring: Ten items reflecting healthy and unhealthy foods were selected to create an overall “Eating Habits Score”: (1) fruit; (2) beans, peas, legumes; (3) other vegetables; (4) whole grains; (5) red meat; (6) cold cuts, luncheon meats, other deli-style meats; (7) sweetened fruit drinks, coffee, tea, sports energy drinks, regular soda/pop; (8) sweets; (9) salty snacks; (10) prepared foods (see Table 4.1). Dietary guidelines encourage daily
37
with weight gain and obesity (DeSalvo, Olson, & Casavale, 2016; Office of Disease Prevention and Health Promotion (ODPHP), 2016). Thus, both healthy (e.g., vegetables) and unhealthy (e.g., sweets) food items were included in this eating habits score to reflect overall eating habits.
Scoring criteria were broadly based on dietary guidelines: for each item, a score of “2” was applied if the frequency response was “meeting recommendations,” a score of 1 if the response was “partially meeting recommendations,” while a score of “0” was applied if the response was “not meeting recommendations” (shown in Table 4.1). For items 1-4 (fruit,
legumes, other vegetables, and whole grains), higher scores were applied to daily intake of those items (ODPHP, 2016; USDA, 2017b). For items 5-10 (red meat, cold cuts and luncheon meats, sugar-sweetened beverages, sweets, salty snacks, and prepared foods), higher scores were applied to less frequent intake (once a week or less often) (note: dietary guidelines recommend limited intake of these items, but do not specify frequency with which to consume/avoid these items). All 10 items were summed to create a total “Eating Habits Score,” ranging from 0 to 20, with a higher eating habits score reflecting healthier eating habits that align more closely with dietary guidelines. This process parallels steps taken by Trapp and colleagues (2015) in developing their dietary quality measures.
Eating Habits Score Distribution: Response categories were converted to daily
38
39
Table 4.1. Eating Habits Scoring Criteria
Items in Eating Habits Scoring
2 – meeting recommendation
1 – partially meeting recommendation
0 – not meeting
recommendation Rationale for cut-off point 1. Fruit
Item: During the past month, how often did you eat fruit? Include fresh, frozen, canned, and dried. Do not include fruit juices.
1 time per day 2 or more times
per day
3-4 times per week
5-6 times were week
Never
1 time last month 2-3 times last
month
1 time per week 2 times per week
Daily fruit intake is recommended. Dietary Guidelines: call for 1.5-2 cup equivalents of fruit each day
References:
https://health.gov/dietaryguidelines/2015/guid elines/appendix-3/
https://www.choosemyplate.gov/fruit
2. Beans, Peas, & Legumes Item: During the past month, how often did you eat beans, peas, or legumes? Include refried beans, baked beans, beans in soup, pork and beans, lentils, split peas, lima beans, black-eyed peas, or any other type of cooked dried beans. Do not include green beans.
1 time per day 2 or more times
per day
3-4 times per week
5-6 times were week
Never
1 time last month 2-3 times last
month
1 time per week 2 times per week
Daily vegetable intake is recommended. Dietary Guidelines call for 2-2.5 cup equivalents of vegetables each day. “Other Vegetables” (Item 3 below) also counts towards the recommended intake. Legumes also count towards recommended daily protein intake. References: https://health.gov/dietaryguidelines/2015/guid elines/appendix-3/ https://www.choosemyplate.gov/vegetables https://www.choosemyplate.gov/protein-foods
3. Other Vegetables Item: During the past month, how often did you eat other vegetables? Include fresh, frozen, canned, and dried. Do not include potatoes, beans, peas, or juice.
1 time per day 2 or more times
per day
3-4 times per week
5-6 times were week
Never
1 time last month 2-3 times last
month
1 time per week 2 times per week
Daily vegetable intake is recommended. Dietary Guidelines call for 2-2.5 cup equivalents of vegetables each day. “Beans, Peas, & Legumes” (Item 2 below) also counts towards the recommended intake.
References:
https://health.gov/dietaryguidelines/2015/guid elines/appendix-3/
40
Items in Eating Habits Scoring
2 – meeting recommendation
1 – partially meeting recommendation
0 – not meeting
recommendation Rationale for cut-off point 4. Whole Grains
Item: Of the times you ate grains during the past month, how often were they whole grains? Include oatmeal, rye, pumpernickel or whole wheat bread, whole cornmeal, brown rice, barley, bulgur, quinoa, millet, whole wheat pasta and popcorn.
1 time per day 2-3 times per day 4-5 times per day 6 or more times
per day
3-4 times per week 5-6 times per
week
Never
1 time last month 2-3 times last
month
1 time per week 2 times per week
Daily whole grain intake is recommended.
References:
https://health.gov/dietaryguidelines/2015/guid elines/appendix-3/
https://www.choosemyplate.gov/grains
5. Red Meat
Item: During the past month, how often did you eat red meat? Include beef, pork, ham, sausages, veal, and lamb. Include red meat you had in soup, stew, lasagna, or other mixed dishes. Do not include chicken, turkey, or seafood.
Never
1 time last month 2-3 times last
month
1 time per week
2 times per week 3-4 times per week 5-6 times per
week
1 time per day 2 or more times
per day
Red meat intake should be limited.
6. Cold Cuts, Luncheon meats, other deli-style meats
Item: During the past month, how often did you eat cold cuts, luncheon meats or other deli-style meats? Include hot dogs, bacon, jerky, cured meats, and bologna.
Never
1 time last month 2-3 times last
month
1 time per week
2 times per week 3-4 times per week 5-6 times per
week
1 time per day 2 or more times
per day
Deli-style meats intake should be limited (to reduce intake of saturated and trans fats, sodium).
7. Sweetened Fruit Drinks, Coffee, Tea, Sports Energy Drinks, Regular Soda/Pop
Item: During the past month, how often did you drink sweetened fruit drinks, coffee, tea, sports energy drinks or regular soda or pop? Include drinks like Kool-Aid,
Never
1 time last month 2-3 times last
month
1 time per week
2 times per week 3-4 times per
week
5-6 times per week
1 time per day 2-3 times per day 4-5 times per day 6 or more times
per day
41
Items in Eating Habits Scoring
2 – meeting recommendation
1 – partially meeting recommendation
0 – not meeting
recommendation Rationale for cut-off point lemonade, Hi-C, cranberry
drink, fruit juices made at home with sugar, sweet tea, hot chocolate, coffee with sugar, iced coffee drinks,
Frappuccino, flavored lattes, macchiato, mochas, Gatorade, Red Bull, and Vitamin Water. Do not include diet drinks, diet soda, diet pop or artificially sweetened drinks.
8. Sweets
Item: During the past month, how often did you eat sweets? Include cakes, cookies, pie, brownies, doughnuts, sweet rolls, Danish, muffins, pastries, ice cream, other frozen
desserts, chocolates, and candy. Do not include sugar-free kinds.
Never
1 time last month 2-3 times last
month
1 time per week
2 times per week 3-4 times per
week
5-6 times per week
1 time per day 2-3 times per day 4-5 times per day 6 or more times
per day
Sweets intake should be limited (to reduce intake of added sugars).
9. Salty Snacks
Item: During the past month, how often did you eat salty snacks? Include potato chips, corn chips, crackers, pretzels, popcorn, and salted nuts.
Never
1 time last month 2-3 times last
month
1 time per week
2 times per week 3-4 times per
week
5-6 times per week
1 time per day 2-3 times per day 4-5 times per day 6 or more times
per day
Salty snacks intake should be limited (to reduce sodium intake).
10. Prepared Foods Item: During the past month, how often did you eat meals, side dishes or appetizers that were prepared from frozen, cans or boxes? Include foods like pizza, pasta or rice dishes, potpies, chicken wings, tenders or nuggets, mozzarella sticks, taquitos, egg rolls, onion rings,
Never
1 time last month 2-3 times last
month
1 time per week
2 times per week 3-4 times per
week
5-6 times per week
1 time per day 2-3 times per day 4-5 times per day 6 or more times
per day
Prepared foods intake should be limited (to reduce intake of saturated and trans fats, sodium).
42
Items in Eating Habits Scoring
2 – meeting recommendation
1 – partially meeting recommendation
0 – not meeting
recommendation Rationale for cut-off point French fries, and frozen
dinners. Do not include plain, frozen vegetables.
Note: Response categories were converted to daily frequencies per NHANES scoring procedures. Reference: http://epi.grants.cancer.gov/nhanes/dietscreen/scoring/convert.htm
Response categories Daily frequencies
Never 0 times
1 time last month 0.033 times 2-3 times last month 0.083 times 1 time per week 0.143 times 2 times per week 0.286 times 3-4 times per week 0.5 times 5-6 times per week 0.786 times
1 time per day 1 time
43
Figure 4.2: Eating Habits Score Distribution
Food Environment Measures
Geocoding and Buffering Center and Home Locations: Home and center addresses were verified, cleaned (e.g., fix misspelling errors), geocoded by latitude and longitude coordinates, and mapped within ArcGIS geographic information system software (version 10.2.1). Home addresses spanned 26 counties (including the 7 counties targeted for center recruitment, plus 19 other counties). Creating 5 mile buffers around home addresses extended into an additional 6 counties, while creating 5 mile buffers around centers covered 18 counties. Altogether, 32 counties comprised the overall study area for this study.
Food Outlet Data Collection and Processing: Secondary data collection methods involving the use of online commercial databases have demonstrated good-to-moderate percentage agreement and sensitivity for correctly identifying and locating existing businesses (Bader et al., 2010; Boone et al., 2008; James et al., 2014; Paquet et al., 2008). Food outlet data
1 3
9 16 18
33
57 61
69 68 71 66
54
39 31
18 12
6
3 2 1
0 10 20 30 40 50 60 70 80
0 1 2 3 4 5 6 7 8 9 10 11 12 13 14 15 16 17 18 19 20
Fr
equ
ency
Eating Habits Score
44
for the study area were gathered from ReferenceUSA, (www.referenceusa.com) a comprehensive online database of 24 million U.S. facilities and businesses, searchable by geography, business type, business size, and other factors. According to a review by Fleischhacker, Evenson,
Sharkey, Pitts, and Rodriguez (2013), when ReferenceUSA and other commercial resources were compared with on-site verification, commercial resources yielded acceptable to excellent (0.65 to 0.86) percentage agreement with on-site verification, moderate-to-excellent sensitivity (0.60 to 0.96), good-to-excellent positive predictive value (0.70 to 0.94), and excellent concordance (0.94) (Fleischhacker et al., 2013). Although a valid secondary data source to use for this study, steps were taken to further verify and clean ReferenceUSA data as described below.
Data Selection and Downloading: Custom searches were performed for food outlets using North American Industry Classification System (NAICS) codes (a standard six-digit coding system that classifies business establishments in 20 industries searchable at
45
46
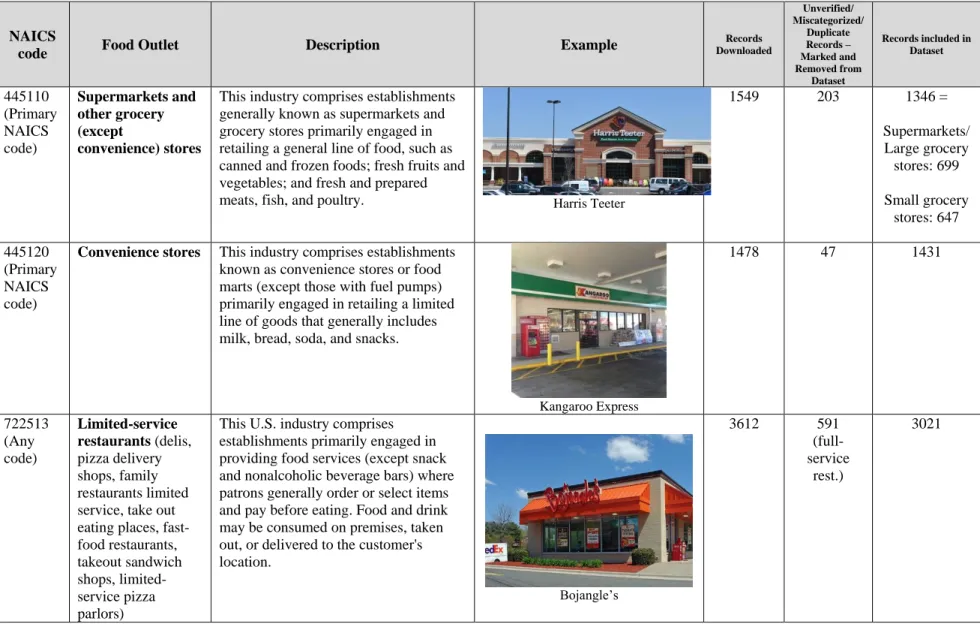
Table 4.2: NAICS Codes for Generating a List of Potential Food Outlets (Food Outlet Types) and # of Records Downloaded and Processed
NAICS
code Food Outlet Description Example
Records Downloaded Unverified/ Miscategorized/ Duplicate Records – Marked and Removed from Dataset
Records included in Dataset 445110 (Primary NAICS code) Supermarkets and other grocery (except convenience) stores
This industry comprises establishments generally known as supermarkets and grocery stores primarily engaged in retailing a general line of food, such as canned and frozen foods; fresh fruits and vegetables; and fresh and prepared
meats, fish, and poultry. Harris Teeter
1549 203 1346 =
Supermarkets/ Large grocery stores: 699 Small grocery stores: 647 445120 (Primary NAICS code)
Convenience stores This industry comprises establishments known as convenience stores or food marts (except those with fuel pumps) primarily engaged in retailing a limited line of goods that generally includes milk, bread, soda, and snacks.
Kangaroo Express
1478 47 1431
722513 (Any code)
Limited-service restaurants (delis, pizza delivery shops, family restaurants limited service, take out eating places, fast-food restaurants, takeout sandwich shops, limited-service pizza parlors)
This U.S. industry comprises establishments primarily engaged in providing food services (except snack and nonalcoholic beverage bars) where patrons generally order or select items and pay before eating. Food and drink may be consumed on premises, taken out, or delivered to the customer's location.
Bojangle’s
3612 591 (full-service
rest.)
47
Data Cleaning and Processing: ReferenceUSA data were downloaded as Excel
spreadsheets by NAICS code and by county. Spreadsheets included data fields, such as address, latitude, longitude, annual sales, and number of employees. A thorough data cleaning and
verification process was carried out to verify food outlet locations (confirm they were in business and at the same location) and to identify and correct miscategorizations by food outlet
type/NAICS code (e.g., ConvenienceUSA (a convenience store) was moved from the grocery store dataset to the convenience store dataset). As recommended by Lucan (2015), I triangulated multiple data sources for a more complete inventory of food outlets. I reviewed and verified locations through GoogleEarth, Google searches, and food outlet websites. Duplicates and unverified locations were ‘marked’ and removed in the data cleaning process. Table 4.2 notes the number of records downloaded, marked as unverified/miscategorized/duplicate and removed, and included in the final dataset for each food outlet type.