1 *Corresponding author
Email address: [email protected]
Experimental and finite-element free vibration analysis and artificial
neural network based on multi-crack diagnosis of non-uniform
cross-section beam
B. Asmara, M. Karimia,*, F. Nazaria and A. Bolandgeramib
a
Department of Mechanical Engineering, Faculty of Engineering, Bu-Ali Sina University, Hamedan, Iran.
b
Center of Excellence for Fundamental Studies in Structural Engineering, Iran University of Science and Technology, Narmak, Tehran, Iran
Article info: Abstract
Crack identification is a very important issue in mechanical systems, because it is a damage that if develops may cause catastrophic failure. In the first part of this research, modal analysis of a multi-cracked variable cross-section beam is done using finite element method. Then, the obtained results are validated usingthe results of experimental modal analysis tests. In the next part, a novel procedure is considered to identify the locations and depths of cracks in the multi-cracked variable cross-section beam using natural frequency variations of the beam based on artificial neural network and particle swarm optimization algorithm. In the proposed crack identification algorithm, four distinct neural networks are employed for the identification of locations and depths of both cracks. Back error propagation and particle swarm optimization algorithms are used to train the networks. Finally, the results of these two methods are evaluated.
Received: 21/02/2015 Accepted: 26/04/2015 Online: 11/09/2015
Keywords: Modal analysis, Multiple crack identification, Variable cross section beam,
Artificial neural network.
Nomenclature
a
Depth of crackd
Desired output of ANNe
Error function of ANNE
Elasticity modulusHeight of beam
Location
n Iteration of back-error propagation method
O
output of ANNu
Input of ANNbc
W
Weights between the hiddenand output layers of ANNab
W
Weights between the input andhidden layers of ANNy
Output of hidden layer of ANNGreek letters
Local gradient function of ANN Transfer function of ANN layers
Shear modulus
Mass density
Non-dimensional location of crack
Naturalfrequency hJCARME B. Asmar, et al. Vol. 5, No. 1, Aut.-Win. 2015-16
2
Subscript, Superscript
c
CrackUn-cracked beam
Abbreviations
ANN Artificial neural network
BEP Back-error propagation
FEM Finite element method MLFF Multi-layer feed forward
1. Introduction
In recent years, using non-destructive methods of study for cracked structures, researchers have paid great attention to vibration analysis methods. Many numerical, analytical, and experimental studies have been done in this field. Crack causes local flexibility in the structuresand influences the dynamic behavior. For example, it changes the mode shapes and reduces the natural frequencies. Analysis of these effects can be used for crack detection [1]. Dimarogonas [2] studied the methods of investigating cracked structures in 1996. Dimarogonas [3] and Paipetis and Dimarogonas [4] have modeled a crack using local flexibility and evaluated the equivalent stiffness utilizing fracture mechanics. Adams and Cawley [5] developed an experimental technique to estimate crack depth and location using natural frequencies. In another investigation, Chan and Dimarogonas [6] presented methods which related the crack depth to natural frequencies when the crack location was known. These methods could be used for detecting cracks in different structures. Goudmunson [7] presented a method for the prediction of changes of natural frequencies caused by faults such as cracks, notches, etc. Shen and Taylor [8] presented a method based on minimizing the difference between the measured data and data obtained from analytical study in order to identify cracks in an Euler-Bernoulli beam. Masoud et al. [9] studied vibrational characteristics of a fixed-fixed beam which contained a symmetric crack considering the coupling effect of crack depth and axial load. In the recent decade, some investigations have been done on the vibrational behavior of multi-cracked structures. Sekhar [10] summarized
different papers on multiple cracks, respective influences, and identification methods in some structures such as beams, pipes, rotors etc. Lee [11] used FEM to solve forward problem in a multi-cracked beam. In this paper, an inverse problem was solved iteratively for the locations and depths of the cracks using the Newton-Raphson method. Patil and Maiti [12] identified multiple cracks using frequency measurements. Their procedure presented an explicit linear relationship between the changes of natural frequencies and damage parameters. Mazanoglu et al. [13] performed the vibration analysis of multi-cracked variable cross-section beams using the Rayleigh–Ritz approximation method. Binici [14] presented a parametric study on the effect of cracks and axial force levels on the eigenfrequencies. A new method for natural frequency analysis of beams with an arbitrary number of cracks was developed by Khiem and Lien [15]. Cam et al. [16] studied the vibrations of cracked beam as a result of impact shocks to obtain information about location of cracks and depth of beams.
A new technique often used for the identification of damage in the recent two decades has been artificial neural network. Wu et al. [17] used multi-layer feed forward neural network to identify the fault location in a simple frame. Wang and He [18] developed a numerical simulation and the model experiment upon a hypothetical concrete arch dam for the crack identification based on the reduction of natural frequencies using a statistical neural network. In another study, Kao and Hung [19] presented a two-step method for detecting cracks using ANN. The first step was to identify damaged and undamaged system situations and the second step was damage detection in structures. In the second step, a trained ANN was applied to produce the free vibration response of the system. Afterwards, changes of amplitude and periods between the results were compared.
In this paper, the effects of crack parameters on natural frequencies of a cantilever non-uniform cross-section beam with multiple cracks are investigated using FEM. Afterwards, a procedure is presented for the crack identification in cantilever non-uniform
JCARME Experimental . . . Vol. 5, No. 1, Aut.Win. 2015-16
3 section beams. In this procedure, BEP
algorithm is applied for ANN training in order to detect cracks in the cantilever non-uniform cross-section beam.
2. Numerical modal analysis
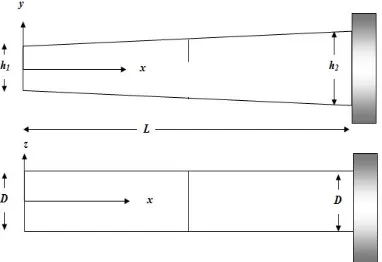
A schematic view of the cantilever non-uniform cross-section beams is shown in Fig. 1. Table 1demonstrates material and geometrical characteristic of the beam.
In the described model shown in Fig. 1 with the characteristics presented in Table 1, 2D FEM of the considered beam with and without crack is established using commercial package ANSYS [20] and based on the 8-node quadrilateral plane stress element (PLANE 183), which has two degrees of freedom at each node.Modeling the cracked beam using FEM commercial software (ANSYS) includes the following steps:
1- Selecting element type;
2- Specifying material parameters including Poisson's ratio, elasticity modulus, and density; 3- Creating 8 trapezoids (4 trapezoids for creating the 1st crack and 4 others for another one);
4- Boundary condition specifications (as this paper studied free vibration of a clamped–free beam for the specification of boundary condition, all degrees of freedom of the clamped end of the beam restricted are zero). 5- For the 1st crack modeling, 4 right side trapezoids are used as the top-right one glued to the bottom right one. Then, the bottom-right trapezoids are glued to the bottom-left one and the top-left one is glued to the bottom-left one. The common edges of top-right and top-left trapezoids are not glued to each other, which results in the crackcreation. The same procedure is performed for another crack modeling. The obtained result showed that this crack modeling method simulates the crack vibrational behaviors accurately.
6- Specification of mesh size; 7- Meshing the beam;
8- Selecting modal analysis item; 9- Solving; and
10- Reading the obtained results.
Three first natural frequencies of the structure in different conditions of crack in this study are obtained using modal analysis of ANYSY. Then, the calculated data are validated in comparison with the result of the experimental analysis, which is shown in Fig. 2 and Fig. 3.
Fig. 1. Geometry of the cracked non-uniform cross-section beam.
Table 1.Characteristics of the non-uniform cross-section beam.
20 Beam depth in clamped end (mm)
5 Beam depth in free end (mm)
7860 Density (kg/m3)
20 Beam width (mm)
0.3 Poisson ratio
600 Beam length (mm)
210 Elasticity modulus (GPa)
3. Experimental verification
In this study, for experimentally obtaining the considered beam natural frequencies, it is made according to the values in Table 2. The intact beam natural frequencies are compared with the result in [13] and the finite element results of this study are compared in the previous section of this article. The beam is shown in Fig. 2. In the experimental modal analysis, piezoelectric accelerometer is used and the hammer test is applied, as shown in Fig. 3. Experimental testing procedure in this paper includes the following steps:
1- Four numbers of beam, which are shown in Fig. 1 and Table 1,are made and cracks are created in different positions.
JCARME B. Asmar, et al. Vol. 5, No. 1, Aut.Win. 2015-16
4
3- One impact is imposed to intact and cracked beams with hammer and the response to the impact is measured by the sensors embedded in it.
4- According to the obtained peaks of amplitude-frequency data from the modal analysis, the natural frequencies of each beam are specified.
5- The specified natural frequencies from the experimental analysis are verified using FEM (ANSYS).
Fig. 2. Experimental modal analysis test-rig.
Fig. 3. Considered hammer and sensor inthe experiment.
The obtained natural frequencies are tabulated in Table 2. In this table, the experimental, finite element, and Ryle-Ritz [13] modal analyses are compared. Error is calculated based on the experimental analysis. As can be seen experimental error is higher for higher order natural frequencies.
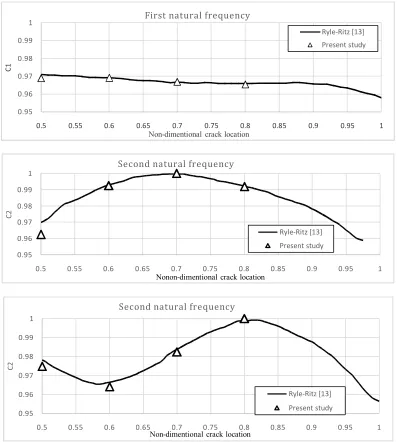
For the verification of results obtained from this paper, ratio of three first natural frequencies for one cracked condition to intact beam which is
obtained from Eq. (1) is calculated for ratio of crack depth to beam depth in clamped edge equal to 0.3, which is shown in Fig. 4. In this figure, non-dimensional natural frequencies obtained from FEM of this paper are compared with the data presented by Ryle-Ritz method [13]. As can be seen in Fig. 4, the calculated frequencies have good correspondence with the results in [13] and it is understood that accuracy and correction of calculation are high. In this figure, value of crack location is calculated in ratio of crack location to beam length.
cracked i i uncracked
i
f
C
f
(1)4. Crack identification using soft computing methods
4.1. Artificial neural network
The ANN used in this study is an MLFF neural network consisting of an input layer, some hidden layers, and an output layer. A scheme of the MLFF neural network is shown in Fig. 5. Knowledge in ANNs is usually stored as a set of connection weights. The modification process of the connection weights using a suitable learning method is called training.In this study, two distinct ANNs are employed for predicting crack locations and depths. These ANNs consist of one input layer with 3 neurons, one hidden layer with 6 neurons, and one output layer with one neuron. Transfer functions for the neurons of hidden and output layers are defined as Eq. (2), called Tansig function.
Table 2. Comparing experimental, finite element and Ryle-Ritz [13] modal analyses. FEM error
(%) FEM
(HZ) Ryle-Ritz [3]
Analysis error (%) Ryle-Ritz [3]
Experimental analysis (HZ) Ith Natural
frequency
2.39 55.29
2.41 55.3
54
1
f
5.35 213.9
5.13 214.4
226
2
f
8.10 510.94
7.46 514.5
556
3
f
2
( )
;
[1 exp( 2 )] 1
f n
n
JCARME Experimental . . . Vol. 5, No. 1, Aut.Win. 2015-16
5 Fig. 4. Comparing three first non-dimensional natural frequencies obtained in [13] and the present study.
Fig. 5. Schematic diagram of a typical MLFF neural-network architecture.
0.95 0.96 0.97 0.98 0.99 1
0.5 0.55 0.6 0.65 0.7 0.75 0.8 0.85 0.9 0.95 1
C
1
Non-dimentional crack location
First natural frequency
Ryle-Ritz [13] Present study
0.95 0.96 0.97 0.98 0.99 1
0.5 0.55 0.6 0.65 0.7 0.75 0.8 0.85 0.9 0.95 1
C
2
Nonon-dimentional crack location Second natural frequency
Ryle-Ritz [13]
Present study
0.95 0.96 0.97 0.98 0.99 1
0.5 0.55 0.6 0.65 0.7 0.75 0.8 0.85 0.9 0.95 1
C
2
Non-dimentional crack location Second natural frequency
Ryle-Ritz [13]
JCARME B. Asmar, et al. Vol. 5, No. 1, Aut.Win. 2015 -16
6
4.2. Back-error propagation algorithm
BEP is the most widely used learning algorithm of MLFF neural networks. This learning method was proposed by McClellandand Rumelhart [21] in a ground-breaking study, whichwas originally focused on cognitive computer sciences.
In this work, the structure of the ANN includes three layers: input, hidden, and output.
Values of wab represent the weights between the input and hidden layers. Values of wbc represent the weights between the hidden and output layers. The operation of BEP consists of three stages:
a. Feed-forward stage:
( ). ( );
bc
v w n y n (3)
2
( )
( ( )))
;
1 exp[
(2 )]
o n
v n
v
n
(4)where
o
is output,u
is input,y
is output of hidden layer, and is activation function.b. Back-propagation stage: ( ) = ( ). [ ( )] =
[ ( ) − ( )]. [ ( )]. [1 −o(n)]; (5) where represents the local gradient function,
e
shows error function,o
and d mean the actual and desired outputs, respectively.c. Adjust weighted value:
( + 1) = ( ) + ∆ ( ) =
( ) + ( ). ( ); (6)
where is learning rate. Repeating these three stages leads to a value of the error function that will be zero or constant.
4. 3. Particle swarm optimization algorithm
PSO is a population-based stochastic optimization technique which was developed by Eberhart and Kennedy [22] and inspired by the
social behavior of bird flocking or fish schooling. This algorithm has many similarities with evolutionary computation techniques such as GA. The optimization procedure starts with a population of random solutions and searches for optima by updating generations. Unlike GA, PSO has no evolution operators such as mutation and crossover. In PSO, potential solutions that are named particles fly through the space of problem by following the current optimum particles. Each particle keeps the track of its coordinates in the space of problem which are associated with the best solution (best fitness) it has achieved up to now, called "pbest". Another "best" value that is tracked using PSO is the best value, achieved so far by any particle in the neighbors of the particle, and is called "lbest". When a particle takes all the population as its topological neighbors, a global best, named "gbest", is the best value. The PSO concept in each time step consists of changing the velocity of each particle toward its"pbest" and "lbest" locations. Acceleration is weighted using a random term, by separate random numbers being generated for acceleration toward "lbest" and "pbest" locations.
4. 4. Crack detection procedure
For crackdetection, first of all, MLFF ANNs with 3, 6, and 1 neuron in input, hidden, and output layers are created. The first three natural frequencies of the non-uniform cross-section beam in 22 different crack conditions are applied to ANNs as the input and the corresponding locations and depths are applied as targets to the first and second networks, respectively. The data that are applied to ANNs are obtained using FEM on the non-uniform cross-section beam that is modelled by 20 different layers. Training the ANNs is doneusing two different algorithms of BEP and PSO in MATLAB [23]. BEP algorithm is used with 1000 iterations. In ANN training using BEP method, 70%, 20%, and 10% of data are used for training, verifying, and testing the network. BEP training procedure for the prediction of location and depth of cracks using MATLAB [23] is plotted in Figs. 6(a) and 6(b), respectively. In the training process using PSO
JCARME Experimental . . . Vol. 5, No. 1, Aut.Win. 2015-16
7 algorithm, weights of ANNs are considered
optimization variables and the sum of square of differences between output and target values of ANNs is assumed as cost functions. The considered PSO algorithm has the population size of 100, 1000 iterations, and 31 optimization variables.
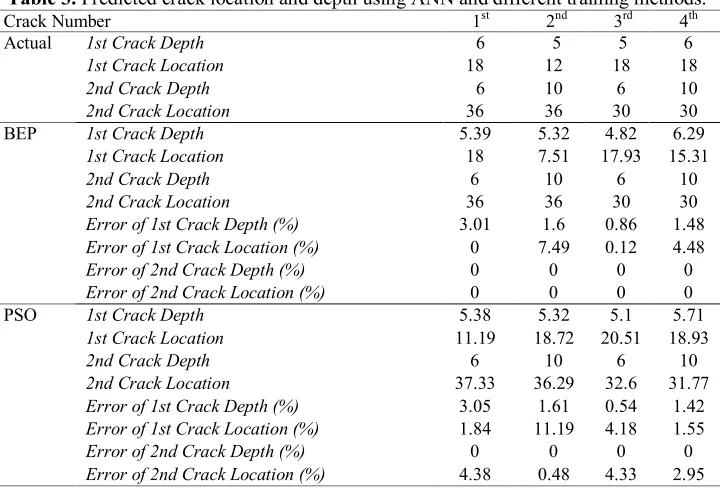
The trained ANNs are tested for 4 different conditions of cracks, as tabulated in Table 3. Training procedure of ANNs using PSO algorithm for the prediction of location and depth of cracks are illustrated in Figs. 7(a) and 7(b), respectively.
Training curves of Fig. 6 show the process for training ANN for 4 mentioneddifferent conditions. As can be seen in Fig. 6 (a), mean squared error is diminished from 10 -12 to 10 -26; therefore, ANN is trained well. It can be seen that the value of validation error in 1000 iteration is constantly 10 -15 that is very acceptable for the training procedure.
With respect to negligible error in all diagrams, it can be concluded that the training procedure of each for ANN is done with high accuracy.
1E-26 1E-24 1E-22 1E-20 1E-18 1E-16 1E-14 1E-12
0 200 400 600 800 1000
M
ea
n
S
q
u
ar
e
d
E
rr
or
(
m
se
)
Epochs
(a) Best validation performance is 3.7394e-16 at epoch 14
Train Validation Test Best
0.0001 0.001 0.01 0.1
0 100 200 300 400 500 600 700 800 900 1000
M
ea
n
S
q
u
ar
e
d
E
rr
or
(
m
se
)
Epochs
(b) Best validation performance is 0.00016661
JCARME B. Asmar, et al. Vol. 5, No. 1, Aut.Win. 2015-16
8
Fig. 6. BEP training procedures of ANNs for identifying the a) 1st and b) 2nd crack location as well as c) 1stand d) 2nd crack depth.
Table 3. Predicted crack location and depth using ANN and different training methods. 1E-26
1E-21 1E-16 1E-11 1E-06 0.1
0 200 400 600 800 1000
M
ean
S
q
u
ar
ed
E
rr
o
r
(m
se
)
Epochs
(c) Best validation performance is 3.7698e-26
Train & Validation Test
Best
0.001 0.01 0.1
0 200 400 600 800 1000
M
e
an
S
q
u
ar
ed
E
rr
o
r
(m
se
)
Epochs
(d) Best validation performance is 0.0052195 at epoch 3
Train Validation Test Best
Crack Number 1st 2nd 3rd 4th
Actual 1st Crack Depth 6 5 5 6
1st Crack Location 18 12 18 18
2nd Crack Depth 6 10 6 10
2nd Crack Location 36 36 30 30
BEP 1st Crack Depth 5.39 5.32 4.82 6.29 1st Crack Location 18 7.51 17.93 15.31
2nd Crack Depth 6 10 6 10
2nd Crack Location 36 36 30 30
Error of 1st Crack Depth (%) 3.01 1.6 0.86 1.48 Error of 1st Crack Location (%) 0 7.49 0.12 4.48 Error of 2nd Crack Depth (%) 0 0 0 0 Error of 2nd Crack Location (%) 0 0 0 0
PSO 1st Crack Depth 5.38 5.32 5.1 5.71
1st Crack Location 11.19 18.72 20.51 18.93
2nd Crack Depth 6 10 6 10
JCARME Experimental . . . Vol. 5, No. 1, Aut.-Win. 2015-16
9
(a) (b)
(c) (d)
Fig. 7. PSO based ANNs training for identification of a) 1st b) 2nd crack location and c) 1st d) 2nd crack depth a) location and b) depth.
Curves in Fig. 7 show the training process of PSO for 4 mentioned different conditions. As can be observed in all the 4 conditions, value of optimization process cost functions is diminished during 1000 iteration. For example, in Fig.7 (a) which is related to the identification of the first crack location, value of cost function is diminished by 27 times during 1000 iteration and it is depleted from 0.53 to 0.29. PSO algorithm closes the target and real output of ANN by decreasing cost function; therefore, it produces the needed weights for use in next steps. As can be observed from other diagrams in Fig.7,the training procedure of ANN is done with high accuracy and error is absolutely acceptable.
As can be found in this table, the average errors in the prediction of crack locations for the BEP
JCARME B. Asmar, et al. Vol. 5, No. 1, Aut.-Win. 2015-16
10
5. Conclusions
In the first part of this study, modal analysis of a multi-cracked variable cross-section beam was done using finite element method and the results were verified using the experimental modal analysis tests. Then, for the identification of the locations and depths of cracks in the multi-cracked variable cross-section beam using artificial neural network and particle swarm optimization algorithm, a procedure was proposed. Four distinct neural networks were also employed for the identification of locations and depths of both cracks. BEP and PSO were used to train the networks and make the comparisons.
In sum, it is concluded that the proposed method in the present study for crack detection of multi-cracked non-uniform cross-section beam will result in accurate prediction results. Also, the cracked beam modeling approach helps obtain natural frequencies for different conditions of cracks with good accuracy.
References
[1] E. Douka, S. Loutridis and A. Trochidis, “Crack identification in beams using wavelet analysis”, International Journal of Solids and Structures, Vol. 40, No. 13-14, pp. 3557-3569, (2003).
[2] D. Dimarogonas and Andrew, “Vibration of cracked structures: a state of the art review”, International Journal of Engineering Fracture Mechanics, Vol. 55, No. 5, pp. 831-857, (1996).
[3] A. D. Dimarogonas, Vibration Engineering, West Publishers, St Paul, Minnesota, (1976).
[4] S. A. Paipetis and A. D. Dimarogonas,
Analytical methods in rotor dynamics, Elsevier Applied Science, London, (1986).
[5] P. Cawley and R. D. Adams, “The location of defects in structures from measurements of natural frequencies”
International Journal of Strain Analysis for Engineering Design, Vol. 14, No. 2, pp. 49-57, (1979).
[6] T. G. Chondros, A. D. Dimarogonas, “Identification of cracks in welded joints of complex structures”, International Journal of Sound and Vibration, Vol. 69, No. 4, pp. 531-538, (1980).
[7] P. Goudmunson, “Eigenfrequency change of structures: a state of the art review”, International Journal of Engineering and Fracture Mechanic, Vol. 55, No. 5, pp. 831-857, (1982). [8] M. H. H. Shen and J. E. An. Taylor,
“identification problem for vibrating cracked beams”, International Journal of Sound and Vibration, Vol. 150, No. 3, pp. 457-484, (1991).
[9] S. Masoud, M. A. Jarrah and M. Al-Maamory, “Effect of crack depth on the natural frequency of a prestressed fixed-fixed beam”, International Journal of Sound and Vibration, Vol. 214, No. 2, pp. 201-212, (1998).
[10] A. S. Sekhar, “Multiple cracks effects and identification”, International Journal of Mechanical Systems and Signal Processing, Vol. 22, No. 4, pp. 845-878, (2008).
[11] Jinhee Lee, “Identification of multiple cracks in a beam using natural frequencies”, International Journal of Sound and Vibration, Vol. 320, No. 3, pp. 482-490, (2009).
[12] D. P. Patil and S. K. Maiti, “Detection of multiple cracks using frequency measurements”, International Journal of Engineering Fracture Mechanics, Vol. 70, No. 12, pp. 1553-1572, (2003). [13] K. Mazanoglu, I. Yesilyurt and M.
Sabuncu, “Vibration analysis of multiple-cracked non-uniform beams”,
International Journal of Sound and Vibration, Vol. 320, No. 4-5, pp. 977-989, (2009).
[14] B. Binici, “Vibration of beams with multiple open cracks subjected to axial force”, International Journal of Sound and Vibration, Vol. 287, No. 1-2, pp. 277-295, (2005).
JCARME Experimental . . . Vol. 5, No. 1, Aut.-Win. 2015-16
11
Journal of Sound and Vibration, Vol. 245, No. 4, pp.737-751, (2001).
[16] E. Cam, O. Sadettin and L. Murat, “An analysis of cracked beam structure using impact echo method”, International Journal of NDT& E International, Vol. 38, No. 5, pp. 368-373, (2008).
[17] X. Wu, J. Ghaboussi and J. Hr. Garrett, “Use of neural networks in detection of structural damage”, International Journal of Computers & structures, Vol. 42, No. 4, pp. 649-659, (1992).
[18] B. S. Wang and Z. C. He, “Crack detection of arch dam using statistical neural network based on the reductions of natural frequencies”, International Journal of Sound and Vibration, Vol. 302, No. 4, pp. 1037-1047, (2007). [19] C. Y. Kao and Shih-Lin Hung,
“Detection of structural damage via free
vibration responses generated by approximating artificial neural networks”, International Journal of Computers & Structures, Vol. 81, No. 28, pp. 2631-2644, (2003).
[20] ANSYS Release 8.0. ANSYS, Inc. Southpointe 275 Technology Drive Canonsburg, PA 15317.
[21] McClelland, L. James, E. David Rumelhart, and PDP Research Group, “Parallel distributed processing”,
Explorations in the microstructure of cognition, Vol. 2, pp. 216-271, (1986). [22] Kennedy, James “Particle swarm
optimization”, Encyclopedia of Machine Learning, Springer US, pp. 760-766, (2010).
![Table 2. Comparing experimental, finite element and Ryle-Ritz [13] modal analyses.](https://thumb-us.123doks.com/thumbv2/123dok_us/9968417.1985161/4.595.89.481.636.712/table-comparing-experimental-finite-element-ryle-ritz-analyses.webp)