An excited state underlies gene regulation of a transcriptional
riboswitch
Bo Zhao1,2, Sharon L. Guffy1, Benfeard Williams1, and Qi Zhang1,*
1Department of Biochemistry and Biophysics, University of North Carolina at Chapel Hill, Chapel
Hill, North Carolina, USA
2Department of Chemistry, University of North Carolina at Chapel Hill, Chapel Hill, North
Carolina, USA
Abstract
Riboswitches control gene expression through ligand-dependent structural rearrangements of the sensing aptamer domain. However, we found that the Bacillus cereus fluoride riboswitch aptamer adopts identical tertiary structures in solution with and without ligand. Using chemical exchange saturation transfer (CEST) NMR spectroscopy, we revealed that the structured ligand-free aptamer transiently accesses a low-populated (~1%) and short-lived (~3 ms) excited conformational state that unravels a conserved ‘linchpin’ base pair to signal transcription termination. Upon fluoride binding, this highly localized fleeting process is allosterically suppressed to activate transcription. We demonstrated that this mechanism confers effective fluoride-dependent gene activation over a wide range of transcription rates, which is essential for robust toxicity response across diverse cellular conditions. These results unveil a novel switching mechanism that employs ligand-dependent suppression of an aptamer excited state to coordinate regulatory conformational transitions rather than adopting distinct aptamer ground-state tertiary architectures, exemplifying a new mode of ligand-dependent RNA regulation.
INTRODUCTION
Riboswitches are a class of non-coding RNAs located at the 5′ untranslated region of mRNAs that regulate gene expression by controlling transcription termination, translation initiation, or RNA cleavage in response to specific cellular cues1–3. Functional studies have established a general mechanistic view of riboswitch regulation, where structural changes in the metabolite-sensing (aptamer) domain upon ligand binding are transduced to
conformational rearrangements of the downstream expression platform to tune gene expression4. Over the past decade, tremendous progress in determining high-resolution
Users may view, print, copy, and download text and data-mine the content in such documents, for the purposes of academic research, subject always to the full Conditions of use: http://www.nature.com/authors/editorial_policies/license.html#terms
*Correspondence should be addressed to Q.Z. ([email protected]).
Author contributions
B.Z. and Q.Z. conceived the project and experimental design. B.Z. and Q.Z. prepared the samples, carried out NMR and biochemical experiments, analyzed the data, and wrote the paper. S.L.G., B.W. and Q.Z. analyzed NMR RDC data.
HHS Public Access
Author manuscript
Nat Chem Biol
. Author manuscript; available in PMC 2018 January 17.Published in final edited form as:
Nat Chem Biol. 2017 September ; 13(9): 968–974. doi:10.1038/nchembio.2427.
A
uthor Man
uscr
ipt
A
uthor Man
uscr
ipt
A
uthor Man
uscr
ipt
A
uthor Man
uscr
ligand-bound (holo) aptamer structures of almost all known riboswitches has provided substantial insights into the molecular basis of specific ligand recognition4,5. Solution studies at molecular and single-nucleotide resolutions have indicated that the ligand-free (apo) aptamer is flexible and exists as an ensemble with distinct global conformations that undergoes induced structural changes and converges to a single structured ligand-bound state6–17. However, the vast majority of crystal structures of apo riboswitch aptamers are highly similar to their holo counterparts16–22, making it difficult to directly examine the structural basis for switching mechanisms that underlie gene regulation by riboswitches.
Here, we set out to study the regulatory mechanism of the transcriptional Bacillus cereus fluoride riboswitch23 (Fig. 1a) using solution-state NMR, chemical exchange saturation transfer (CEST) spectroscopy, and single-round transcription assays. Fluoride riboswitches are a class of riboswitches present in many bacteria and archaea23. Upon specific fluoride recognition, these riboswitches activate the expression of genes involved in fluoride toxicity response, such as fluoride exporters23,24. We determined the solution structure of the apo B. cereus fluoride riboswitch aptamer by NMR, which represents, to our knowledge, the first high-resolution solution structure of an apo riboswitch aptamer. Surprisingly, the ligand-free aptamer did not adopt an ensemble with distinct global conformations, but instead folded into a single stable conformation that is highly similar to the crystal structure of the fluoride-bound, transcriptionally active Thermotoga petrophila fluoride riboswitch aptamer25. By applying CEST NMR spectroscopy, we uncovered a ‘hidden’ difference in conformational dynamics between the apo and holo aptamers, which evaded detection by conventional techniques. In the absence of fluoride, the aptamer accesses an exceptionally low-populated (~1%) and short-lived (lifetime ~3 ms) conformational state referred to as an excited state (ES). We showed that these fleeting dynamics occur locally and unravel the critical ‘linchpin’ reverse Hoogsteen base pair at the interface between the structured aptamer and the downstream expression platform. This process exposes the aptamer for strand invasion, which in turn signals transcription termination. Fluoride binding at a site distal from the ‘linchpin’ allosterically suppresses dynamic transitions to the ES and activates transcription. We demonstrated that this ES-mediated switching mechanism enables the riboswitch to achieve fluoride-specific gene activation within a narrow range of ligand concentrations over a wider range of transcription rates, thus ensuring robust fluoride toxicity response for survival across diverse cellular environments.
RESULTS
Solution structure of apo fluoride riboswitch aptamer
Specific fluoride recognition by the B. cereus fluoride riboswitch aptamer requires Mg2+, which is consistent with a previous study on the T. petrophila fluoride riboswitch aptamer25. In the absence of Mg2+, the 47-nucleotide aptamer domain adapted from the B. cereus fluoride riboswitch only forms stable P1 and P2 stems and does not bind fluoride (Supplementary Results, Supplementary Fig. 1). In the presence of Mg2+, the unfolded aptamer undergoes a major structural transition, with an apparent single-magnesium Kd,Mg of 405 ± 46 μM obtained from NMR titration, to a fluoride-binding competent conformation (Supplementary Fig. 1). The resultant apo aptamer recognizes fluoride with an apparent
A
uthor Man
uscr
ipt
A
uthor Man
uscr
ipt
A
uthor Man
uscr
ipt
A
uthor Man
uscr
single-fluoride Kd,F of 100 ± 20 μM (Supplementary Fig. 1), similar to Kd,F of 60 – 135 μM reported for the Pseudomonas syringae and T. petrophila fluoride riboswitch aptamers23,25.
We determined the solution structure of the apo B. cereus aptamer domain using a comprehensive set of NMR restraints measured in the presence of 2 mM Mg2+, which include NOE distances, dihedral angles, and residual dipolar couplings (RDCs) (Supplementary Table 1). The ensemble of the 20 lowest-energy structures is well determined with a root-mean-square deviation to the mean of 0.67 ± 0.22 Å for all heavy atoms (Fig. 1b). Strikingly, this apo solution structure preserved all key tertiary interactions (Fig. 1c–f) observed in the highly similar crystal structure of the holo T. petrophila fluoride riboswitch aptamer25 (Fig. 2a), including reverse Watson-Crick (WC) A5•U35 pair and reverse Hoogsteen (HG) A37•U45 pair (Fig. 1d,e). Further measurements confirmed that three rare long-range hydrogen bonds formed between highly conserved residues: A37-2′OH to G7-N7, U38-2′OH to A40-N7, and U38-H3 to C41-O2P (Fig. 1e,f and Supplementary Fig. 1). In addition, the fluoride-binding pocket, which is formed by phosphates from five cross-strand residues, only differs subtly between the apo and holo states and features an open entrance for fluoride (Fig. 2b,c).
The apo state is essential for transcription activation
To assess whether the apo and holo states differ in their conformational dynamics, we measured NMR 13C spin relaxation rates, which report conformational flexibility at the pico-to-nanosecond timescale, and RDCs, which provide long-range angular information on structures and also report conformational flexibility up to the micro-to-millisecond
timescale26 (Supplementary Fig. 2). Remarkably, both relaxation rates and RDCs exhibited a high degree of correlation between the two states (R2 = 0.94 and 0.99, respectively) (Fig. 2d,e), suggesting that the B. cereus aptamer domain not only adopts identical structures in solution but also undergoes highly similar dynamics across a wide range of timescales with or without fluoride.
Given these structural and dynamic similarities, we examined whether the apo and holo states do give rise to distinct functional outcomes as reported previously23. Indeed, single-round transcription assays confirmed fluoride-dependent transcription activation of the B. cereus riboswitch, which has an EC50 – the effective fluoride concentration to cause a 50% change in transcription − of 515 ± 78 μM (Fig. 2f and Supplementary Fig. 3). The observed difference between the EC50 and Kd (100 ± 20 μM) indicates that transcriptional regulation of the B. cereus fluoride riboswitch is likely governed by the kinetic, rather than
thermodynamic, properties of fluoride binding. Since the regulatory process is cotranscriptional, the RNA polymerase can reach the decision point for transcription termination at the poly-U stretch before ligand binding achieves thermodynamic
equilibrium27. Thus, a ligand concentration (EC50) higher than the Kd is often required to ensure a sufficient ligand on-rate within the limited time window27. Therefore, the folded apo state with a preformed fluoride-binding pocket may be essential to meet this kinetic requirement for efficient transcription activation.
To examine this hypothesis, we perturbed a water-mediated hydrogen bond between U6-O4 to an Mg2+ distal from the ligand-binding pocket25 by mutating U6 to C. This
single-A
uthor Man
uscr
ipt
A
uthor Man
uscr
ipt
A
uthor Man
uscr
ipt
A
uthor Man
uscr
nucleotide mutation (U6C) destabilized the structured Mg2+-bound apo aptamer but did not substantially affect the holo conformation (Supplementary Fig. 4). Despite having an apparent fluoride off-rate constant (koff,U6C = 0.21 ± 0.01 s−1) similar to the wild-type (WT) (koff = 0.41 ± 0.02 s−1) (Supplementary Fig. 5), the U6C mutant exhibited a much slower ligand on-rate constant, manifested as a 13-fold decrease in fluoride binding affinity
(Kd,F,U6C = 1.29 ± 0.18 mM) (Supplementary Fig. 4). The slower ligand binding kinetics led to an EC50 (88 ± 5 mM) 170-fold higher than the WT (Fig. 2f), well beyond the ~1 mM minimum inhibitory concentration (MIC)23, further highlighting the importance of ligand-binding kinetics in the regulation of fluoride riboswitch. Together, these results illuminated the functional role of the holo-like apo state, which effectively lowers the kinetic barrier for ligand binding and enables efficient fluoride sensing to activate transcription below or near the toxicity threshold. However, the mechanism by which this holo-like apo state achieves the transcription-OFF state remains hidden.
A fleeting process differentiates apo and holo states
Recent developments in NMR R1ρ relaxation dispersion28–30 and CEST spectroscopy31–33 have made it possible to study RNA excited conformational states (ESs) that are too low-populated and short-lived to be detected by conventional techniques. By applying 13C CEST spectroscopy33 on individually G and A/U 13C/15N labeled aptamers, we uncovered distinct propensities of the apo and holo states to access ESs. For the holo aptamer, base (C2/C6/C8) and sugar (C1′) CEST profiles uniformly displayed single intensity dips, suggesting one stable conformation (Fig. 3a and Supplementary Fig. 6). In contrast, a subset of apo CEST profiles exhibited second and asymmetrically broadened intensity dips, indicating the presence of conformational exchange to ESs in the apo aptamer (Fig. 3b and Supplementary Fig. 7). With the exception of A17, which is singly stacked on P1 and may undergo local dynamics, residues that undergo chemical exchange are spatially clustered around the junction of P3, J13, J23, and 3′-tail, suggesting a concerted transition (Fig. 3b). Indeed, these CEST data can be globally fitted to a single two-state (GS ⇔ ES) exchange (where GS refers to the ground state) that is directed towards an ES with population (pES) of 1.4 ± 0.1% and lifetime (τES = 1/kEG) of 3.2 ± 0.3 ms (Fig. 3c).
The excited state unlocks the conserved linchpin
To gain structural insights into the apo ES, we examined ES base and sugar carbon chemical shifts extracted from CEST profiles, which are sensitive probes to local chemical
environments. Except for the ES chemical shift of P3 A42, which remains close to those of helical residues, all ES chemical shifts were substantially shifted toward those of single nucleotides (Supplementary Fig. 7). Together with the lack of exchange observed in helical residues, these ES chemical shift fingerprints indicate that the apo ES possesses well-folded P1, P2, and P3 stems, but the network of tertiary interactions formed by J13, J23, and 3′-tail is missing. In particular, the P3-capping reverse HG A37•U45 pair may be disrupted in the apo ES, as suggested by downfield-shifted ES base chemical shift of P3 terminal residue G7 (136.2 ppm) towards that of uncapped P1 terminal residue G1 (136.9 ppm). Thus, the apo ES adopts a pseudoknot-like structure distinct from the apo GS and the unfolded aptamer.
A
uthor Man
uscr
ipt
A
uthor Man
uscr
ipt
A
uthor Man
uscr
ipt
A
uthor Man
uscr
To test key features of the proposed apo ES structure—the absence of A37•U45 pair and the presence of P3—we designed site-specific mutations (Fig. 3d and Supplementary Fig. 8). Remarkably, both A37•U45 deletion mutations—A37C and 3′ tail deletion (Δ3)—
deleteriously impact Mg2+ and F− binding and result in largely unstructured aptamers in the presence of ligands (Supplementary Fig. 8a). These results not only unveiled an unexpected role of the A37•U45 pair as the ‘linchpin’ for aptamer folding, explaining their conservation across all fluoride riboswitches23, but also emphasized the importance of evaluating the behaviour of A37•U45 in the ES. However, the substantially broadened NMR signals observed upon Mg2+ addition (Supplementary Fig. 8a) made it infeasible to directly compare these mutants to the WT for examining the ES structure. Alternatively, CEST profiles of a partially Mg2+-bound WT aptamer showed that the apo ES is a state shared between the Mg2+-bound apo GS and the Mg2+-free unfolded aptamer (Supplementary Fig. 8b). Given the WT aptamer samples the apo ES in the absence of Mg2+ (Supplementary Fig. 8c), we examined whether the Mg2+-free A37•U45-deletion mutants also populate the same apo ES. Indeed, CEST profiles showed good agreement among all three G7 ES chemical shifts, supporting the absence of A37•U45 pair in the ES (Fig. 3d and Supplementary Fig. 8c). Similarly, we confirmed the presence of P3 in the ES, where the A42C43C44 to C42A43A44 (CAA) mutation, which disrupts P3, abolishes ES sampling (Fig. 3d and Supplementary Fig. 8c). It is remarkable that, despite being distant from the binding pocket, fluoride binding is able to allosterically suppress the linchpin-unlocked ES without affecting the ground state conformation.
The excited state signals transcription termination
Relative to otherwise-indistinguishable apo and holo states, the apo ES may represent the pivot state needed to achieve transcription termination in the absence of ligand. Since the regulatory process is cotranscriptional, the communication between the aptamer and terminator residues occurs when A64 exits the RNA polymerase and competes with the aptamer for the ‘linchpin’ residue U45 (Fig. 4a). At this point, due to the encapsulated ~12-nt RNA footpri~12-nt of the polymerase11,34,35, transcription will have also reached the poly-U stretch (U71 – 78). Hence, the pairing of A64•U45 not only represents the first step of aptamer–terminator communication, but also marks the decision point for transcription termination. To evaluate the thermodynamic signatures of transcription intermediates around this pivot point, we carried out pseudo-cotranscriptional RNA folding measurements by NMR (Supplementary Fig. 9). In the absence of A64, the apo aptamer remains well folded in the holo-like apo GS to ensure efficient fluoride sensing. Remarkably, when the transcript ‘reaches’ A64, the folded apo aptamer, in contrast to the holo aptamer, becomes
substantially destabilized, where the A64•U45 pairing thermodynamically outcompetes the A37•U45 ‘linchpin’ and leads to a largely unfolded P3 stem. This could in turn favor the strand invasion process towards terminator formation, thus suggesting a role of the linchpin-unlocked apo ES in termination. Surprisingly, when the complete terminator sequence is present, the terminator stem outcompetes both the structured apo and holo aptamers, demonstrating that the transcription-OFF conformation of the riboswitch is the most thermodynamically stable state, even in the presence of ligand. Together, these results not only indicate that the termination process is governed by the kinetic, rather than
A
uthor Man
uscr
ipt
A
uthor Man
uscr
ipt
A
uthor Man
uscr
ipt
A
uthor Man
uscr
thermodynamic, properties of terminator formation, they also suggest that the A64•U45 interaction may play a pivotal role in this regulatory process.
Hence, by unlocking U45 from the ‘linchpin’, the apo ES could provide a kinetically favorable pathway to facilitate A64•U45 pairing and achieve efficient terminator formation. Therefore, if the apo ES activates transcription termination, perturbing the GS–ES dynamic will alter the transcriptional outcome. Since Mg2+ stabilizes the apo GS, we expect that increasing Mg2+ concentration, which disfavors apo ES formation, will reduce termination efficiency and enhance transcription activation. To examine this hypothesis in a
transcriptional context, we carried out Mg2+-dependent single-round transcription assays in the absence of fluoride. Indeed, a dramatic increase was observed in read-through from 7% at 3 mM Mg2+ to 43% at 30 mM Mg2+ over baseline reduction in termination efficiency with apparent read-through only increased from 5% to 21% (Fig. 4b). This result not only strongly supports the proposed functional role of the apo ES in transcription termination but also indicates that, like the holo state, the structurally equivalent apo GS can activate transcription.
The fluoride riboswitch delivers robust gene regulation
Taken together, these results reveal a novel switching mechanism where, without adopting distinct, ligand-dependent ground-state tertiary architectures of the ligand-sensing domain, dynamic transition to an excited state of the aptamer signals transcription termination whereas allosteric suppression of this fleeting state upon ligand binding activates continued transcription. To provide a rigorous description of this mechanism, we integrated the sensing, communication, and termination processes into a unified model that depicts the most likely pathway for function (Fig. 5a and Supplementary Fig. 10). The underlying kinetic scheme was completed by combining the NMR-derived aptamer folding rate constants and the apparent rate constants of terminator formation that were extracted from single-round fluoride-free transcription assays at different NTP concentrations36 (Online
Methods and Supplementary Fig. 11). It is worth noting that characterizing the terminator
folding rates in a transcriptional context is necessary for developing a kinetic scheme that properly represents the regulatory process37,38. Given that fluoride is toxic to cells, the riboswitch must be able to activate gene expression, regardless of cellular conditions, before fluoride levels substantially exceed the toxicity threshold (MIC ~ 1 mM)23. Cellular conditions can greatly impact the overall speed of RNA transcription36,39, a major factor for transcriptional riboswitch regulation27. Therefore, we employed kinetic simulations to examine functional outcomes at different effective transcription rates, defined as the combined time needed for transcribing from the aptamer to the expression platform and pausing at the poly-U stretch36,39.
Remarkably, over a wide range of effective transcription rates, the riboswitch was predicted to maintain not only tight fluoride response (EC50 ~ 174 μM – 3.1 mM) but also effective switching efficiency (64 – 93%) – defined as the dynamic range of ligand-dependent transcription activation (Fig. 5b and Supplementary Fig. 12a). We further examined this predicted response using single-round transcription assays at different NTP concentrations, and the experimentally determined EC50 (129 ± 9 μM – 2.7 ± 0.3 mM) and switching
A
uthor Man
uscr
ipt
A
uthor Man
uscr
ipt
A
uthor Man
uscr
ipt
A
uthor Man
uscr
efficiency (71 – 93%) values agree very well with the simulated results (Fig. 5c). This robust switching is achieved by the rapid GS–ES interconversion. Slowing the GS–ES rate (kGE) from 4.5 to 0.45 s−1 predicted an unbalanced switch: while the fluoride response remains tight (EC50 ~ 209 μM – 2.2 mM), the switching efficiency becomes more dependent on transcription rates with a range from 36% to 93% (Supplementary Fig. 12b). In contrast to the WT aptamer, the U6C mutant, which employs the conventional switching mechanism of distinct apo and holo aptamer structures, lacks robustness in regulation: although excellent switching efficiency was obtained in both simulation (86 – 96%) and functional assays (84 – 96%), the fluoride response (EC50 ~ 7 – 490 mM and ~ 24 ± 2 – 329 ± 67 mM for
simulation and assays, respectively) was deficient relative to physiological fluoride toxicity levels (Fig. 5d,e). These results highlight the importance of the ES-mediated switching mechanism for the function of the fluoride riboswitch in toxicity response23.
DISCUSSION
Here, by integrating structural, dynamic, kinetic and functional analyses of the B. cereus fluoride riboswitch, we identified a novel switching mechanism for riboswitch function, which is distinct from the current paradigm involving the aptamer domain adopting different tertiary and even secondary structures in the presence and absence of ligand4. We found that the fluoride riboswitch aptamer folds into essentially identical tertiary structures with and without ligand. This holo-like apo conformation allows fluoride sensing in a direct and efficient manner, and is critical for the riboswitch to effectively activate the toxicity response given the marginal gap between its fluoride binding affinity (Kd ~ 0.1 mM) and the threshold of toxic fluoride levels (MIC ~ 1 mM)23. However, a potential disadvantage of employing structurally indistinguishable states is that the ligand-free aptamer is functionally competent in triggering gene activation. Yet, the fluoride riboswitch only activates transcription upon specific fluoride recognition and effectively limits unintended gene expression when fluoride is absent.
We showed that this ligand-specific gene activation is achieved by controlling highly localized fleeting dynamics. The apo aptamer transiently accesses an excited state; in contrast, the holo aptamer turns off these conformational transitions. Despite being sparsely populated and short-lived, this excited state defines the functional difference between the apo and holo states. Rapid transition to the excited state, which unlocks the highly conserved linchpin base pair located at the interface between the aptamer domain and the expression platform, opens the gate for strand invasion and provides a path to transcription termination. In contrast, fluoride binding allosterically suppresses ES access and ensures continued gene transcription. Recently, transcription regulation by the B. cereus fluoride riboswitch was also characterized using a chemical probing approach based on selective 2′-hydroxyl acylation analyzed by primer extension sequencing (SHAPE-seq)40. This elegant cotranscriptional SHAPE-seq technique provides a powerful approach for studying transcriptional processes at nucleotide resolution, and enabled detection of a series of folding intermediates along the transcription coordinate of the fluoride riboswitch. However, due to limited spatial and temporal resolution, the fleeting conformational transition uncovered here evaded detection by the SHAPE-seq experiment, and subsequently, the regulatory role of the conserved reverse Hoogsteen A37•U45 base pair remained hidden. This resulted in an apparent
A
uthor Man
uscr
ipt
A
uthor Man
uscr
ipt
A
uthor Man
uscr
ipt
A
uthor Man
uscr
pathway that adopts the conventional view of riboswitch mechanism composed of different apo and holo aptamer structures. Hence, the case of fluoride riboswitch highlights the necessity of high-resolution tertiary structural and dynamic measurements in solution for illuminating the underlying regulatory mechanism of riboswitch function.
By completing a kinetic scheme of our ES-mediated switching mechanism, we were able to reveal an unexpected capability of this transcriptional riboswitch. Numerical simulations of this scheme, corroborated by functional assays, showed that the riboswitch is capable of achieving both tight fluoride response and effective switching efficiency over a wide range of effective RNA transcription rates. This robust switching behavior is a likely prerequisite for functional response to fluoride toxicity in diverse cellular environments. We speculate this mechanism may underlie regulatory functions of other riboswitches that are involved in various toxicity responses41,42.
Our findings were made possible by recent advances in NMR techniques28–33, and specifically, the development of CEST NMR spectroscopy31–33. The uncovered functional excited state is a high-energy state that falls outside detection of all other techniques used in riboswitch studies to date. Our observation further raises the possibility that ES-mediated switching mechanisms may be at play in some riboswitches where similar ligand-free and ligand-bound aptamer structures have been observed17–21. In light of recent discoveries of similar mechanisms in allosteric proteins43, we anticipate this ES-mediated molecular strategy may be general among biomolecules and hence present in functions of other regulatory coding RNAs. Furthermore, it has become increasingly clear that many non-coding RNAs fold and interconvert between distinct conformational states for function44. Our study presents, to our knowledge, the first functionally established excited state in complex RNAs, providing direct evidence for the emerging view that RNA encodes excited states as a ‘hidden’ layer for regulation30,45,46. By demonstrating a new mode of ligand-dependent RNA function, our study suggests that, despite being composed of simple building blocks, RNA, like proteins47, can effectively explore conformational landscapes and incorporate functional excited states to direct biological outcomes. Developing a mechanistic understanding of how these ‘hidden’ conformational states regulate RNA function further promises new opportunities for rational design of RNA-based regulatory devices and RNA-targeted therapeutics.
ONLINE METHODS
Sample preparation
Unlabeled, uniformly 13C,15N-labeled, and base-specifically (G and A/U) 13C/15N-labeled fluoride riboswitch aptamer samples and mutants were prepared as previously described33. Briefly, the in vitro transcribed RNA samples were ethanol precipitated, gel purified (15% denaturing polyacrylamide gel), electro-eluted with the Elutrap system (Whatman), and anion-exchange purified with a 5 ml Hi-Trap Q column (GE Healthcare). Using Amicon filtration systems with 10K MW cut-off membranes (Millipore), the RNA samples were desalted, initially exchanged to water, and subsequently exchanged to 10 mM sodium phosphate (pH 6.4), 50 mM KCl, and 50 μM EDTA. For the Mg2+-free samples, RNAs were concentrated directly to ~1 mM concentration. For the apo (Mg2+-bound) samples, the
A
uthor Man
uscr
ipt
A
uthor Man
uscr
ipt
A
uthor Man
uscr
ipt
A
uthor Man
uscr
Mg2+-free RNA samples were further exchanged to the same buffer conditions with additional 10 mM MgCl2, and subsequently concentrated to ~1 mM concentration with the same buffer conditions with 2 mM MgCl2. For the holo (fluoride-bound) samples, the apo RNA samples were further exchanged to the same buffer conditions with 2 mM MgCl2 and 10 mM NaF. For the Mg2+-saturated U6C samples, the Mg2+-free RNA samples were exchanged to the same buffer conditions with additional 10 mM MgCl2. For H2O sample, 5% D2O was added. For D2O sample, the corresponding H2O sample was repeatedly lyophilized and re-dissolved in the same volume of 99.996% D2O (Sigma).
NMR spectroscopy
All NMR experiments were carried out on Bruker Avance III 500 and 600 spectrometers equipped with 5 mm quadruple-resonance (QCI) and triple-resonance (TCI) cryogenic probes, respectively. Exchangeable proton spectra were recorded using H2O samples at 283 K (10°C), and non-exchangeable proton spectra were recorded on H2O and D2O samples at 303 K (30°C). NMR spectra were processed and analyzed with TOPSPIN 3.2 (Bruker), NMRPipe48, and Sparky 3.110. (University of California, San Francisco, CA). As described previously49, the assignments were obtained using 2D NOESY, 2D TOCSY, 1H-15N HSQC, 1H-13C HSQC, 2D HCCH-COSY, 3D HCCH-TOCSY, HCCNH TOCSY, and HCN experiments on the unlabeled, uniformly labeled and base-specifically 13C,15N-labeled RNA samples, and the 31P spin-echo difference CT-HSQC and spin-echo difference CH-HCCH correlation experiments were used to determine the ε and β dihedral angles of the backbone. The interactions between imino protons and phosphate oxygens were characterized
using 1H-31P HSQC experiments50.
Structure calculation
For structure calculation of the apo B. cereus fluoride riboswitch aptamer, NOE restraints for inter-proton distances of non-helical regions were obtained from the 2D NOESY and 2D Watergate NOESY spectra acquired on D2O and H2O samples. A total of 293 experimental NOE distances were obtained, which were classified as very strong (2.5 Å), strong (3.5 Å), medium (4.5 Å), and weak (5.5 Å). For helical regions, 517 idealized A-form inter-proton distances were used as supported by RDC analysis (see below) and were categorized into 1.8–3.0 Å, 2.5–4.0 Å, 3.5–5.0 Å, and 4.5–6.0 Å ranges. Dihedral angle restraints (A-form values of α = −62.1 ± 30°, β = 180.1 ± 30°, γ = 47.4 ± 30°, ν2 = 37.3 ± 30°, and ζ = −74.7 ± 30° for helical residues, and experimentally determined values for ε, β, χ, and δ),
hydrogen bond distance and weak planarity restraints for 17 base pairs were incorporated in the structure calculations as previously described49. Initially, 200 structures were calculated from an extended and unfolded starting RNA structure using all restraints except RDCs following standard XPLOR protocols51. Structures with no experimental restraint violations (distances >0.5 Å and dihedral angles >5°) were further refined with 77 RDCs. All one-bond C-H and N-H RDCs were normalized to a C-H bond length of 1.0 Å for structure calculation using Xplor-NIH as described previously49. The choice of 1.0 Å is for referencing and does not affect structure calculations. The optimal values for the magnitude and asymmetry of the alignment tensor are Da = 23.2 Hz and R = 0.44. The force constant for RDCs was gradually increased from 0.1 to 0.5 kcal·mol−1·Hz−2. The 50 lowest-energy structures were subject to final refinement with a database potential51 together with RDCs, where the force constant
A
uthor Man
uscr
ipt
A
uthor Man
uscr
ipt
A
uthor Man
uscr
ipt
A
uthor Man
uscr
for the database potential was gradually increased from 0.01 to 0.2 kcal·mol−1·Hz−2. The 20 lowest-energy structures from the final refinement are reported. Structures were viewed and analyzed with MOLMOL52, PYMOL (DeLano Scientific LLC), and MolProbity53.
13C spin relaxation measurements
Longitudinal (R1) and rotating-frame (R1ρ) relaxation rates were measured for base carbons (C2, C6 and C8) using TROSY detected pulse sequences26. The same experimental
parameters were used for the apo and holo aptamers. The carrier position was set to 144 ppm and the spin-lock offset was 3750 Hz. The high-power off-resonance spin-lock field was calibrated as νSL = 4335.1 ± 44.6 Hz. Relaxation delays were 20 and 600 (×2) ms for R1 experiments, and 4 and 40 (×2) ms for R1ρ experiments, where duplicated measurements are indicated as ×2. Relaxation rates and experimental uncertainties (s.d.) were determined by fitting intensities to a mono-exponential decay, It = I0e−R×t, using NMRView54 and in-house software with a Monte-Carlo based method26. The transverse relaxation rates (R2) were obtained from R1ρ and R1 rates using R1ρ = R1 cos(2θ) + R2 sin(2θ), where θ = arctan(νSL/
Ω) is the effective tilt angle in the spin-lock field and Ω is the resonance offset from the spin-lock carrier frequency in Hz.
RDC measurements
One-bond C-H and N-H RDCs were measured on uniformly 13C,15N-labeled apo and holo aptamer samples in ~13 mg/ml Pf1 phage (ASLA Biotech, Ltd) at 303 K (30°C) on 600 MHz spectrometer using 2D 1H-13C S3CT-HSQC and standard 1H-15N HSQC
experiments26. NMR spectra for RDCs were processed and analyzed using NMRPipe/ NMRDraw48. A total of 89 and 88 RDCs were measured for the apo and holo samples, respectively. Experimental uncertainties (s.d.) in RDCs were estimated from splittings measured in 1H and 13C/15N dimensions. For analyzing apo-state RDCs in helical regions, idealized A-form helices of P1, P2 and P3 were used as input coordinates for program RAMAH26. Back calculated RDCs from these idealized A-form helices agree excellently with experimental RDCs with Q values of 0.11, 0.09, and 0.16 for P1, P2 and P3, respectively, suggesting idealized A-form geometries for the apo helical regions.
13C CEST measurements
13C CEST experiments were conducted at 600 MHz as previously described33. For CEST
experiments on G-labeled apo (Mg2+-bound) aptamer, 13C B1 fields (ω/2π) of 26.04 Hz and 35.44 Hz were used. For base carbon C8s, the 13C carrier was set to 135.6 ppm with a spectral width of 7.5 ppm, and the 13C offsets ranged from −1120 to 1000 Hz with spacing of 40 Hz. For sugar carbon C1’s, the 13C carrier was set to 90.9 ppm with a spectral width of 2.8 ppm, and the 13C offsets ranged from −800 to 800 Hz with spacing of 40 Hz. For CEST experiments on AU-labeled apo (Mg2+-bound) aptamer, 13C B1 fields (ω/2π) of 26.04 Hz and 35.44 Hz were used. For base carbon C2s/C6s/C8s, the 13C carrier was set to 144.6 ppm with a spectral width of 8.5 ppm. The 13C offsets ranged from 540 to 1740 Hz for C2s, and from −1800 to 80 Hz for C6s/C8s with spacing of 40 Hz. For sugar carbon C1’s, the 13C carrier was set to 90.0 ppm with a spectral width of 11 ppm, and the 13C offsets ranged between −800 to 800 Hz with spacing of 40 Hz. 1D-selective 13C CEST experiments were further carried out to measure CEST profiles for A37 and U38, which were either outside of
A
uthor Man
uscr
ipt
A
uthor Man
uscr
ipt
A
uthor Man
uscr
ipt
A
uthor Man
uscr
the offset range or overlapped in 2D CEST experiments, respectively. 13C B1 fields (ω/2π) of 26.04 Hz and 35.44 Hz were used with 13C offsets ranging from −640 to 1000 Hz for A37 and from −840 to 760 Hz for U38 with spacing of 40 Hz. For CEST experiments on G-labeled holo (F−-bound) aptamer, a single 13C B1 field (ω/2π) of 26.04 Hz was used. For base carbon C8s, the 13C carrier was set to 135.0 ppm with a spectral width of 5.5 ppm, and the 13C offsets ranged from −1120 to 1000 Hz with spacing of 40 Hz. For sugar carbon C1’s, the 13C carrier was set to 90.7 ppm with a spectral width of 3.5 ppm, and the 13C offsets ranged from −800 to 800 Hz with spacing of 40 Hz. For CEST experiments on AU-labeled holo (F−-bound) aptamer, a single 13C B1 field (ω/2π) of 26.04 Hz was used. For base carbon C2s/C6s/C8s, the 13C carrier was set to 138.9 ppm with a spectral width of 12 ppm. The 13C offsets ranged from 1440 to 2640 Hz for C2s and from −1000 to 1000 Hz for C6s/C8s with spacing of 40 Hz. For sugar carbon C1’s, the 13C carrier was set to 89.0 ppm with a spectral width of 11.8 ppm, and the 13C offsets ranged between −800 to 800 Hz with spacing of 40 Hz. For CEST experiments on G-labeled aptamer at an intermediate Mg2+ concentration, where 6-fold Mg2+ was added directly to the Mg2+-free sample, the 13C carrier was set to 135.6 ppm with a spectral width of 6.5 ppm. Two 13C B1 fields were used: for ω/2π = 10.64 Hz, the 13C offset ranged from −1110 to 990 Hz with spacing of 30 Hz; for ω/2π = 26.04 Hz, the 13C offset ranged from −1120 to 1000 Hz with spacing of 40 Hz. For CEST experiments on G-labeled Mg2+-free aptamer, the 13C carrier was set to 135.6 ppm with a spectral width of 6.5 ppm. Two 13C B1 fields were used: for ω/2π = 17.68 Hz, the 13C offset ranged from −990 to 990 Hz with spacing of 30 Hz; for ω/2π = 27.90 Hz, the 13C offset ranged from −1000 to 1000 Hz with spacing of 40 Hz. For CEST experiments on G-labeled Mg2+-free A37C and Δ3 aptamer mutants, the 13C carrier was set to 137.3 ppm with a spectral width of 10 ppm. 13C B1 fields (ω/2π) of 27.9 Hz and 37.84 Hz were used, and the 13C offsets ranged from −1240 to 1200 Hz with spacing of 40 Hz. For CEST experiments on G-labeled Mg2+-free CAA mutant, the 13C carrier was set to 135.6 ppm with a spectral width of 6.5 ppm. A single 13C B1 field (ω/2π) of 27.9 Hz was used, and the 13C offset ranged from −1000 to 1000 Hz with spacing 50 Hz.
13C ZZ-exchange measurements
ZZ-exchange experiments were conducted on H2O samples at 303 K (30°C) as previously described33. The mixing times were 200, 300, 400, 500, 600, 700, 800, 1000, and 1200 ms for both wild type and U6C samples. The intensity errors are estimated to be twice the signal-to-noise ratios in 2D spectra. Magnetizations for diagonal (IAA and IBB) and cross (IAB and IBA) peaks were fitted to a two-state (A ⇔ B) model using the following equation as previously described33,
A
uthor Man
uscr
ipt
A
uthor Man
uscr
ipt
A
uthor Man
uscr
ipt
A
uthor Man
uscr
where , a12 = −kBA, a21 =
−kAB, , and IA/B(0) represents the magnetization of the states A and B at Tmixing = 0. Data were fitted to the above equation using an in-house MATLAB® program with a Levenberg-Marquardt algorithm and the fitting errors were obtained from the Jacobian output and Monte-Carlo simulations.
CEST data analysis
All CEST profiles were obtained by normalizing peak intensity as a function of spin-lock offset to the peak intensity recorded at TEX = 0 s. Errors in CEST measurements were estimated based on triplicates at TEX = 0 and the baseline of CEST profiles. Profiles of residues in the apo WT, Mg2+-free A37C and Δ3 aptamers that display conformational exchange were fit to a two-state exchange between the ground state (G) and the excited state (E) based on the following Bloch-McConnell equations55,
where R1G/E is the 13C longitudinal relaxation rate of the ground/excited state, R2G/E is the 13C transverse relaxation rate of the ground/excited state, ωG/E is the offset of the applied 13C B1 field (strength of ω1) from the ground/excited state (ωG is measured from the observed ground-state peak position and ωE is defined as ωG + Δω, where Δω is the
chemical shift difference between the ground and excited states), pG/E is the population of the ground/excited state, and the rates are defined as kGE = pE kex and kEG = pG kex, where kex = kGE + kEG is the rate of exchange. For global fitting of CEST profiles, two global exchange parameters (kex and pE) are used together with individual relaxation rates (R1G/E, R2G/E) and chemical shift differences (Δω). During analysis, we assumed R1G = R1E, as the data does not constrain determination of these longitudinal relaxation parameters33. For analyzing CEST profiles of C1′, an average C1′–C2′ scalar coupling of 45 Hz was implemented to calculate two CEST profiles, one representative of C2′ in the ‘down’ state and another in the ‘up’ state56. For analyzing CEST profiles of C6, an average C6-C5 scalar coupling of 65 Hz was implemented to calculate two CEST profiles, one representative of C5 in the ‘down’ state and another in the ‘up’ state56. For residues without conformational
A
uthor Man
uscr
ipt
A
uthor Man
uscr
ipt
A
uthor Man
uscr
ipt
A
uthor Man
uscr
exchange, the two-state exchange model was simplified to a one-state model by fixing all exchange parameters (pE and kex) to zero. CEST profiles of G7 in the intermediate Mg2+ concentration with complex three-state behavior were fit to a three-state exchange model between the free (F), apo excited (E), and apo ground (G) states based on the following Bloch-McConnell equations55,
where R1i is the 13C longitudinal relaxation rate of state i, R2i is the 13C transverse relaxation rate of state i, ωi is the offset of the applied 13C B1 field from state i (ωG is the observed ground-state peak position; ωF is the observed free-state peak position; ωE = ωF + ΔωFE, where ΔωFE is the chemical shift difference between the free and apo excited states). The population is pi and the rates are defined as, kGE = pE k1 / (pG+ pE), kEG = pG k1 / (pG+ pE), kFE = pE k2 / (pF+ pE), kEF = pF k2 / (pF+ pE), and pG + pE + pF =1. G7 CEST profiles of both the free and apo ground states were jointly fitted using five global exchange
parameters (k1, k2, pE, pG, and ΔωFE) and individual relaxation parameters R1F = R1E, R1G, R2F, R
2E, and R2G. For fitting WT G7 profile obtained in the absence of Mg2+, which also displays three-state exchange behavior, the same three-state Bloch-McConnell equation and data analysis procedure was employed, except the symbol (G) is referred to as a second excited state sampled by G7, which is not present in the apo state and is subject to future investigation. All profiles were fitted using an in-house MATLAB® program with a Levenberg-Marquardt algorithm.
Single-round transcription assay
Single-round transcription assays were carried out at 303 K (30°C), the same temperature at which NMR measurements were performed, using a protocol adapted from previously described methods57. E. coli RNAP (New England Biolabs®) elongation complexes were paused on a DNA template containing a λPR promoter, a 26-nt C-less spacer (A26: AUGUAGUAAGGAGGUUGUAUGGAAGAC), followed by the full-length riboswitch, in which an adenine within the wild-type poly-U stretch was removed to improve termination efficiency. Transcription was initiated in a solution containing 150 μM ApU (TriLink BioTechnologies), 2.5 μM GTP, 2.5 μM UTP, 1 μM ATP, 1U RNAseOUT®, 5% glycerol, and α-32P-radiolabeled ATP in 1× transcription buffer (20 mM Tris-HCl, pH 8.0, 20 mM NaCl, 100 μM EDTA, 14 mM 2-mercaptoethanol, and 5 mM Mg2+) by addition of 0.75U RNAP to the DNA template (18.75 nM) and incubation at 303 K (30°C) for 10 min. In the
A
uthor Man
uscr
ipt
A
uthor Man
uscr
ipt
A
uthor Man
uscr
ipt
A
uthor Man
uscr
absence of CTP, the RNAP pauses at the end of the 26-nt spacer immediately upstream of the riboswitch. Prior to elongation, a DNA oligonucleotide complementary to A26, which prevents A26 from interfering with riboswitch folding, was added at 1 μM final
concentration in 1× transcription buffer at varying Mg2+ concentrations defined by individual experiments and incubated at ambient temperature for 5 min to ensure
hybridization. To initiate elongation, 5 μL of paused complex was added to 2 μL of chase, which contained all four NTPs at varying concentrations (3 μM – 1 mM final concentration), varying fluoride concentrations (0 – 50 mM, where the range of concentration is limited due to the solubility of MgF2), and 1 mg/mL heparin in 1× transcription buffer, and incubated at 303 K (30°C) for 15 min. Reactions were quenched in stop buffer (1× transcription buffer, 7 M Urea, 30 mM EDTA, and trace bromophenol blue and xylene cyanol). Time points for measuring pausing duration were collected in quintuplicate before being combined and analyzed following the established protocol36,57. Samples were then run on a 10% PAGE denaturing gel and visualized by phosphorimager using ImageJ software58. Data obtained from independently performed single-round transcription assays agree well between individual duplicate data points, demonstrating the high accuracy of the assay in measuring transcription read-through and EC50. For the U6C mutant, the EC50 is estimated by assuming that it can achieve the same level of transcription activation as the WT at high fluoride concentrations given the mutant and the WT aptamers adopt highly similar fluoride-bound, transcription-ON states.
Data analysis and simulation of transcription regulation
The kinetic scheme for transcription regulation by the riboswitch can be described as two continuous stages, a sensing stage during the transcription elongation period (dt1) and a communication stage during the poly-U stretch pausing period (dt2). The initial elongation time (dt1) is determined by RNAP elongation rate and the 21-nt-distance between U57 (~12-nt RNA footpri(~12-nt for RNAP11,34,35 after residue U45) to the last poly-U residue (U78). Given the expression platform is still being transcribed during this period, only aptamer folding occurs, which is described by the following kinetic equations,
where pH is the population of the holo state, pG is the population of the apo GS, pE is the population of the apo ES, and kij is the exchange rate constant between states i and j. Here, the unimolecular rate constants, kHG and kGE, are obtained directly from NMR ZZ-exchange and CEST measurements, respectively. The apparent bimolecular rate constants, kGH and kEG, are derived from kGH = kHG [F−] / Kd,F and kEG = kGE [Mg2+] / Kd,Mg, respectively, where Kd,F and Kd,Mg are NMR-determined dissociation constants of fluoride and magnesium binding, and [F−] and [Mg2+] are fluoride and magnesium concentrations. The initial condition at dt1 = 0 is set to be pH = pG = 0 and pE = 1. Three RNAP elongation rates11,39,59 of 4, 20, and 40 nt/s were used to calculate dt1 values as input for three simulations. For simulating U6C, the kinetic equations were simplified to contain only two
A
uthor Man
uscr
ipt
A
uthor Man
uscr
ipt
A
uthor Man
uscr
ipt
A
uthor Man
uscr
states by removing parameters for the excited state. The unimolecular rate constant kHG,U6C is obtained directly from NMR ZZ-exchange measurement, and the apparent bimolecular rate constant kGH,U6C is derived from kGH,U6C = kHG,U6C [F−] / Kd,F,U6C, where Kd,F,U6C is the NMR-determined dissociation constant of fluoride binding by the U6C aptamer, and [F−] is fluoride concentration. The initial condition at dt1 = 0 is set to be pH = 0 and pG = 1. Upon reaching the poly-U stretch, RNAP pauses for a time period (dt2)37,38. Given the length of pausing is dependent on cellular conditions27,36, dt2 is a variable in simulations. This pausing period is the time window during which the terminator stem forms, a rate limiting step that is coupled with melting of the DNA-RNA hybrid37,38. Based on structural data, we introduced an intermediate state between the apo ES and the terminator state during this pausing period, where the unlocked U45 is sequestered into a base pair with residue A64. The rationale for this intermediate state is as follows. First, while most expression-platform residues involved in strand invasion of P3 are still within RNAP due to the ~12-nt RNA-footprint11,34,35, residue A64 just exits RNAP and is spatially available to base pair with the unpaired U45. Second, the rate constant of closing a terminal base pair, such as the
formation of U45•A64 pair, is on the order of 1.0×10⁶ s−1 (ref. 60), which is fast enough for this event to occur during the time period (dt2). Third, the formation of U45•A64 pair also sequesters U45 from forming the essential ‘linchpin’ A37•U45 pair, which can further destabilize the structured apo aptamer as shown in ‘linchpin’-deletion mutants and the pseudo-cotranscriptional NMR measurements. Therefore, during this pausing period, the process of aptamer folding and terminator formation is described by the following equations,
where pH is the population of the holo state, pG is the population of the apo GS, pE is the population of the apo ES, pI is the population of the intermediate state, pT is the population of the termination state, and kij is the exchange rate constant between states i and j. The initial condition at dt2 = 0 is set as pH = pH,dt1, pG = pG,dt1, pE = pE,dt1, and pI = pT = 0, where pH,dt1, pG,dt1, and pE,dt1 are populations of the holo state, the apo GS, and the apo ES at the end of the dt1 period, respectively. For simulating U6C, the kinetic equations are simplified to contain four states of pH, pG, pI, pT, with direct exchange rate constants between states G and I. For extracting the effective folding rate constants of terminator formation (kIE, kEI, kIT, and kTI) in the context of RNAP, we employed the kinetic scheme to globally fit fluoride-free NTP-dependent transcriptional activation of WT and M18 as a function of the elongation time calculated at 20 nt/s (dt1) and the experimentally determined pausing duration at given NTP concentrations (dt2). The input [Mg2+] is 5 mM based on conditions in transcription assays. We fixed kEI = 1.0×10⁶ s−1 based on literature60, as our data does not constrain determination of this fast rate constant, resulting in kIE = 6.4 ± 2.6×10⁴ s−1, kIT = 1.2 ± 0.2 s−1, and kTI = 0.05 ± 0.02 s−1. However, varying kEI from 1.0×10⁷ to 1.0×10³ s−1 only scales kIE accordingly without affecting kIT and kTI values.
A
uthor Man
uscr
ipt
A
uthor Man
uscr
ipt
A
uthor Man
uscr
ipt
A
uthor Man
uscr
Analyses and simulations were conducted using an in-house MATLAB® program with a Levenberg-Marquardt algorithm being applied for data fitting.
Code availability
The in-house MATLAB® scripts for data analyses and kinetic simulations are available upon request.
Data availability
Coordinates have been deposited in the Protein Data Bank under accession number 5KH8, and chemical shifts have been deposited in the Biological Magnetic Resonance Bank under entry 30108. The summary of NMR restraints and structure refinement statistics is presented in Supplementary Table 1.
Supplementary Material
Refer to Web version on PubMed Central for supplementary material.
Acknowledgments
We thank G. Young for maintenance of NMR instruments and members of the Zhang lab for critical comments. This work was supported by start-up fund from the University of North Carolina at Chapel Hill and an NIH grant (R01 GM114432) to Q.Z.
References
1. Mironov AS, et al. Sensing small molecules by nascent RNA: a mechanism to control transcription in bacteria. Cell. 2002; 111:747–756. [PubMed: 12464185]
2. Nahvi A, et al. Genetic control by a metabolite binding mRNA. Chem Biol. 2002; 9:1043. [PubMed: 12323379]
3. Winkler W, Nahvi A, Breaker RR. Thiamine derivatives bind messenger RNAs directly to regulate bacterial gene expression. Nature. 2002; 419:952–956. [PubMed: 12410317]
4. Serganov A, Nudler E. A decade of riboswitches. Cell. 2013; 152:17–24. [PubMed: 23332744] 5. Batey RT. Structure and mechanism of purine-binding riboswitches. Q Rev Biophys. 2012; 45:345–
381. [PubMed: 22850604]
6. Noeske J, et al. An intermolecular base triple as the basis of ligand specificity and affinity in the guanine- and adenine-sensing riboswitch RNAs. Proc Natl Acad Sci USA. 2005; 102:1372–1377. [PubMed: 15665103]
7. Lee MK, Gal M, Frydman L, Varani G. Real-time multidimensional NMR follows RNA folding with second resolution. Proc Natl Acad Sci USA. 2010; 107:9192–9197. [PubMed: 20439766] 8. Heppell B, et al. Molecular insights into the ligand-controlled organization of the SAM-I riboswitch.
Nat Chem Biol. 2011; 7:384–392. [PubMed: 21532599]
9. Haller A, Rieder U, Aigner M, Blanchard SC, Micura R. Conformational capture of the SAM-II riboswitch. Nat Chem Biol. 2011; 7:393–400. [PubMed: 21532598]
10. Wilson RC, et al. Tuning riboswitch regulation through conformational selection. J Mol Biol. 2011; 405:926–938. [PubMed: 21075119]
11. Frieda KL, Block SM. Direct observation of cotranscriptional folding in an adenine riboswitch. Science. 2012; 338:397–400. [PubMed: 23087247]
12. Chen B, Zuo X, Wang YX, Dayie TK. Multiple conformations of SAM-II riboswitch detected with SAXS and NMR spectroscopy. Nucleic Acids Res. 2012; 40:3117–3130. [PubMed: 22139931]
A
uthor Man
uscr
ipt
A
uthor Man
uscr
ipt
A
uthor Man
uscr
ipt
A
uthor Man
uscr
13. Suddala KC, et al. Single transcriptional and translational preQ1 riboswitches adopt similar pre-folded ensembles that follow distinct folding pathways into the same ligand-bound structure. Nucleic Acids Res. 2013; 41:10462–10475. [PubMed: 24003028]
14. Reining A, et al. Three-state mechanism couples ligand and temperature sensing in riboswitches. Nature. 2013; 499:355–359. [PubMed: 23842498]
15. Zhang J, Jones CP, Ferre-D’Amare AR. Global analysis of riboswitches by small-angle X-ray scattering and calorimetry. Biochim Biophys Acta. 2014; 1839:1020–1029. [PubMed: 24769285] 16. Ren A, et al. Structural and dynamic basis for low-affinity, high-selectivity binding of L-glutamine
by the glutamine riboswitch. Cell Rep. 2015; 13:1800–1813. [PubMed: 26655897]
17. Stoddard CD, et al. Free state conformational sampling of the SAM-I riboswitch aptamer domain. Structure. 2010; 18:787–797. [PubMed: 20637415]
18. Serganov A, Huang L, Patel DJ. Structural insights into amino acid binding and gene control by a lysine riboswitch. Nature. 2008; 455:1263–1267. [PubMed: 18784651]
19. Huang L, Serganov A, Patel DJ. Structural insights into ligand recognition by a sensing domain of the cooperative glycine riboswitch. Mol Cell. 2010; 40:774–786. [PubMed: 21145485]
20. Jenkins JL, Krucinska J, McCarty RM, Bandarian V, Wedekind JE. Comparison of a preQ1 riboswitch aptamer in metabolite-bound and free states with implications for gene regulation. J Biol Chem. 2011; 286:24626–24637. [PubMed: 21592962]
21. Vicens Q, Mondragon E, Batey RT. Molecular sensing by the aptamer domain of the FMN riboswitch: a general model for ligand binding by conformational selection. Nucleic Acids Res. 2011; 39:8586–8598. [PubMed: 21745821]
22. Stagno JR, et al. Structures of riboswitch RNA reaction states by mix-and-inject XFEL serial crystallography. Nature. 2017; 541:242–246. [PubMed: 27841871]
23. Baker JL, et al. Widespread genetic switches and toxicity resistance proteins for fluoride. Science. 2012; 335:233–235. [PubMed: 22194412]
24. Li S, et al. Eukaryotic resistance to fluoride toxicity mediated by a widespread family of fluoride export proteins. Proc Natl Acad Sci USA. 2013; 110:19018–19023. [PubMed: 24173035] 25. Ren A, Rajashankar KR, Patel DJ. Fluoride ion encapsulation by Mg2+ ions and phosphates in a
fluoride riboswitch. Nature. 2012; 486:85–89. [PubMed: 22678284]
26. Bothe JR, et al. Characterizing RNA dynamics at atomic resolution using solution-state NMR spectroscopy. Nat Methods. 2011; 8:919–931. [PubMed: 22036746]
27. Wickiser JK, Winkler WC, Breaker RR, Crothers DM. The speed of RNA transcription and metabolite binding kinetics operate an FMN riboswitch. Mol Cell. 2005; 18:49–60. [PubMed: 15808508]
28. Sekhar A, Kay LE. NMR paves the way for atomic level descriptions of sparsely populated, transiently formed biomolecular conformers. Proc Natl Acad Sci USA. 2013; 110:12867–12874. [PubMed: 23868852]
29. Palmer AG 3rd. Chemical exchange in biomacromolecules: past, present, and future. J Magn Reson. 2014; 241:3–17. [PubMed: 24656076]
30. Dethoff EA, Petzold K, Chugh J, Casiano-Negroni A, Al-Hashimi HM. Visualizing transient low-populated structures of RNA. Nature. 2012; 491:724–728. [PubMed: 23041928]
31. Fawzi NL, Ying J, Ghirlando R, Torchia DA, Clore GM. Atomic-resolution dynamics on the surface of amyloid-beta protofibrils probed by solution NMR. Nature. 2011; 480:268–272. [PubMed: 22037310]
32. Vallurupalli P, Bouvignies G, Kay LE. Studying “invisible” excited protein states in slow exchange with a major state conformation. J Am Chem Soc. 2012; 134:8148–8161. [PubMed: 22554188] 33. Zhao B, Hansen AL, Zhang Q. Characterizing slow chemical exchange in nucleic acids by carbon
CEST and low spin-lock field R1rho NMR spectroscopy. J Am Chem Soc. 2014; 136:20–23. [PubMed: 24299272]
34. Monforte JA, Kahn JD, Hearst JE. RNA folding during transcription by Escherichia coli RNA polymerase analyzed by RNA self-cleavage. Biochemistry. 1990; 29:7882–7890. [PubMed: 1702018]
A
uthor Man
uscr
ipt
A
uthor Man
uscr
ipt
A
uthor Man
uscr
ipt
A
uthor Man
uscr
35. Komissarova N, Kashlev M. Functional topography of nascent RNA in elongation intermediates of RNA polymerase. Proc Natl Acad Sci USA. 1998; 95:14699–14704. [PubMed: 9843952] 36. Gusarov I, Nudler E. Control of intrinsic transcription termination by N and NusA: the basic
mechanisms. Cell. 2001; 107:437–449. [PubMed: 11719185]
37. Yarnell WS, Roberts JW. Mechanism of intrinsic transcription termination and antitermination. Science. 1999; 284:611–615. [PubMed: 10213678]
38. Gusarov I, Nudler E. The mechanism of intrinsic transcription termination. Mol Cell. 1999; 3:495– 504. [PubMed: 10230402]
39. Abbondanzieri EA, Greenleaf WJ, Shaevitz JW, Landick R, Block SM. Direct observation of base-pair stepping by RNA polymerase. Nature. 2005; 438:460–465. [PubMed: 16284617]
40. Watters KE, Strobel EJ, Yu AM, Lis JT, Lucks JB. Cotranscriptional folding of a riboswitch at nucleotide resolution. Nat Struct Mol Biol. 2016; 23:1124–1131. [PubMed: 27798597] 41. Wang JX, Lee ER, Morales DR, Lim J, Breaker RR. Riboswitches that sense
S-adenosylhomocysteine and activate genes involved in coenzyme recycling. Mol Cell. 2008; 29:691–702. [PubMed: 18374645]
42. Nelson JW, Atilho RM, Sherlock ME, Stockbridge RB, Breaker RR. Metabolism of free guanidine in bacteria is regulated by a widespread riboswitch class. Mol Cell. 2017; 65:220–230. [PubMed: 27989440]
43. Tzeng SR, Kalodimos CG. Allosteric inhibition through suppression of transient conformational states. Nat Chem Biol. 2013; 9:462–465. [PubMed: 23644478]
44. Dethoff EA, Chugh J, Mustoe AM, Al-Hashimi HM. Functional complexity and regulation through RNA dynamics. Nature. 2012; 482:322–330. [PubMed: 22337051]
45. Hoogstraten CG, Wank JR, Pardi A. Active site dynamics in the lead-dependent ribozyme. Biochemistry. 2000; 39:9951–9958. [PubMed: 10933815]
46. Blad H, Reiter NJ, Abildgaard F, Markley JL, Butcher SE. Dynamics and metal ion binding in the U6 RNA intramolecular stem-loop as analyzed by NMR. J Mol Biol. 2005; 353:540–555. [PubMed: 16181635]
47. Henzler-Wildman K, Kern D. Dynamic personalities of proteins. Nature. 2007; 450:964–972. [PubMed: 18075575]
48. Delaglio F, et al. NMRPipe - A multidimensional spectral processing system based on Unix pipes. J Biomol NMR. 1995; 6:277–293. [PubMed: 8520220]
49. Zhang Q, Kim NK, Peterson RD, Wang Z, Feigon J. Structurally conserved five nucleotide bulge determines the overall topology of the core domain of human telomerase RNA. Proc Natl Acad Sci USA. 2010; 107:18761–18768. [PubMed: 20966348]
50. Duchardt-Ferner E, Ferner J, Wohnert J. Rapid identification of noncanonical RNA structure elements by direct detection of OH...O=P, NH...O=P, and NH2...O=P hydrogen bonds in solution NMR spectroscopy. Angew Chem Int Ed Engl. 2011; 50:7927–7930. [PubMed: 21837618] 51. Bermejo GA, Clore GM, Schwieters CD. Improving NMR Structures of RNA. Structure. 2016;
24:806–815. [PubMed: 27066747]
52. Koradi R, Billeter M, Wuthrich K. MOLMOL: a program for display and analysis of macromolecular structures. J Mol Graph. 1996; 14:51–55. [PubMed: 8744573]
53. Davis IW, et al. MolProbity: all-atom contacts and structure validation for proteins and nucleic acids. Nucleic Acids Res. 2007; 35:W375–383. [PubMed: 17452350]
54. Johnson BA, Blevins RA. NMRView - A computer-program for the visualization and analysis of NMR data. J Biomol NMR. 1994; 4:603–614. [PubMed: 22911360]
55. Mcconnell HM. Reaction rates by nuclear magnetic resonance. J Chem Phys. 1958; 28:430–431. 56. Vallurupalli P, Kay LE. Probing slow chemical exchange at carbonyl sites in proteins by chemical
exchange saturation transfer NMR spectroscopy. Angew Chem Int Ed Engl. 2013; 52:4156–4159. [PubMed: 23450751]
57. Landick R, Wang D, Chan CL. Quantitative analysis of transcriptional pausing by Escherichia coli RNA polymerase: his leader pause site as paradigm. Methods Enzymol. 1996; 274:334–353. [PubMed: 8902817]
A
uthor Man
uscr
ipt
A
uthor Man
uscr
ipt
A
uthor Man
uscr
ipt
A
uthor Man
uscr
58. Schneider CA, Rasband WS, Eliceiri KW. NIH Image to ImageJ: 25 years of image analysis. Nat Methods. 2012; 9:671–675. [PubMed: 22930834]
59. Mejia YX, Nudler E, Bustamante C. Trigger loop folding determines transcription rate of Escherichia coli’s RNA polymerase. Proc Natl Acad Sci USA. 2015; 112:743–748. [PubMed: 25552559]
60. Xu X, Yu T, Chen SJ. Understanding the kinetic mechanism of RNA single base pair formation. Proc Natl Acad Sci USA. 2016; 113:116–121. [PubMed: 26699466]
A
uthor Man
uscr
ipt
A
uthor Man
uscr
ipt
A
uthor Man
uscr
ipt
A
uthor Man
uscr
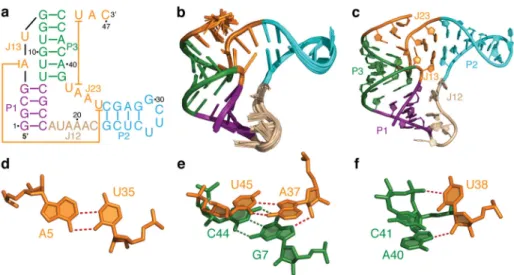
Figure 1. Solution structure of the apo B. cereus fluoride riboswitch aptamer
(a) Sequence and secondary structure of the B. cereus fluoride riboswitch aptamer used in the NMR study. The long-range base pairing between A5 and U35 and between A37 and U45 are highlighted with lines. (b) Superposition of 20 lowest-energy solution structures of the apo aptamer. (c) The lowest energy structure of the apo aptamer. (d) Long-range reverse Watson-Crick A5•U35 base pair. (e) Long-range reverse Hoogsteen A37•U45 base pair, and long-range hydrogen bond between A37-2′OH and G7-N7. (f) Long-range hydrogen bonds between U38-2′OH and A40-N7 and between U38-N3H3 and C41-O2P.
A
uthor Man
uscr
ipt
A
uthor Man
uscr
ipt
A
uthor Man
uscr
ipt
A
uthor Man
uscr
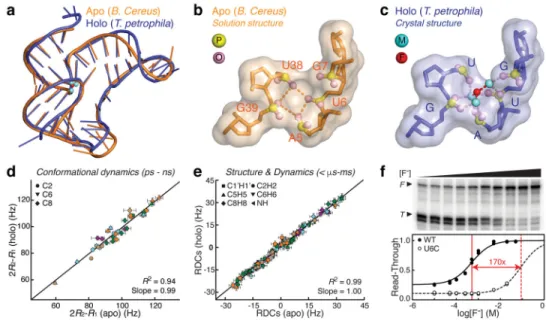
Figure 2. The fluoride riboswitch aptamer adopts structurally similar apo and holo states
(a) Comparison between the apo solution structure of B. cereus aptamer and the holo crystal structure of T. petrophila aptamer. The fluoride and Mg2+ ions in the holo crystal structure are shown in red and green spheres, respectively. (b, c) Structures of the fluoride-binding pocket in apo B. cereus aptamer (b) and holo T. petrophila aptamer (c), where phosphorus and phosphate oxygens are shown in yellow and pink spheres, respectively. Coordination of fluoride and Mg2+ ions to phosphates is highlighted in dashed lines in (c). (d) Correlation between 2R2–R1 values measured in the apo and holo B. cereus aptamer. Symbols are colored as the secondary structure in Figure 1. Error bars indicate experimental uncertainties (s.d.) estimated from fitting n = 3 independently measured peak intensities to a mono-exponential decay using a Monte-Carlo based method. (e) Correlation between RDCs measured in the apo and holo B. cereus aptamer. Error bars indicate experimental
uncertainties (s.d.) estimated from splittings measured in 1H and 13C/15N dimensions, n = 89 (apo) and n = 88 (holo). (f) Fluoride-dependent single-round transcription assay with 5 mM Mg2+, 1 mM NTPs, a B. cereus fluoride riboswitch template, and E. coli RNAP
holoenzyme. Top, autoradiogram of a 10% PAGE denaturing gel separating the full-length (F) and terminated (T) RNA products (Supplementary Fig. 3). Bottom, fluoride-dependent read-through, F/(F+T), for the WT and U6C mutant, where EC50s are highlighted in vertical red lines. Shown are n = 2 independent replicates.
A
uthor Man
uscr
ipt
A
uthor Man
uscr
ipt
A
uthor Man
uscr
ipt
A
uthor Man
uscr
Figure 3. The apo B. cereus fluoride riboswitch aptamer populates an excited state
(a, b) CEST profiles depicting carrier (in ppm) dependence of intensity in the holo (a) and apo (b) states. Error bars indicate experimental uncertainties (s.d.) estimated from n = 3 independently measured peak intensities. Spheres shown on the structures are the sites where CEST data were measured. Gray spheres are carbon probes fit to a single-state model and red spheres are carbon probes fit to a two-state exchange model. (c) Schematic
secondary structures of the apo GS and the apo ES for the B. cereus fluoride aptamer with exchange parameters. (d) Comparison of base C8 chemical shifts of G7 for the apo GS, the apo ES, and Mg2+-free GSs and ESs of wild type and mutants.
A
uthor Man
uscr
ipt
A
uthor Man
uscr
ipt
A
uthor Man
uscr
ipt
A
uthor Man
uscr
Figure 4. Single-round transcription assay of the B. cereus fluoride riboswitch in the absence of fluoride
(a) Secondary structures of the full-length B. cereus fluoride riboswitch shown in the termination (left) and read-through (right) states. The G8U9-to-U8A9 mutation (M18), which abolishes fluoride responsiveness by destabilizing the P3 helix23, is employed here as an internal control to measure intrinsic termination efficiency. (b) Mg2+ dependence of transcription activation by the B. cereus fluoride riboswitch and the baseline transcription activation due to imperfect termination efficiency (M18). Shown are n = 2 independent replicates for each construct.