2008
Lisbon. 2009 Available on www.bportugal.pt
Payment Systems Department Av. Almirante Reis. 71 - 7º 1150-012 Lisboa
Design and Distribution Administrative Services Department Documentation. Editing and Museum Division Av. Almirante Reis. 71 - 2º
1150-012 Lisboa
Priting
DSALG - Serviço de Apoio. Ofi cinas Gráfi cas Av. Almirante Reis. 71
1150-012 Lisboa Lisbon. 2009 Number of copies 50 copies Depósito Legal n.º 249068/06 ISSN 1646-026x
Contents
Acronyms ... 9
Presentation... 11
Chapter 1. Introduction ... 15
Chapter 2. The Interbank Settlement System in Portugal ... 19
Chapter 3. Overall Figures for Interbank Settlement in 2008 ... 25
Chapter 4. Settlement through SPGT2 and TARGET2-PT ... 31
Chapter 5. Settlement through TARGET2 ... 41
Chapter 6. Settlement through Interbank Clearing ... 45
Chapter 7.Payment Instruments in Clearing and Settlement Systems... 51
7.1. Cheques ... 51
7.2. Bills of Exchange ... 52
7.3. Interbank Electronic Transfers ... 53
7.4. Direct Debits ... 55
7.5. Multibanco ... 57
Chapter 8. Regulation and Control of Means of Payment ... 63
Appendix I From SPGT to TARGET2-PT ... 69
Appendix II Securities Settlement Systems ... 75
Appendix III TARGET2-Securities ... 79
Appendix IV SEPA – Single Euro Payments Area ... 83
Appendix V SEPA Credit Transfers in Portugal in 2008 ... 87
Appendix VI Highlights of 2008 ... 91
Tables
Table 1 Transactions through the Interbank Settlement System ... 25
Table 2 Daily averages in the Interbank Settlement System ... 26
Table 3 Concentration ratios in the Interbank Settlement System ... 27
Table 4 Operations settled through SPGT2 ... 31
Table 5 Overall movement of SPGT2 – Domestic operations ... 32
Table 6 Domestic operations from ancillary systems ... 33
Table 7 Cross-border operations sent to TARGET2 from SPGT2 and from TARGET2-PT .. 35
Table 8 Cross-border operations received from TARGET2 in SPGT2 and in TARGET2-PT 35 Table 9 SPGT2 – Settlement per operating period in 2008... 36
Table 10 Use of intraday credit in SPGT2 in 2008 ... 38
Table 11 Payment instructions processed through TARGET2 and EURO1 ... 41
Table 12 Payment instructions sent by national components in TARGET2 in 2008 ... 42
Table 13 Overall movement through SICOI ... 45
Table 14 Average amount of payment per instrument ... 46
Table 15 Overall movement through SICOI (as percentages) ... 46
Table 16 Use of payment instruments in Portugal... 47
Table 17 Cheques cleared ... 51
Table 18 Large-value cheques ... 51
Table 19 Cleared and large-value cheques... 51
Table 20 Cheques returned as per reason for return ... 52
Table 21 Bills of exchange cleared, broken down by type ... 53
Table 22 Large-value bills of exchange ... 53
Table 23 Interbank Electronic Transfers cleared ... 54
Table 24 Large-value credit transfers ... 54
Table 25 Interbank electronic transfers per operation code in 2008 – traditional form... 55
Table 26 Direct debits cleared ... 56
Table 27 Large-value direct debits ... 56
Table 28 Instructions for direct debits per operation code... 56
Table 29 Multibanco cards and terminals ... 57
Table 30 Multibanco operations cleared... 58
Table 32 Payment of services – payments to the public sector ... 59 Table 33 SEPA transfers processed in 2008 ... 88
Charts
Chart 1 Changes in the quantities of domestic and cross-border operations in the SPGT2 31
Chart 2 Changes in the values of domestic and cross-border operations in the SPGT2 ... 32
Chart 3 Domestic and cross-border operations in the SPGT2 (as a % of the number of transactions) ... 34
Chart 4 Domestic and cross-border operations in the SPGT2 (as a % of the value of transactions) ... 34
Chart 5 SPGT2 – Number of operations settled in 2008 (daily data) ... 37
Chart 6 SPGT2 – Value of operations settled in 2008 (daily data) ... 37
Acronyms
4CB The Central Banks of Germany, Spain, France and Italy AGIL* Application for the Integrated Management of Settlements
ATM Automated Teller Machine
BdP* Banco de Portugal
CCBM2 Collateral Central Bank Management 2 CISP* Payment Systems Interbank Commission CSD Central Securities Depository
EBA Euro Banking Association
EC European Commission
ECB European Central Bank
EFTPOS Electronic Funds Transfer at Point Of Sale
EPC European Payments Council
ESCB European System of Central Banks
ESI Eurosystem Single Interface
EU European Union
Eurosystem Banking system comprising NCBs in the euro area and the ECB
GDP Gross Domestic Product
GTI* Interbank Working Group IDD* Direct Debit Instruction
IGCP* Treasury and Public Credit Management Institute
INTERBOLSA* Portuguese Central Securities Depository and Securities Settlement System LUR* List of cheque users who constitute a potential risk
MIBEL* Iberian electricity market
MULTIBANCO* Portuguese ATM and POS network
NASO – PT National Adherence Support Organization – Portugal
NCB National Central Bank
NUG – PT National User Group for T2S – Portugal OMIClear* Energy markets clearing company OMIP* Iberian energy market operator
OTC Over the counter
PSD Payment Services Directive
PSSC Payment and Settlement Systems Committee RTGS Real-Time Gross Settlement System
SCT SEPA Credit Transfers SDD* Direct debit system
SEPA Single Euro Payments Area SEPA CT SEPA Credit Transfers
SETF* Secretary of State for the Treasury and Finance
SIBS* Interbank Service Company – the Portuguese bank service provider SICOI* Interbank clearing system
SITEME* Banco de Portugal electronic system for market transfers SLG* INTERBOLSA securities settlement system
SLOD* Settlement system for other depositors SLrt* INTERBOLSA real-time settlement system SLT* Securities Settlement System
SPGT* Large-value payment system SPGT2* Large-value payment system 2
SSP Single Shared Platform for TARGET2
STEP2 EBA settlement system for retail operations
T2S TARGET2 Securities (Trans-European Automated Real-time Gross settlement Express Transfer- system 2 Securities)
TARGET Trans-European Automated Real-time Gross settlement Express Transfer- system TARGET2 Trans-European Automated Real-time Gross settlement Express Transfer- system 2 TEI* Interbank electronic transfers
TPA* Automatic payment terminal
XCT* Non-SEPA cross-border credit transfer system
Presentation
The Payment Systems Report, which has been compiled every year since 1994, was subject to a signifi cant change.
In fact, this report for 2008 has one main purpose: to make the information on payment systems more accessible to the readers and, therefore, more comprehensive.
In order to reach this aim:
– the structure of the report has been changed so that each chapter can be read independently, depending on the reader’s specifi c interests;
– the information on retail payment instruments has been structured separately, with the information on clearing operations integrated with large-value payments (amounts equal to or more than 100 thousand euros), allowing for a global perspective of each of the payment instruments;
– a selection of current topics is presented in separate appendices, and this means that the report can be easily understood, with highlight given to the main quantitative features in the payment systems for 2008;
– there is a Statistical Appendix with 83 charts containing information relating to the past fi ve years, providing a better perception of how Portuguese payment systems have developed.
Introduction
The interbank settlement systems functioned smoothly throughout the year.
Gross settlement through SPGT21 grew by 4.5% in volume and 14.1% in value year on year, while settlements through the interbank clearing system (SICOI) grew by 4.7% in quantity and 2.8% in value.
The increase in SICOI was due to the growth in electronic payment instruments, both in quantity and in value: interbank electronic transfers (TEI) grew by 12.1% in quantity and 15.3% in value, direct debits grew by 12.4% in quantity and 18.1% in value and the Multibanco system was also up, though not as strongly, coming in with a 5.5% growth in quantity and 9.7% in value.
On the other side, paper-based payment instruments were down, with falls in quantity (by 10.4% for cheques and by 15.2% for bills of exchange) and in value (down 7.1% for cheques and 7.6% for bills of exchange).
On the organisational and institutional side, the following events are worth highlighting: (i) preparation for defi nitive migration to TARGET2;2 (ii) the decision to continue with the TARGET2-Securities (T2S)3 project; and (iii) broadening and deepening the Single Euro Payments Area (SEPA)4 project.
On 18 February 2008, the national banking community began a transition phase to TARGET2. This was concluded with defi nitive migration on 2 March 2009. During this phase, the Banco de Portugal acted as the channel between the SPGT2 and TARGET2, and therefore, practically all the banks operating in Portugal had an indirect participation.
In order to assure a smooth migration, it was necessary to ensure perfect coordination between the Banco de Portugal, SIBS, participating credit institutions, Interbolsa and OMIClear. A number of regulatory and operational changes were introduced into SICOI, among them the incorporation of risk management tools that had previously been part of SPGT2, and also the change in the calendar and schedule for settlements in some subsystems, to bring them into line with TARGET2. During the fi rst quarter, there was a public consultation on user requirements for the TARGET2-Securities project and on the methodology for analysing its economic impact. In light of the results from this consultation process, the Governors’ Council of the European Central Bank decided on 17 July to continue with the project and put the development in the hands of what is known as the 4CBs – the central banks of Germany, Spain, France and Italy. From this date onwards, various working groups were set up to shape business requirements and to standardise practices and procedures. In tandem, there were on-going discussions on the model to be used for governance of the project, on pricing policy and on contractual issues involving the central securities depositories and the Eurosystem.
(1) See Appendix I on development of gross settlement systems in Portugal. For the purposes of this report, the reference to SPGT2 comprises also the operating period of SPGT.
(2) TARGET2 is based on a single shared platform. At the end of 2008, it was made up of the European Central Bank and 20 national components: Austria, Belgium, Cyprus, Denmark, Estonia, Finland, France, Germany, Greece, Ireland, Italy, Latvia, Lithuania, Luxembourg, Malta, the Netherlands, Poland, Portugal, Slovenia and Spain.
(3) See Appendix III. (4) See Appendix IV.
Work continued on the SEPA project, focused on bringing about the main aim: to ensure that domestic and cross-border electronic transfers would both be charged at the same rate and be as effi cient and as safe. In terms of SEPA credit transfers, launched on 28 January 2008, a large number of institutions operating in Portugal joined. At year-end, transfers through SEPA in Portugal accounted for 1.3% of the total number of credit transfers carried out. With a view to giving a boost to the use of this instrument, the European Commission and the Eurosystem have been encouraging its adoption, in particular by public administration services.
More information on the payments systems can be found on the Banco de Portugal website at: www.bportugal.pt
The Interbank Settlement System in Portugal
As part of the Eurosystem, national central banks perform an operational role in payment systems. They act as a catalyst for development within principles of minimising systemic risks and curbing costs, while promoting high standards of safety and effi ciency. Particularly concerning the Banco de Portugal, these functions are covered by the provisions of article 14, chapter IV – Functions of the Central Bank, in the Bank’s Organic Law, approved by Law No 5/98 of 31 January, as amended by Decree-Law No 118/2001 of 17 April 2001, Decree-Law No 50/2004 of 10 March 2004 and Decree-Law No 39/2007 of 20 February 2007, where it is stated that “It is incumbent on the Bank to regulate, oversee and promote the smooth operation of payments systems, namely within the scope of its participation in the European System of Central Banks (ESCB).”
The interbank settlement system in Portugal is made up of two complementary subsystems: real-time gross settlement and clearing.5
The main aim of real-time gross settlement is to minimise the risks associated with large-value payments (systemic risk6), contributing to the smooth functioning of payment systems. The pur-pose of clearing is to process large quantities of low-value payments (with limited systemic risk) with low processing costs.
Gross settlement was carried out through the SPGT2, TARGET2-PT and the settlement system for other depositors (SLOD); interbank clearing was carried out through SICOI.
The SPGT2 is a real-time gross settlement system, managed and operated by the Banco de Portugal. It had 36 participating institutions.7
The SPGT went live on 30 September 1996 and it became one of the national components of the TARGET system on 4 January 1999. February 18, 2008 saw another important milestone in the history of the system, with Banco de Portugal migrating from TARGET to TARGET2 and with the SPGT evolving into SPGT2.8
As shown in Illustration 1, SPGT2 covered settlement on an individual basis (gross settlement) and on a netting basis (multilateral netting).
Gross settlement included:
• cross-border transfers as part of TARGET;
• money market operations contracted and processed through the Banco de Portugal electronic system for market transfers (SITEME);
• transfers ordered by other Banco de Portugal depositors for participants in the SPGT and transfers ordered for other Banco de Portugal depositors which are not participants in the SPGT, but are participants in the SLOD;
• INTERBOLSA operations where physical settlement is performed through SLrt (the real-time settlement system), including over the counter (OTC) private stock market operations;
(5) In general terms, clearing is the process of transmitting and reconciling payment orders by the recipient (Bank A) and paid by another party (Bank B), for example by cheque, credit transfer, direct debit, bill of exchange or bank card. Clearing makes it possible to obtain final net balances for settlement on the basis of individual payment orders.
(6) Systemic risk occurs when one party cannot honour a commitment and other parties are then unable to fulfill their own commitments, bringing liquidity and credit risk into a payment system and jeopardising the stability of financial markets.
(7) This includes the Banco de Portugal, which also operates as a participant.
• Banco de Portugal treasury operations;9
• Transactions equal to or more than 100 thousand euros carried out between participants in the system and those which are less than this amount but which participants choose to settle this way. The following operations were settled on a netting basis:
• those within the scope of MIBEL – the Iberian energy market (OMIClear); • balances from the Interbank Clearing System (SICOI);
• balances from the clearing system involving operations in the securities and derivatives markets of the general settlement system (SLG) of the INTERBOLSA.
Illustration 1
THE INTERBANK SETTLEMENT SYSTEM IN PORTUGAL
SPGT2/TARGET2 functions daily between 6 a.m. and 6 p.m., with this period divided into three sessions: (i) the standard period, between 6 a.m. and 4 p.m.; (ii) the interbank period, between 4 p.m. and 5 p.m., exclusively for interbank operations settlement;10 and (iii) the pre-closure period, between 5 p.m. and 6 p.m., reserved for market operations between the participating institutions and the Banco de Portugal.
SICOI is an interbank system managed by the Banco de Portugal, in accordance with the Banco de Portugal Instruction No 3/2009. This system is designed for clearing payment operations that are under 100 thousand euros, carried out with cheques, bills of exchange, direct debits, credit transfers or bank cards.
SICOI is made up of five subsystems, corresponding to the five payment instruments listed above: (i) cheques and similar documents; (ii) bills of exchange; (iii) direct debits; (iv) interbank electronic transfers (including those through the SEPA); and (v) the Multibanco.
Processing of operations is carried out through the Interbank Service Company (SIBS). Operations are sent to SICOI by participants throughout the day, up to a specific cut-off time.11 At the time fixed for closure in each subsystem, SIBS processes all operations sent and received by the participants and computes the multilateral balances involved. These balances are then sent to the SPGT2 for settlement.
Participation in this system can be direct or indirect,12 and the subsystems that have most participants are interbank electronic transfers (traditional form) and cheques. At year-end, the first of these had 37 direct participants and 19 indirect, while the second had 28 direct and 28 indirect.
Securities settlement systems13 represent an important component of payment systems, with their own norms and regulations, underpinned by principles established to control financial risk (credit, liquidity, custody and systemic). They also promote stability in financial markets, and the smooth conduct of monetary policy operations.
SITEME is the Banco de Portugal securities settlement system, and is also structured so as to foster stability in the financial markets.
Settlement of operations involving shares, bonds and other securities is made through INTERBOLSA.14
The physical settlement of operations through INTERBOLSA takes place in two systems: the general settlement system (SLG) and the real-time settlement system (SLrt). The first carries out physical settlement according to a fixed timetable; and the SLrt carries out physical settlement on an individual basis and in real time.
(10) Settlement of customer operations is not permitted in this session.
(11) This cut-off time depends on the subsystem in question and is defi ned in the system-specifi c operating handbooks.
(12) An institution can participate directly in SICOI if it takes the responsibility for fi nancial settlement of its own operations (and those carried out by other institutions that it represents). An institution takes part indirectly when it does not take responsibility for fi nancial settlement of its own operations, such settlement being ensured by the institution that represents it.
(13) See Appendix II.
(14) The full name of this company is Sociedade Gestora de Sistemas de Liquidação e de Sistemas Centralizados de Valores Mobiliários, SA. It was set up in 2000, and is the Portuguese central securities depository belonging to Euronext Lisbon.
Financial settlement of operations processed through the SLG and the SLrt is carried out by the Banco de Portugal. Following fi nancial settlement, the physical settlement is defi nitive and irrevocable.
Overall Figures for Interbank Settlement in 2008
In 2008, the gross settlement systems (SPGT2 and SLOD) processed 1.66 million operations to an approximate value of 5.6 trillion euros15 (see Table 1), equivalent to around 34 times the nominal value of GDP for the year.
The SPGT2 and SLOD were open for 256 days (as against 255 days in 2007), with a 5% rise in quantity and a 13.8% rise in value year on year.
Table 1
TRANSACTIONS THROUGH THE INTERBANK SETTLEMENT SYSTEM (Quantity in millions and value in billion euros)
2007 2008 Variation (%)
Quantity Value Quantity Value Quantity Value
Gross settlement 1.58 4,958.7 1.66 5,641.8 5.0 13.8
SPGT2(1) 1.50 4,907.3 1.57 5,597.0 4.5 14.1
SLOD 0.08 51.4 0.09 44.8 13.4 -12.8
Settlement through clearing – SICOI 1,671.70 343.6 1,750.56 353.2 4.7 2.8 (1)
Includes operations processed through TARGET2-PT.
Settlements through the SPGT2 were up by 4.5% in quantity and 14.1% in value. This was an inversion of the trend seen in recent years in terms of amounts (decreases of 5.3% in 2007 and 2.1% in 2006).
On 16 May and 24 October, the SPGT2 ran for the whole session from the Banco de Portugal’s remote disaster recovery site, with smooth payments processing.
There were 89 thousand operations settled through SLOD, corresponding to a value of 44.8 billion euros. In 2007, the corresponding values were 78 thousand and 51.4 billion euros. This translates into a 13.4% rise in quantity and a 12.8% fall in value.
SICOI was open for 250 days in 2007 and in 2008. The exceptions were the interbank electronic transfers and Multibanco subsystems: the fi rst was available for 257 days in 2007 and for 258 days in 2008; Multibanco clearing took place on 365 days in 2007 and on 366 days in 2008. There were 1,751 million operations processed through SICOI, to a total of 353 billion euros in value, continuing on its upward path (4.7% up in quantity and 2.8% in value).
Table 2 shows the change in daily averages in the interbank settlement system from 2007 to 2008, in quantity and in value. The SPGT2 processed a daily average of 6,130 operations, amounting to 21,863.4 million euros. This corresponds to a 4.1% growth in quantity and 13.6% in value year on year. In terms of operations settled through SLOD, there was a considerable drop in the average daily amount (down 13.2%), having moved from 201.7 million euros in 2007 to 175.1 million euros in 2008, though there was a 13% rise in the average quantity of operations processed.
Table 2
DAILY AVERAGES IN THE INTERBANK SETTLEMENT SYSTEM (Quantity in thousands and value in million euros)
2007 2008 Variation (%)
Quantity Value Quantity Value Quantity Value
Gross settlement(1) 6.19 19,445.9 6.48 22,038.5 4.6 13.3
SPGT2(2) 5.89 19,244.3 6.13 21,863.4 4.1 13.6
SLOD 0.31 201.7 0.35 175.1 13.0 -13.2
Settlement through clearing – SICOI(3) 4,940.10 1,278.9 5,147.79 1,305.3 4.2 2.1
(1)
In order to calculate the daily averages in the SPGT2 and SLOD, the number of days was taken as 255 in 2007 and 256 in 2008.
(2)
This includes operations processed through TARGET2-PT.
(3) The daily averages in SICOI correspond to the sum of the daily averages in its various subsystems. In order to calculate the daily averages in the subsystems for cheques, direct debits and bills of exchange, the number of days considered were the operating days of 2007 and 2008 (250). For the calculation of the daily averages in the subsystem of interbank electronic transfers, the days considered were 257 for 2007 and 258 for 2008. The Multibanco operated on 365 days in 2007 and 366 days in 2008.
In 2008, around an average of 5.1 million operations per day were settled through SICOI, corresponding to an average daily amount of 1,305.3 million euros.
In 2008, the fi ve biggest participants in the SPGT2 accounted for around 63% in quantity and 70% in value in the transactions carried out through the system (see Table 3). These concentration ratios were fundamentally stable from 2007, though there was a slight rise in concentration in terms of value (up 3.6 pp).16
The highest concentration ratio in the fi ve biggest participants is in the Multibanco and interbank electronic transfers subsystems, both in quantity (82.8% for the fi rst and 84.3% for the second in 2008) and in value (82.6% and 80.0%). As opposed to this, the cheque subsystem has the smallest ratio among the fi ve biggest participants (64.5% in quantity and 65.3% in value), evidence that the fi ve biggest participants have a more active role than the others in terms of fostering the use of electronic payment instruments.
The subsystems for cheques, direct debits and the Multibanco saw a fall in the ratio of concentra-tion from 2007 to 2008, both in quantity and in value. This stems from the fact that there was an increase in market share among the other participants.17
The concentration ratios in the SPGT2 are slightly lower than those in the other SICOI subsystems, as a result of the fact that the fi ve biggest participants have a higher overall market share in SICOI than in the SPGT2. This in turn comes fundamentally from the intense amount of activity that other participants have in the settlement of securities and monetary market operations in the SPGT2.
(16) The fi ve biggest participants in the SPGT2 in 2008 were the same as in 2007.
Table 3
CONCENTRATION RATIOS IN THE INTERBANK SETTLEMENT SYSTEM (5 biggest participants – in percentages)
2007 2008
Quantity Value Quantity Value
SPGT2(1) 63.4 66.4 63.0 70.0
SICOI(2)
Cheques 65.2 66.5 64.5 65.3
Interbank electronic transfers 84.3 79.4 84.3 80.0
Bills of exchange 75.5 76.9 75.3 76.6
Direct debits 80.2 73.2 79.5 72.8
Multibanco 83.6 83.4 82.8 82.6
(1) In order to calculate the concentration ratios in the SPGT2, the following were considered: domestic operations ordered through ancillary systems, domestic operations ordered by SPGT2 participants and cross-border operations ordered through the SPGT2.
(2)
In order to calculate the concentration ratios in the various subsystems of SICOI, the following approaches were used: for cheques, from the standpoint of the drawing bank; for direct debits, from the standpoint of the debtor’s bank; for bills of exchange, from the standpoint of the debit balance; for electronic transfers, from the standpoint of the transfers ordered; for the Multibanco, operations in Portugal and abroad with cards issued by resident credit institutions were considered, from the standpoint of the card issued.
Settlement Through SPGT2 and TARGET2-PT
As mentioned before, gross settlement in real time (SPGT2 and TARGET2-PT) increased at a rate of 4.5% in quantity and 14.1% in value year on year. This reversed the trend that had been seen in previous years, when settled amounts were down. However, there was a slowdown in the growth of volume settled, since the corresponding rate of growth was 12.2% in 2007 (see Table 4 and Chart 1). This volume growth was due to the increase on the domestic side18 (9.1%), with the cross-border operations in fact down, at 2.8% less.
In terms of amounts settled, there was a considerable rise (14.1%) compared with a year earlier, when it was down 5.3%. This was also because of the substantial rise in domestic settlements (up 30.2%) (see Table 4 and Chart 2).
Table 4
OPERATIONS SETTLED THROUGH SPGT2(1)
(Quantity in millions and value in billion euros)
Variation Variation
2007 2008 2006/2007 (%) 2007/2008 (%)
Quantity Value Quantity Value Quantity Value Quantity Value
SPGT2 1.50 4,907.3 1.57 5,597.0 12.2 -5.3 4.5 14.1
Domestic operations 0.92 1,743.3 1.01 2,269.8 17.3 16.4 9.1 30.2
Cross-border operations 0.58 3,164.0 0.56 3,327.2 4.9 -14.1 -2.8 5.2
(1) This includes operations settled through TARGET2-PT.
Chart 1
QUANTITIES OF DOMESTIC AND CROSS-BORDER OPERATIONS IN THE SPGT2
788 924 1,008 550 577 561 0 200 400 600 800 1,000 1,200 2006 2007 2008 Quantity in thousands
Domestic operations Cross-border operations
(18) Domestic operations are those with exclusive impact on the settlement accounts of participants in the Banco de Portugal (SPGT2 or SLOD); Cross-border operations are those with impact on the settlement accounts of a participant in the Banco de Portugal (SPGT2 or SLOD) and on a settlement account in a central bank in the European Union.
Chart 2
VALUES OF DOMESTIC AND CROSS-BORDER OPERATIONS IN THE SPGT2
1,497 1,743 2,270 3,685 3,164 3,327 500 1,000 1,500 2,000 2,500 3,000 3,500 4,000 2006 2007 2008 V a
lue in billion euros
Domestic operations Cross-border operations
The volume growth in domestic settlement (see Table 5) came fundamentally from the substantial rise in traffi c between the institutions participating in the SPGT2 (18.2% in quantity and 36.3% in value). This represented 40.8% of the total quantity and 56% of the total value for domestic operations, which include interbank transfers, operations undertaken by banks on behalf of their customers and operations with the Treasury. This came to a total of 411,426 transactions and 1.27 trillion euros in 2008, corresponding to an average of 3.1 million euros per operation, compared with 2.7 million a year earlier.
In terms of the amounts of domestic operations settled, the main item responsible for the growth was transfers between participants in the SPGT2 (up 36.3%). Following this came the Banco de Portugal market operations (and this includes providing/absorbing liquidity in the money markets) and then, to a lesser extent, operations from and with the Treasury.
Table 5
OVERALL MOVEMENT OF SPGT2 – DOMESTIC OPERATIONS (Quantity in units and value in million euros)
Operations from ancillary systems (1) Operations ordered by SPGT2 participants (2) Operations settled through TARGET2-PT (3) Total domestic operations
Quantity Value Quantity Value Quantity Value Quantity Value 2008
Total 594,898 997,606.3 411,426 1,270,479.3 2,104 1,707.0 1,008,428 2,269,792.5
Daily average 2,324 3,896.9 1,607 4,962.8 9 7.7 3,939 8,866.4
Average per operation - 1.7 - 3.1 - 0.8 - 2.3
As a percentage 59.0% 44.0% 40.8% 56.0% 0.2% 0.1% 100.0% 100.0%
2007
Total 576,252 810,924.5 347,988 932,328.2 n.a. n.a. 924,240 1,743,252.7
Daily average 2,260 3,180.1 1,365 3,656.2 3,624 6,836.3
Average per operation - 1.4 - 2.7 - 1.9
As a percentage 62.3% 46.5% 37.7% 53.5% 100.0% 100.0%
Annual growth rate 3.2% 23.0% 18.2% 36.3% 9.1% 30.2%
(1)
These include Interbolsa operations, from the PEXSettle system and Clearnet (stock markets), Banco de Portugal treasury operations, Banco de Portugal market operations and balances from the clearing systems and the settlement of large-value cheques, bills of exchange and direct debits (SICOI).
A breakdown of domestic operations from ancillary systems by the various business areas (see Table 6) shows that SICOI played the biggest part in the total number of operations that were settled. In 2008, it accounted for around 335 thousand operations (down 2.3% on a year earlier), representing 56.4% of the total settlements from ancillary systems (compared with 59.6% a year earlier).
In terms of value, market operations played the biggest part in settlements from ancillary systems. In 2008, these operations stood at 691.1 billion euros (up 42.3% on 2007), accounting for 69.3% of the total value (compared with 59.9% a year earlier).
Table 6
DOMESTIC OPERATIONS FROM ANCILLARY SYSTEMS (Quantity in units and value in million euros)
2007 2008 Variation (%)
Quantity Value Quantity Value Quantity Value
Markets 4,502 485,549.6 6,311 691,114.5 40.2 42.3
Treasury 21,530 27,956.1 21,082 28,332.4 -2.1 1.3
Stock exchanges 205,378 121,871.2 229,297 101,431.7 11.6 -16.8
SICOI 343,194 173,332.2 335,416 172,601.6 -2.3 -0.4
Other internal areas 1,648 2,215.4 2,792 4,126.0 69.4 86.2
Total 576,252 810,924.5 594,898 997,606.3 3.2 23.0
In 2008, around 229 thousand operations from INTERBOLSA were settled, to an amount of 101.4 billion euros, compared with a volume of 205 thousand and an amount of 121.9 billion euros in 2007.
As at 31 December, there were 38 institutions participating in SITEME, 33 of them resident and 5 non-resident. They were involved in 1,517 operations to the amount of 116.8 billion euros. The corresponding figures for 2007 were 1,510 operations to the amount of 140.5 billion euros. The variation, therefore, was 0.46% up in quantity and 16.9% down in value. In 2008, 86.6% of the operations were domestic.
The increases seen in the quantity of domestic operations over the last three years had led to a rise in their relative proportion in the total number of operations processed through the SPGT2. In 2006, domestic traffic accounted for around 59% in terms of quantity, whereas the figure for 2008 was around 64% (see Chart 3). In the same period, the value of operations increased in relative weight from 29% in 2006 to 41% in 2008 (see Chart 4).
As a result, the proportion of cross-border operations was down from around 41% in quantity and 71% in value in 2006 to 36% in quantity in 2008 (see Chart 3) and 59% in value (see Chart 4).
Chart 3
DOMESTIC AND CROSS-BORDER OPERATIONS IN THE SPGT2 (As a percentage of the number of transactions)
59% 62% 64% 41% 38% 36% 0% 10% 20% 30% 40% 50% 60% 70% 80% 90% 100% 2006 2007 2008
Domestic operations Cross-border operations
Chart 4
DOMESTIC AND CROSS-BORDER OPERATIONS IN THE SPGT2 (As a percentage of the value of transactions)
29% 36% 41% 71% 64% 59% 0% 10% 20% 30% 40% 50% 60% 70% 80% 90% 100% 2006 2007 2008
Domestic operations Cross-border operations
On 18 February, Portugal joined TARGET2, and began to process settlements through this system. During the rest of the year, 2,104 operations were settled using the new system, totalling 1,707 million euros.
The volume from the SPGT2 and TARGET2-PT to be settled through TARGET2 was 202,134 operations, with 358,922 operations received (see Tables 7 and 8). The operations sent to TARGET2 stood at 1.670 trillion euros and those received stood at 1.657 trillion euros. Seen alongside 2007, this meant a 0.9% fall in operations received in terms of quantity and a 4.7% rise in value. The corresponding rates for operations sent were 6% down in quantity and 5.6% up in value.
Among the cross-border operations sent to TARGET2 from SPGT2 and from TARGET2-PT (see Table 7), interbank transactions accounted for 55.8% of the total number of operations and 96.8% of their value, while payments by customers accounted for 44% of the quantity and
3.1% of the value, with the remainder corresponding to transfers sent by other NCBs. In this context, it should be noted that payments from customers were the only item that was down in quantity year on year (by 14.8%), though value showed the biggest rate of growth (52%). In terms of cross-border operations received, customer operations accounted for 66.5% of quantity and 3% of value, while interbank transfers stood at 33.2% in quantity and 96.9% in value (see Table 8). The remainder corresponds to payments between NCBs.
Table 7
CROSS-BORDER OPERATIONS SENT TO TARGET2 FROM SPGT2 AND FROM TARGET2-PT (Quantity in units and value in million euros)
2007 2008 Variation (%)
Quantity Value Quantity Value Quantity Value
Interbank 110,395 1,546,541.4 112,774 1,616,929.9 2.2 4.6 Customers 104,453 34,078.1 89,036 51,786.4 -14.8 52.0 Inter-NCBs 173 1,198.5 324 1,279.5 87.3 6.8 Total 215,021 1,581,818.0 202,134 1,669,995.8 -6.0 5.6 Daily average 843 6,203.2 790 6,523.4 -6.4 5.2 Table 8
CROSS-BORDER OPERATIONS RECEIVED FROM TARGET2 IN SPGT2 AND IN TARGET2-PT (Quantity in units and value in million euros)
2007 2008 Variation (%)
Quantity Value Quantity Value Quantity Value
Interbank 115,516 1,541,719.4 119,062 1,605,694.1 3.1 4.1
Customers 246,412 39,785.7 238,597 49,304.1 -3.2 23.9
Inter-NCBs 372 707.8 1,263 2,235.2 239.5 215.8
Total 362,300 1,582,212.9 358,922 1,657,233.4 -0.9 4.7
Daily average 1,421 6,204.8 1,402 6,473.6 -1.3 4.3
The SPGT2 pricing structure is based on different rates, depending on the period when domestic operations are settled. This differentiation aims at minimising systemic risk, and involves levying a charge for late settlement and thus encouraging participants to settle their operations as early as possible. The aim of the policy is to avoid bottlenecks in the fi nal hours and ensure that there is no shortage of liquidity in the early part of the following day’s session. From the information available, we can see that the fi rst six hours (between 6 o’clock in the morning till noon) processing was completed for 65.8% in terms of quantity and 64.1% in terms of value. By the end of the tenth hour, the SPGT had settled 98.9% of payments and 95% of the amounts (see Table 9).
Table 9
SPGT2 – SETTLEMENT PER OPERATING PERIOD IN 2008 (In percentages)
Domestic Cross-border Total
Quantity Value Quantity Value Quantity Value Standard period (1) 1st to 6th hours 68.7 70.1 60.6 60.0 65.8 64.1 7th to 10th hours 30.3 27.5 38.0 33.4 33.1 30.9 Interbank period 11th hour 1.0 2.3 1.4 6.6 1.1 4.9 Pre-closure period 0.0 0.1 0.0 0.0 0.0 0.1 Total 100 100 100 100 100 100 (1)
Interbank and customer transfers.
During the year, the biggest quantity of payments processed on a single operating day of SPGT2 was 29 December, which saw 10,171 operations settled (see Chart 5). The biggest value on one single day was processed on 30 December, when the figure reached 36,199.5 million euros (see Chart 6).
In 2008, the SPGT processed on average 6,131 payments per day, totalling 21,863.4 million euros. On most of the days that the SPGT2 was functioning,19 the volume of payments came in between a minimum of 5,201 payments per day20 and a maximum of 7,060 payments per day.21 On 19 days, the number of payments was above 7,060 and on 29 days it was below 5,201. In terms of values processed daily by the SPGT2 in 2008, these stood between a lower bound20 of 17,156.02 million euros and an upper bound21 of 26,570.72 million euros on 73.8% of the days when the SPGT2 system was functioning (189 days). On 27 days, values were below 17,156.02 million euros and on the remaining 40 days they were above the 26,570.72 million euro figure.
(19) It was functioning on 256 days. (20) Average less the standard deviation. (21) Average plus the standard deviation
Chart 5
SPGT2 – NUMBER OF OPERATIONS SETTLED IN 2008 (DAILY DATA) (Quantity in units)
Chart 6
SPGT2 – VALUE OF OPERATIONS SETTLED IN 2008 (DAILY DATA) (Value in million euros)
With the aims of smoothing the execution of settlement operations and avoiding defaults and/or gridlocks in the processing of operations, which could affect the overall running of the system, the Banco de Portugal allows debit positions on the settlement accounts of the participants in the SPGT. However, the negative balance on the settlement account can never exceed the limit of intraday credit on the current account, backed by collateral, this having been set down in a prior agreement with the Banco de Portugal. Given this, intraday credit has a fundamental role to play in minimising the financial risks in the system.
Table 10 sums up the information relating to intraday credit for the year, including the amount of collateral deposited by participants in the Banco de Portugal in order to obtain intraday credit and also the amount of intraday credit in fact used by the participants in the SPGT2 to carry out payments.
The data show that the intraday credit in fact used during the year was substantially below the limit set down for the credit line (on average, the collateral in fact used came to 1.8% of the collateral deposited). The maximum use of intraday credit was on 16 July, to the value of 107.4 million euros and the minimum was on 1 December, totalling 0.4 million euros.
Table 10
USE OF INTRADAY CREDIT IN SPGT2 IN 2008 (Value in million euros)
Average Maximum Minimum
Collateral deposited 1,573.4 1,780.7 1,224.0
Settlement Through TARGET2
The main settlement systems for large amounts in euros (see Table 11) in the Euro area are TARGET222 and EURO1. In 2008, 94.7 million operations were settled through TARGET2, totalling 682.8 trillion euros,23 equivalent to a daily average of some 370 thousand operations, which means 2.667 trillion euros on a daily basis. These fi gures show an increase of 1.4% in the quantity of payments and a 10.7% rise in overall value year on year. The EURO1 system processed 64.2 million operations with a value of 73.4 trillion euros. the daily average in quantity being 251 thousand operations and in value 287 billion euros. In relative terms, TARGET2 processed, on average, 50% more operations than EURO1, and the value of operations was 9.3 times higher. As TARGET2 processes around 90.3% of settlements, it commands a leading position. But when it comes to quantities, TARGET2 is not so dominant, as it processes just 59.6% of operations. Comparing with 2007, TARGET2 lose ground to EURO1, with a drop of 3.8 pp in quantities and 1.1 pp in settlements.
As with Portugal, since 2002 TARGET2 has processed more domestic than cross-border payments. This year, in terms of quantity, cross-border payments accounted for 26.9% of total traffi c for TARGET2, and 31.7% of value.
Table 11
PAYMENT INSTRUCTIONS PROCESSED THROUGH TARGET2 AND EURO1 (Quantity in millions and value in trillion euros)
2006 2007 2008
Quantity Value Quantity Value Quantity Value
TARGET2(1) 83.2 533.5 93.4 616.9 94.7 682.8 Domestic 64.2 348.8 72.6 395.4 69.2 466.6 Cross-border 19.0 184.8 20.8 221.4 25.5 216.2 EURO 1 47.7 48.2 53.9 58.2 64.2 73.4 TARGET2/EURO 1 1.7 11.1 1.7 10.6 1.5 9.3 Total 130.9 581.8 147.2 675.1 158.9 756.2 Daily average: TARGET2 0.326 2.092 0.366 2.419 0.370 2.667 EURO 1 0.187 0.189 0.211 0.228 0.251 0.287 (1)
This includes operations processed through TARGET (see Appendix I on the change from TARGET to TARGET2).
(22) TARGET2 is based on a Single Shared Platform and, by the end of the year, it was made up of the ECB system and 20 national components as follows: Austria, Belgium, Cyprus, Germany, Denmark, Estonia, Spain, Finland, France, Greece, Ireland, Italy, Lithuania, Luxembourg, Latvia, Malta, the Netherlands, Poland, Portugal and Slovenia.
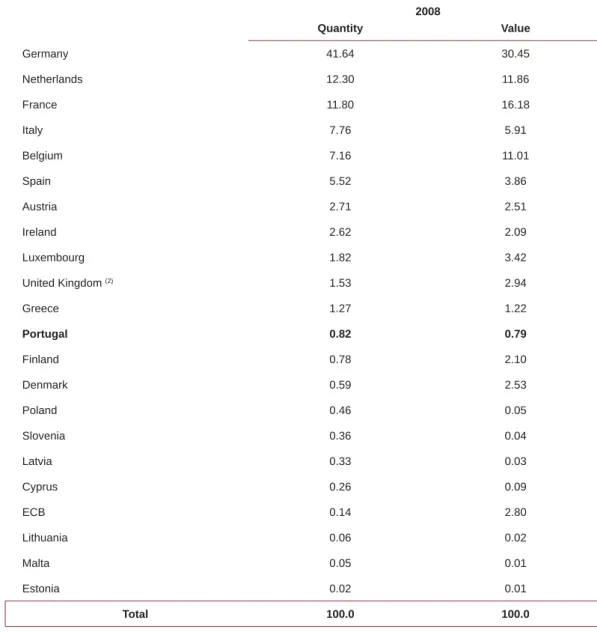
Table 12 gives a breakdown of the overall total of cross-border payment instructions sent through the TARGET2 this year by the different national components. The Portuguese component accounted for 0.8% in quantity and value. This represents a 0.2 pp drop in quantity and a 0.1 pp increase in the value settled year on year.
TARGET2 operations are closely linked to a small number of national banking communities, both in terms of quantity and value. For example, Germany, the Netherlands, France, Italy and Belgium made up 80.7% of the total payment instructions sent and 75.5% of value; and one single banking community (Germany) accounts for 41.6% of the volume of payments sent and 30.5% of value.
Table 12
PAYMENT INSTRUCTIONS SENT BY NATIONAL COMPONENTS IN TARGET2 IN 2008(1)
(In percentages) 2008 Quantity Value Germany 41.64 30.45 Netherlands 12.30 11.86 France 11.80 16.18 Italy 7.76 5.91 Belgium 7.16 11.01 Spain 5.52 3.86 Austria 2.71 2.51 Ireland 2.62 2.09 Luxembourg 1.82 3.42 United Kingdom (2) 1.53 2.94 Greece 1.27 1.22 Portugal 0.82 0.79 Finland 0.78 2.10 Denmark 0.59 2.53 Poland 0.46 0.05 Slovenia 0.36 0.04 Latvia 0.33 0.03 Cyprus 0.26 0.09 ECB 0.14 2.80 Lithuania 0.06 0.02 Malta 0.05 0.01 Estonia 0.02 0.01 Total 100.0 100.0
Source: TARGET and ECB Statistics. (1)
This includes operations processed through TARGET.
(2) The Bank of England decided to take its system (CHAPS Euro) out of TARGET as and from 16 May 2008 (the last day of the fi rst generation of the TARGET system).
Settlement through Interbank Clearinga
SICOI saw a 4.7% rise in quantity in 2008 and a 2.8% rise in value, corresponding to a total of 1,750.6 million operations with a value of 353.2 billion euros (see Table 13). The daily average stood higher, at 5,148 million operations with a value of 1,305 billion euros.
Table 13
OVERALL MOVEMENT THROUGH SICOI (Quantity in millions and value in billion euros)
2007 2008 Variation (%)
Quantity Value Quantity Value Quantity Value
Total 1,671.7 343.7 1,750.6 353.2 4.7 2.8
Cheques 141.2 174.3 126.5 162.0 -10.4 -7.1
Bills of exchange 0.4 2.2 0.3 2.1 -15.2 -7.6
Interbank electronic transfers 62.9 87.6 70.4 100.9 12.1 15.3
Direct debits 86.7 11.2 97.4 13.2 12.4 18.1
Multibanco 1,380.5 68.4 1,455.9 75.0 5.5 9.7
Daily average 4.940 1.279 5.148 1.305 4.2 2.1
Memo:
Interbank electronic transfers
– traditional form 62.9 87.6 70.3 100.3 11.9 14.5
Interbank electronic transfers
through the SEPA - - 0.11 0.6 -
-The increases seen at SICOI stem from the increased use of electronic payment instruments both in quantity and value. Interbank electronic transfers rose 12.1% in quantity and 15.3% in value, and direct debits were up 12.4% in quantity and 18.1% in value. The Multibanco saw moderate variations of 5.5% in quantity and 9.7% in value.
On the other hand, paper-based payment instruments saw a drop in quantity (down 10.4% for cheques and 15.2% for bills of exchange) and in value (down 7.1% for cheques and 7.6% for bills of exchange). However, the average value of each operation using these instruments (see Table 14) continues to rise but at a rate slower than that of 2007: 3.8% for cheques (as opposed to 8.1%) and 8.9% for bills of exchange (as opposed to 13.8%).
The Multibanco remains the payment subsystem with the lowest value per operation (51.5 euros this year) and can therefore be seen as a real retail system, distinct from the others. The average value of direct debit operations rose during the year by 5.1% to 135.3 euros.
Table 14
AVERAGE AMOUNT OF PAYMENT PER INSTRUMENT (In euros)
2007 2008 Variation (%)
2006/2007 2007/2008
Cheques 1,234.5 1,281.1 8.1 3.8
Bills of exchange 6,018.2 6,552.8 13.8 8.9
Interbank electronic transfers 1,393.0 1,432.9 3.0 2.9
Direct Debits 128.7 135.3 1.2 5.1
Multibanco 49.5 51.5 4.8 4.1
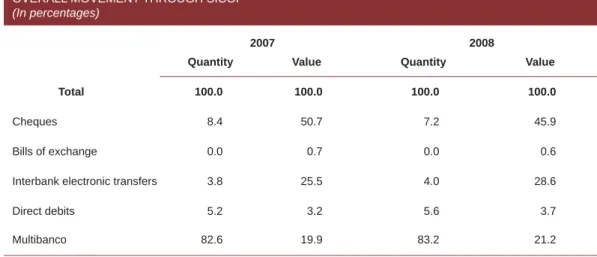
Considering only cleared operations,24 the share of payment operations using electronic instruments is up from 91.5% in quantity to 92.8%, and up from 48.6% in value to 53.5% (see Table 15). This means that in 2008, for the very fi rst time, electronic instruments accounted for more than half the number of payments settled by clearing. The cheque, as the main paper-based instrument, has dropped below 50% of all the values going through the clearing process, also for the fi rst time ever.
Table 15
OVERALL MOVEMENT THROUGH SICOI (In percentages)
2007 2008
Quantity Value Quantity Value
Total 100.0 100.0 100.0 100.0
Cheques 8.4 50.7 7.2 45.9
Bills of exchange 0.0 0.7 0.0 0.6
Interbank electronic transfers 3.8 25.5 4.0 28.6
Direct debits 5.2 3.2 5.6 3.7
Multibanco 82.6 19.9 83.2 21.2
Table 16 shows the changes over the past 20 years in the use of payment instruments in Portugal. The data and statistics used to prepare this table include not only operations cleared through SICOI, but also those undertaken in-house at each credit institution. These relate to each individual bank’s customers and do not therefore have to go through the clearing process.
(24) In general terms, clearing is the process of transmitting and reconciling payment orders by the recipient (Bank A) and paid by another party (Bank B), for example by cheque, credit transfer, direct debit, bill of exchange or bank card. Clearing makes it possible to obtain fi nal net balances for settlement on the basis of individual payment orders.
There is a substantial change in the pattern of use of payment instruments over this period: (i) Over the past 19 years, the use of payment instruments, excluding bank notes and coins,
rose by an average of 9.7% a year, with the biggest rise seen in the use of cards (28.5%) and a drop in the use of cheques (down 0.6%).
(ii) Over the period 1998-2008, the average annual growth was 7.2%, with an increase of 11% in the use of payment cards, 11.2% in direct debits, 11.7% in credit transfers, and a drop of 3.9% in the use of cheques.
(iii) In 1989, the system was fundamentally paper-based: cheques accounted for 80.6% of the number of operations settled that year; in 2008, they accounted for just 12.4%.
(iv) Over the same period, payments using payment cards rose from 3.2% to 64.1%.
(v) In 1989, the use of direct debit (then in its initial phase) accounted for 4.7% of payments, but this had risen to 13.7% by 2008.
Table 16
USE OF PAYMENT INSTRUMENTS IN PORTUGAL (Quantity in millions and percentages)
1989 1998 2008
Quantity As a % Quantity As a % Quantity As a %
Cheques 194.1 80.6 258.8 37.2 173.3 12.4
Payment cards(1) 7.6 3.2 315.8 45.5 893.6 64.1
Credit transfers 27.6 11.5 45.1 6.5 136.2 9.8
Direct debits 11.4 4.7 66.1 9.5 190.7 13.7
Others(2) 0.0 0.0 9.0 1.3 0.9 0.1
(1) The fi gure for payment cards does not include cash withdrawals. (2) Includes Bills of Exchange and the Multibanco Electronic Purse.
VII.2. Bills of Exchange
VII.3. Interbank Electronic Transfers VII.4. Direct Debits
Payment Instruments in Clearing and Settlement Systems
VII.1. ChequesOver the year, the number of cheques processed through clearing was 126.5 million, with an overall value of 162 billion euros, a drop of 10.4% in quantity and 7.1% in value year on year. Cheques remain the major payment instrument in terms of value, accounting for approximately 46% of total clearing through SICOI during the year (see Table 17).
In addition to cheques going through the clearing process, there are large-value cheques (that is, cheques of a value equal to or above 100 thousand euros). This year, the SPGT2 settled directly more than 278 thousand large-value cheques, with a total value of 109.7 million euros (see Table 18). When compared to last year, these fi gures represent a drop of 5.7% in quantity and 4.8% in value. It can therefore be seen that the overall use of cheques (for clearing and large-value cheques) saw a signifi cant drop in use from 2007 to 2008 (see Table 19) more in terms of quantity (down 10.4%) than in value (down 6.2%). Consequently, the average value of cheques rose between 2007 and 2008, up from 1,234.5 euros to 1,281.1 euros for cleared cheques and up from 389.9 thousand euros to 393.5 thousand euros for large-value cheques.
Table 17
CHEQUES CLEARED
(Quantity in millions and value in million euros)
2007 2008 Variation (%)
Quantity Value Quantity Value Quantity Value
Cheques 141.22 174,326.8 126.48 162,031.5 -10.4 -7.1
Daily average 0.56 697.3 0.51 648.1 -10.4 -7.1
Average value (in euros) - 1,234.5 - 1,281.1 - 3.8
Table 18
LARGE-VALUE CHEQUES
(Quantity in thousands and value in million euros)
2007 2008 Variation (%)
Quantity Value Quantity Value Quantity Value
Cheques 295.61 115,261.5 278.71 109,672.3 -5.7 -4.8
Daily average 1.18 461.0 1.12 438.7 -5.7 -4.8
Average value (in euros) - 389,917.3 - 393,495.3 - 0.9
Table 19
CLEARED AND LARGE-VALUE CHEQUES (Quantity in millions and value in million euros)
2007 2008 Variation (%)
Quantity Value Quantity Value Quantity Value
Cheques 141.51 289,588.7 126.76 271,703.8 -10.4 -6.2
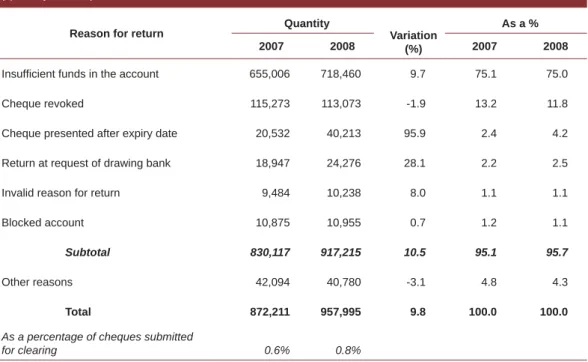
Table 20 details the changes seen in returned cheques, broken down to show the main reasons for cheques being returned.25 From this we can conclude: (i) in total, and in absolute terms, returned cheques rose by 9.8% from 2007 to 2008; (ii) cheques returned due to “lack of or insuffi cient funds” rose 9.7%, remaining this the main reason for cheques being returned, corresponding to 75% of all returned cheques in 2008; (iii) the second main reason for cheques being returned remains “cheques revoked” with 113,073 returns, corresponding to 11.8% of all returns.26 “Cheques submitted after expiry date” accounted for 40,213 returns, corresponding to 4.2% of all returns.
Table 20
CHEQUES RETURNED AS PER REASON FOR RETURN(1)
(Quantity in units)
Reason for return Quantity Variation (%)
As a %
2007 2008 2007 2008
Insuffi cient funds in the account 655,006 718,460 9.7 75.1 75.0
Cheque revoked 115,273 113,073 -1.9 13.2 11.8
Cheque presented after expiry date 20,532 40,213 95.9 2.4 4.2
Return at request of drawing bank 18,947 24,276 28.1 2.2 2.5
Invalid reason for return 9,484 10,238 8.0 1.1 1.1
Blocked account 10,875 10,955 0.7 1.2 1.1
Subtotal 830,117 917,215 10.5 95.1 95.7
Other reasons 42,094 40,780 -3.1 4.8 4.3
Total 872,211 957,995 9.8 100.0 100.0
As a percentage of cheques submitted
for clearing 0.6% 0.8%
(1) This includes large-value cheques, that is, cheques with a value equal to or more than 100 thousand euros.
VII.2. Bills of Exchange
The number of bills of exchange submitted for clearing has been dropping in recent years. In 2008, this subsystem processed just 316.85 million operations with a value of 2,076.2 million euros. This means that, when compared to 2007, the quantity of bills of exchange processed has dropped 15.2% and the value has dropped 7.6% (see Table 21). On the other hand, large-value bills of exchange (with a value equal to or above 100 thousand euros) were up 6.4% in quantity and 7.6% in value (see Table 22).
A breakdown of bills of exchange by type of operation settled shows the following changes: (i) “Drafts” account for 84.9% of the total for the year (85.4% in 2007); (ii) “Rent receipts” account for 13% of the total number and 0.3% of their value; (iii) the total amount dropped in terms of quantity, with the exception of “Drafts not accepted”, this category being up by 7.6%.
(25) Appendix VII: Statistics gives an exhaustive breakdown of reasons for cheques being returned.
(26) Over the year, there was a drop in the number of cheques revoked (down 1.9%), though returns were up by 9.8%. A contributory factor was almost certainly the recommendation issued by the Banco de Portugal (circular no. 44/2007/DPG of 13/12/2007) on best practices in relation to “cheques that have been stolen, misappropriated, or fraudulently used” and “abuse of revoked cheques”).
Table 21
BILLS OF EXCHANGE CLEARED, BROKEN DOWN BY TYPE (Quantity in thousands and value in million euros)
2007 2008 Variation (%)
Structure % Quantity Quantity Value Quantity Value Quantity Value 2007 2008 Bills of exchange 373.48 2,247.7 316.85 2,076.2 -15.2 -7.6 100.0 100.0
Drafts 319.03 2,141.6 268.89 1,963.5 -15.7 -8.3 85.4 84.9
Rent receipts 48.10 8.0 41.21 7.0 -14.3 -12.5 12.9 13.0
Draft not accepted 5.94 97.5 6.40 105.2 7.6 7.9 1.6 2.0
Receipts 0.41 0.6 0.35 0.6 -14.7 2.4 0.1 0.1
Daily average 1.49 9.0 1.27 8.3 -15.2 -7.6 -
-Average value (in euros) - 6,018.2 - 6,552.8 - 8.9 -
-Table 22
LARGE-VALUE BILLS OF EXCHANGE (Quantity in units and value in million euros)
2007 2008 Variation (%)
Quantity Value Quantity Value Quantity Value
Bills of exchange 1,730 296.2 1,840 318.7 6.4 7.6
Daily average 7 1.2 7 1.3 6.4 7.6
Average value (in euros) - 171,225.6 - 173,224.0 - 1.2
VII.3. Interbank Electronic Transfers
In 2008, the interbank electronic transfers subsystem, including TEI-SEPA,27 processed 70.4 million transactions, with a value of 100,923 million euros, a rise of 12.1% in quantity and 15.3% in value (see Table 23). Operations returned stood at approximately 75 thousand, with a value of 97.3 million euros, a rise of 14.7% in quantity and 43.4% in value. However, the overall impact of the total number of returned transfers in interbank electronic transfers is still relatively small (0.1%), due to high standards of reliability and security.
Table 23
INTERBANK ELECTRONIC TRANSFERS CLEARED(1)
(Quantity in thousands and value in million euros)
2007 2008 Variation (%)
Quantity Value Quantity Value Quantity Value
Interbank Electronic Transfers 62.90 87,562.0 70.43 100,923.3 12.1 15.3 Traditional form 62.90 87,562.0 70.32 100,282.4 11.9 14.5 Through SEPA (2) - - 0.11 640.8 - -Returned 0.07 67.8 0.08 97.3 14.7 43.4 Daily average 0.25 340.7 0.27 391.2 11.6 14.8
Average value (in euros) - 1,393.0 - 1,432.9 - 2.9
(1) This does not include credit transfers for customers settled directly through the SPGT2. (2)
This does not include SEPA transfers settled through the EBA.
Large-value credit transfers also showed a signifi cant increase between 2007 and 2008, coming in at 14% in quantity and 13.4% in value (see Table 24). This year, 173 thousand large-value credit transfers were settled (with a value equal to or above 100 thousand euros), with a total value of 350.6 billion euros. The daily average number of large-value transfers processed went from 591 in 2007 to 671 in 2008, and the value rose from 1,202.5 million euros to 1,358.8 million euros respectively. However, the average value of large-value credit transfers was down slightly (-0.5%).
Table 24
LARGE-VALUE CREDIT TRANSFERS
(Quantity in thousands and value in million euros)
2007 2008 Variation (%)
Quantity Value Quantity Value Quantity Value
Credit transfers 151.90 309,033.0 173.15 350,560.3 14.0 13.4
Daily average 0.59 1,202.5 0.67 1,358.8 13.5 13.0
Average value (in euros) - 2,034,396.4 - 2,024,651.4 - -0.5
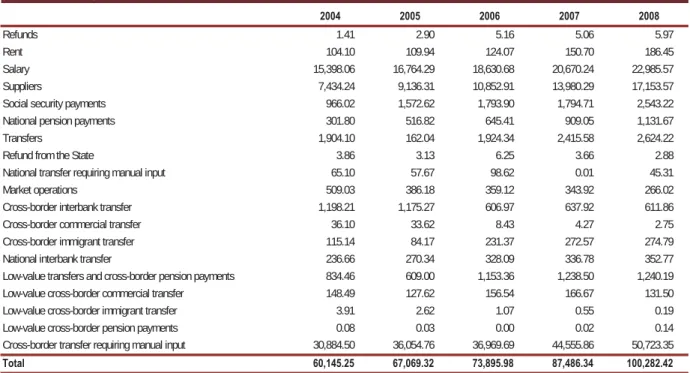
Concerning the classifi cation of interbank electronic transfers – traditional form by operation code (see Table 25), the sum of undifferentiated transfers, salary payments and social security payments is 85.7% of the total number of transfers made. Payments made to suppliers are of a higher value on average, as is to be expected. These payments make up just 7.3% of the total number of transfers yet account for 17.1% of the total value.
Table 25
INTERBANK ELECTRONIC TRANSFERS PER OPERATION CODE IN 2008 – TRADITIONAL FORM(1)
(In percentages)
Operation code Presented Returned
Quantity Value Quantity Value
Salaries 29.4 22.9 7.2 4.3
Payments to social security 14.7 2.5 24.1 4.7
Suppliers 7.3 17.1 3.9 8.9
Pensions (domestic) 2.2 1.1 0.7 0.9
Transfer of pensions (cross-border) 0.6 1.2 0.8 0.2
Subtotal 54.2 44.9 36.6 18.9
Others(2) 45.8 55.1 63.4 81.1
Total 100.0 100.0 100.0 100.0
(1)
This does not include large-value credit transfers nor interbank electronic transfers – through SEPA. (2)
This includes non-coded transfers.
VII.4. Direct Debits
The Direct Debits subsystem still has the best potential for growth, this year showing the biggest jump in quantity and value, up 12.4% and 18.1% respectively (see Table 26).28 This subsystem settled 97.4 million transactions through the clearing process, to a value of 13,184.9 million euros. This corresponds to a daily average of 390 thousand operations with a value of 52.7 million euros. Large-value direct debits showed an even more impressive growth, up 31.5% in quantity and 36.9% in value (see Table 27). In 2008, 5 thousand direct debits at a value equal to or above 100 thousand euros were settled, with an overall value of 1,336.9 million euros. On average this year, 20 large-value direct debits were processed on a daily basis through the SPGT2 (on the days it was functioning) with a value of 5.3 million euros. The average value of large-value direct debits was up 4.1% when compared to last year’s fi gures, from 259.9 thousand euros to 270.5 thousand euros.
Table 26
DIRECT DEBITS CLEARED
(Quantity in thousands and value in million euros)
2007 2008 Variation (%)
Quantity Value Quantity Value Quantity Value
Direct debits 86,726.81 11,160.9 97,441.68 13,184.9 12.4 18.1
Daily average 346.91 44.6 389.77 52.7 12.4 18.1
Average value (in euros) - 128.7 - 135.3 - 5.1
Table 27
LARGE-VALUE DIRECT DEBITS
(Quantity in units and value in million euros)
2007 2008 Variation (%)
Quantity Value Quantity Value Quantity Value
Direct debits 3,758 976.9 4,943 1,336.9 31.5 36.9
Daily average 15 3.9 20 5.3 31.5 36.9
Average value (in euros) - 259,939 - 270,472 - 4.1
Table 28 shows that most direct debit operations are undifferentiated payment requests; payments to electricity providers; and payments linked to various kinds of insurance. As a whole, these operations account for 74.5% of all instructions sent and 88.3% of the overall amount. There are other operations that also fi gure prominently, among them payment requests related to CLIP – “Cliente Primeiro” (First customer - linked to telephone services provision) and the supply of gas.
Table 28
INSTRUCTIONS FOR DIRECT DEBITS PER OPERATION CODE(1)
(In percentages)
Operation code Variation 2007/2008 Structure 2008
Quantity Value Quantity Value
Electricity 1.5 10.7 28.7 20.3
Diverse insurance 26.6 41.7 10.6 5.4
CLIP – “Cliente Primeiro” -9.8 -10.8 9.6 2.7
Gas 208.9 243.6 3.4 1.4
Sundry services 54.3 52.8 3.4 4.5
Terrestrial public services 25.7 1.1 3.0 2.0
Water 71.1 43.4 2.9 0.4 Water / Drainage 44.9 35.2 1.6 0.2 Fees 26.1 33.9 1.6 0.5 Subtotal 13.6 19.6 64.8 37.4 Others (2) 10.0 19.5 35.2 62.6 Total 12.3 19.5 100.0 100.0
(1) Includes large-value direct debits. (2)
VII.5. Multibanco
The Multibanco is a shared network of Automated Teller Machines (ATM) and Automatic Payment Terminals at Point of Sale that started working in September 1985, with the provision of 12 automated tellers in the cities of Lisbon and Oporto.
At the end of 2008, there were 13,391 ATMs and around 202 thousand point of sales terminals in Multibanco network, which corresponds to an increase of 7% and 14.6% respectively, when compared with last year’s fi gures (see Table 29).
At the end of the year, there were 19.8 million cards in use and recognised in the Multibanco network (8.7 million credit cards and 11 million debit cards). The rate of growth of cards in use29 was 8.7% this year, up on 2007 (3%).
Payment cards showed a growth of 19.3% in credit cards and 1.6% in debit cards. The fi gure for debit cards follows a trend already seen in recent years of signifi cantly slower growth. This refl ects almost complete market saturation, given that this is a payment instrument that most Portuguese citizens have access to and is in wide use.
Table 29
MULTIBANCO CARDS AND TERMINALS (Quantity in units) 2007 2008 Annual growth rate (%) Cards in use (1) 18,178,388 19,767,925 8.7 Debit cards 10,854,984 11,029,146 1.6 Credit cards 7,323,404 8,738,779 19.3 Number of terminals 189,084 215,786 14.1 ATMs 12,510 13,391 7.0 Point of sale 176,574 202,395 14.6
(1) The breakdown of cards in use into debit and credit is based on the classifi cation given by the issuing bank bearing in mind the type of account linked to the card. Some credit cards also act as debit cards.
The Multibanco is the retail payment subsystem with the highest number of operations processed. This year, it accounted for 83% of operations processed through SICOI, corresponding to 1,455.9 million transactions, yet it represents just 21% of the overall value (75 billion euros).
Multibanco operations still show impressive growth. When compared to last year’s fi gures, there was an increase in quantity and value of 5.5% and 9.7% respectively (see Table 30).