Content
Preface
From the Editors’ Desk
1. Shed Light on your ‘RTS’: Driving Optimization through 05 Financial Transparency
2. Outsourcing Trends in IT Optimization: 13
A Survey-based Article
3. IT Optimization: Roadmap to Cost Reduction 19
4. IT Optimization Driven by Information Lifecycle 31 Management (ILM) Program: A Case Study
5. Post-Merger Optimization: Defining a Roadmap to Success 43
6. IT Optimization on the Cutting Edge: Opportunities via 49 Joint IP Creation and Divestment of IP Assets
7. Tapping into Saas and Pre-packaged Models to 57
Drive Optimization
8. Virtualization: A Cornerstone of Infrastructure Optimization 67 9. UoW Model: Optimization through Innovative Pricing 77 10. Effective IT Optimization by Process Optimization 85
Perspectives on IT Optimization
IT Optimization Models and Techniques 0 0 0 0 0 0 0 0 1
it optimization
09
Sunil Kumar Sharma Senior Project Manager Infosys Technologies Limited
Surendra Kumar Sitani Project Manager Infosys Technologies Limited
Every Information Technology (IT) organization is focused on optimizing and aligning the IT budget. The goal is to improve the level of predictability, flexibility, and scalability in the operating model. One of the simplest ways to do this is to price per unit of IT service delivered. This unit could be an incident, a ticket, or an application, depending on the line of business (LOB) and the service being offered. The bottom line is that cost is aligned to service consumption.
Unit of Work (UoW) based models provide this leverage for IT organizations delivering demand centric services. The model also offers greater granularity and transparency into consumption patterns of end-users; information which can potentially transform the IT optimization efforts of an IT organization. This article breaks down the UoW model, its impact on IT cost optimization efforts, and a potential roadmap for UoW implementation.
UoW Model:
Optimization through
Innovative Pricing
Introduction
IT cost optimization is receiving a considerable amount of well deserved attention, primarily for two reasons. First, there is a good portion of IT spending that is based on capacity and does not always get aligned to actual demand. Second, this has a cascading effect on IT initiatives as more and more IT programs are scrapped due to budgetary constraints. While programs get scrapped, an increasingly frustrated industry's perception is that IT pricing is not aligned to business cycles. Organizations are demanding that existing capacity-based and time and material models align to business
cycles. IT organizations prefer to pay on-demand rather than for capacity. As such, a lot of fixed cost is being modeled into variable cost and aligned to the business demand cycle. Many innovative models are stemming from this trend:
?Virtualization
?SAAS-based models for application service
providers
?UoW- Based Model
?Business outcome-based models
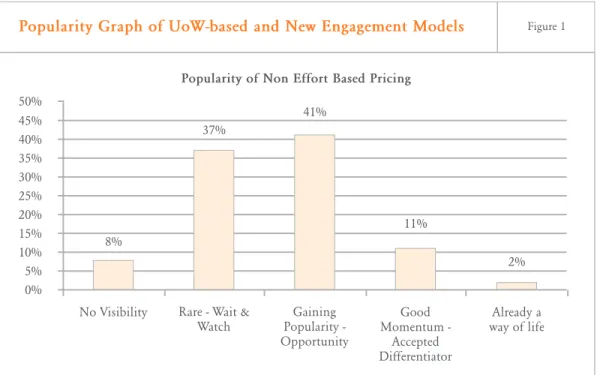
The graph shows that there is increasing willingness to adopt UoW and other non effort-based models for IT services engagement.
In this article, we will describe the UoW models, analyze their impact on IT cost optimization efforts, and present a roadmap to adoption of this model.
The primary feature of the UoW model is that demand, supply, and chargeback are done on the basis of pre-agreed and defined units of work.
Some common UoW models:
?Transaction-based: Based on the number
of transactions supported
?Ticket-based: Based on the number of
tickets resolved
?Device-based: Device based pricing is a
model in which the pricing is a direct function of the volume of devices maintained/supported by the IT Services Provider
?Test Case-based: Based on the number of
test cases executed
?Work Packet-based: For development of
large programs, different types of programs can be defined as equivalents of defined units
Components of a UoW model
The following are key components for a UoW engagement:
?Definition of units: Both parties need to
agree on what constitutes a unit of work.
?Minimum Committed volume: Since
the cost structures are a complex mix of fixed and variable costs, for a viable UoW engagement there has to be a minimum committed volume for baselining the pricing parameters.
?Slab-based pricing structure: UoW
pricing is associated with slab based pricing - for different volume slabs unit pricing could be different.
?Demand Management: A strong joint
demand management framework is a key ingredient for UoW engagements.
The first step when implementing a UoW model is to choose the right unit for the engagement. Table 1 summarizes the different types of units for different types of engagements.
This is usually a joint activity, involving teams from the IT organization and the
How UoW Works
Popularity Graph of UoW-based and New Engagement Models Figure 1
Popularity of Non Effort Based Pricing 50% 45% 40% 35% 30% 25% 20% 15% 10% 5% 0% 8% 37% 41% 11% 2%
No Visibility Rare - Wait & Watch Gaining Popularity - Opportunity Good Momentum - Accepted Differentiator Already a way of life 78
service provider. Once a unit (or units) is selected, a price per unit can be derived from historical data. Other parameters that need to be defined are minimum commitment and projected volume. The minimum volume commitment has to be high enough to enable the service provider to recover fixed costs at a reasonable price per unit. Historical data is, again, very useful for arriving at fair numbers. However, in the absence of historical data, one of two methods can be adopted
?Start engagement on a Time & Material
(T&M) basis, and over a 6 month period move to UoW model after sufficient data collection and analysis
?Base the UoW pricing on Time and
Materials (T&M) estimates and refine the model over time with data collection If the maturity/stability of the application being outsourced is high then the second option can be adopted; else the first option is safe. Once these key parameters are defined then Service Level Agreements (SLAs) can be framed for the work.
To govern the UoW model, a demand management framework needs to be adopted and should be jointly managed by both teams. In case of a multi-vendor scenario, an operation level non-binding agreement (OLA) between vendors is
recommended to ensure that the final SLA can be met.
Traditionally, two pricing models have been very popular for software services - T&M and Fixed Price (FP).
In the case of a FP model, the entire risk of the project's success is transferred to the service provider. When scope and project success criterion can be reasonably defined, then FP is normally preferred.
However, in more uncertain situations which require more flexibility with regards to scope and success criterion, the T&M model is often preferred. In this case, the entire ownership of managing delivery falls to the IT organization. The service provider is just a skill and headcount supplier and not a delivery owner. The IT organization has ownership of estimating demand, as well as defining the skills and number of resources required.
The UoW model fills this gap and provides an intermediate option in situations where use of a fixed price model is not viable. Here, service providers take ownership of meeting SLAs. The IT organization does lose some flexibility of scope definition due to minimum commitments. However, a large amount of flexibility is retained in defining the scope. This model is aligned to
Traditional Models vs. UoW Model
Engagement Type vs Unit Table 1
Engagement Type Typical Unit For Production Support and
Maintenance Project Ticket, Transaction, Devices, Sites, Users Message Implementation Work Packet, Interfaces, Sites
Development Pages, Sites, Components, Users, Transactions, Interfaces, Programmes, Scripts, Messages, Services
the demand cycle, and the service provider has responsibility for finding the right tools and skills to meet the demand.
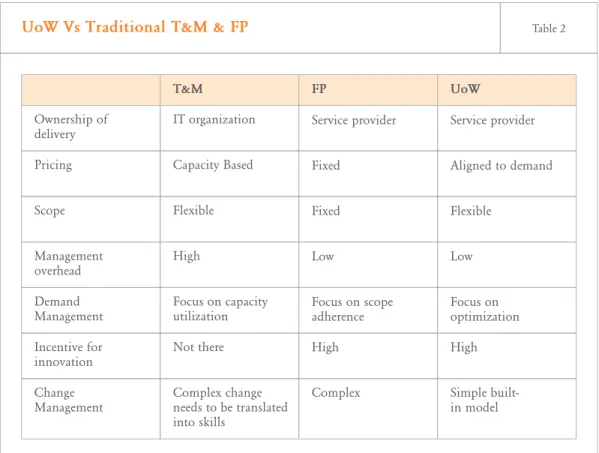
Table 2 below summarizes the key differences between these models.
Cost efficiencies in UoW model arise from: 1. Reduced overhead in comparison to the
T&M model
2. Chargeback is based on aligning demand so no excess cost is maintaining excess capacity
3. Since demand projections have to be unitized, this leads to efficient demand management and optimal demand
4. Better cost visibility from different business sub processes
5. Catalyzes micro-innovation at business sub process level due to increased transparency into the cost of IT services from different processes
6. Service providers ready to commit to extra savings as this gives them flexibility in skill deployment
7. Once the model is mature, extra savings are realized due to innovative solutions from service providers. Pricing is very aggressive for portfolios where the UoW model is already working
UoW models have great potential to optimize costs for the short and long terms. In a UoW engagement, it is possible to make cost data available at a granular level. A level which business users can relate to and can, to a certain extent, self-optimize demand. In addition, wherever some anomaly is visible (in terms of higher IT consumption), they can engage with IT easily to look for better and more efficient solutions. Contrast this to the FP and T&M models, where the business user has no way of knowing how much their demand is costing.
UoW Vs Traditional T&M & FP Table 2
Service provider Service provider IT organization
Fixed Aligned to demand Pricing Capacity Based
Fixed Flexible Scope Flexible Low Low Management overhead High Focus on scope adherence Focus on optimization Demand Management Focus on capacity utilization High High Incentive for innovation Not there
Complex Simple built-in model Change Management Complex change needs to be translated into skills Ownership of delivery T&M FP UoW 80
What IT Organizations Should Look
For in UoW
Roadmap to UoW
The UoW model has very high applicability, and, like T&M, it can apply in any scenario for any kind of application. In IT services, because of higher levels of abstraction, new models have been somewhat slow to get adopted. However, the UoW model has been the fastest to grow and now commands more than 80% of revenue share among deals based on new models.
The fundamental question is; Which segments of work can be moved to a UoW engagement? The following are key features which signal fitment to a UoW model:
1. High volume of work 2. Fluctuation in demand 3. Modular sourcing strategy 4. Availability of historical data 5. Focus on IT alignment to business 6. A drive to reduce IT overheads
7. Ability to adopt a SLA-driven delivery approach
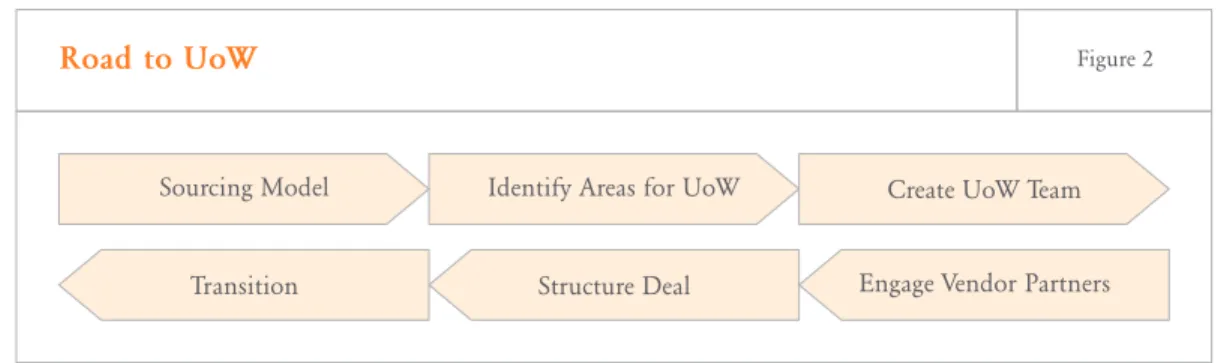
UoW models have been receiving significant cursory interest. Often, the first reaction is that there is not enough data and demand management looks very difficult. However, a structured roadmap ensures a smooth shift to UoW and a faster realization of benefits. Figure 2 outlines the UoW roadmap.
Road to UoW Figure 2
Identify Areas for UoW Create UoW Team Sourcing Model
Transition Structure Deal Engage Vendor Partners
Step 1 " Review and Revamp Sourcing
Structure
A modular sourcing structure is very crucial to the success of a UoW engagement, as is clear ownership of portfolios. This ensures uniform quality of data as well as sufficient volume to move to a UoW model. Recently, many financial services organizations have restructured their sourcing model to reap better efficiencies-moving to UoW engagements during restructuring.
Step 2 " Identifying the Areas for UoW
Model
Once the right sourcing strategy is conceived, a thorough review of the portfolio is required to identify which areas can be bundled together and what units can be used for a UoW engagement. Large portfolios of maintenance and support work are typically the first to move to a UoW model. The key identification criterion is repetitive demand.
Step 3 " Create Team and Framework for
Demand Management
The core part of a UoW engagement is demand management. A core team needs to be formed to develop key components of demand management. Some key decisions to be made are:
?Roles and responsibilities for IT
Organization and service provider teams in demand management
?Historical data analysis and data
collection mechanisms
?Minimum volume commitment
?Cycle for demand forecasting
?Quantify target goals for optimization
Figure 4 highlights demand management at different checkpoints.
?The weekly demand checkpoint is mainly
used to track consumption
?The monthly review is used to forecast
usage
?The quarterly one is used to ensure that
the project, as a whole, is on track and to adjust any commitments/assumptions
Step 4 " Engage with Strategic Service
Providers and Evaluate Options
After setting up a basic team to focus on
UoW, an IT Organization's next step is to engage with strategic service providers and evaluate options:
?Areas which can move to UoW model
?Constraints and timelines
?Units that can be adopted for various
portfolios
After strategic service providers have provided their inputs, a UoW deal can be structured. Step 5 " Structure the Deal
Deal structuring is obviously an important component of migrating to a UoW model. The following components should be considered:
1. Floor Volume
Figure 3
Sourcing Cube
Relate Design Build Operate Payroll Trading CRM Direct Brokerage Business Process Business Applications Infrastructure Execution Process IT a n d B u si n es s P ro ce ss A ss et s F u n ct io n al C o m p o n en ts In-Sourced Out-Sourced to 1 vendor Co-Sourced with 1 vendor Out-Sourced to multiple vendors Co-Sourced with multiple vendors
Demand Management Figure 4
Weekly Demand Assessment Checkpoints
?Pipeline study
?Visibility assessment
?Unit consumption review
Monthly Demand Assessment Checkpoints
?Forecast - review monthly commitment and forecast
?Review unit consumption - review and approve unit consumption for invoicing Quartely Demand Assessment Checkpoints
?Review model - review forecasts. upper and lower limits and unit definitions
2. Units of Work
3. SLAs : Penalty and Reward 4. Price Per Unit
5. Tiers for Pricing
6. Projected Pricing Scenarios
7. Continuous Benefits and Improvement Plan
One of the key features of the deal is that it should reward demand predictability and penalize deviations.
Step 6 " Transition to UoW Model
The transition will require some shift in focus as compared to traditional models:
1. Monitor the demand 2. Monitor the SLA
3. Review the quality of data getting generated
4. Review the effectiveness of the demand management process
5. Conduct weekly joint reviews to ensure that demand management and SLA processes are working as desired.
Road Ahead for UoW Engagements
Below are a few recommendations for an organization that has shifted to a UoW model.
Focus on Process Improvement: A UoW model will result in many process related changes to work prioritization, communication with business users, delivery assurance, and service provider engagement. Continuous feedback must be collected during new UoW engagements, and processes should be aligned accordingly.
SLA Management: In a UoW model, instead of worrying about skills and resources required for delivery, service level agreements are used to ensure that delivery is of expected quality. Once the ticket data starts flowing, then SLAs may need some fine tuning. In some areas, SLAs can be tightened; in other, non-critical areas they can be relaxed to achieve optimum quality. Instead of tightening SLAs across the board, which is a costly approach, SLAs should be driven by business needs.
Revisiting Units: For new UoW engagements, historical data generally benchmarks initial definition and pricing. However, data quality improves significantly with mature UoW models.
Engagement with Business Users: Some business users may experience challenges in prioritization. In a capacity based model, even low priority requests were routinely accepted. However, in new models the organization benefits by projecting and paying for only what is required. Business users should be engaged, and data of IT spending at a lower granularity should be shared (process and sub-process level), so that users can more fully appreciate the unit-based approach and align appropriately.
Expanding into Newer Areas: A UoW model has wide applicability, and can be adapted to almost all scenarios where there is some predictability in demand and sufficient volume. Once an organization achieves maturity in UoW engagements, then new areas and variants (e.g., program development, interface development, per application-based pricing) can be tried. For example, once there is sufficient high-quality data about portfolios, pricing can be on a per application basis with defined ranges.
Inflation of ticket volume: Ticket projections are based on historical data and costs are referenced against a base case of T&M spending projections. Furthermore, service providers are committed to keeping costs lower and achieving higher productivity.
Clearing up Common UoW Concerns
Quality of service: The service provider has a commitment to meet the SLA and to staff optimally. This reduces excess capacity and shortage of skills.
Pricing the unit: While engaging with IT
Service Providers, of the right size and maturity, it becomes easy to arrive at a common agreement to start the engagement. As data flows and grows, pricing can be refined.
Management Overhead: Overheads are lower
as there is no capacity planning. Better demand management leads to optimized IT spending and a net savings to the organization.
Security Concerns: In the financial services space, some clients want to have specific information about who has access to which systems. Conversely, in a UoW model vendors want to retain the flexibility of deploying people from an approved pool. Another stumbling block is the very long period (1 week or more) before a new resource can get access to the system. This can be easily mitigated by developing an express process to grant and revoke access to a set of approved personnel. Typically, the floating approved pool is less than 5% of the population.
UoW engagement models can be leveraged to a great extent to align IT costs to the business cycle. However, transition to a UoW model from traditional models needs some proactive planning, patience, and a sustained drive to extract maximum mileage. If rightly leveraged it has the potential to optimize IT demand and catalyze better understanding between business and IT.