Mixed Integer Programming to Minimize Train Delays
Nor Atiyah Mohd Zulkifli
1, Noraini Noordin
21,2Faculty of Computer and Mathematical Sciences, Universiti Teknologi MARA, 20600 Arau, Perlis, Malaysia
1 [email protected].; 2[email protected]
Abstract
Keretapi Tanah Melayu (KTM) train services are more preferred over other transportations due to easy public access to train stations in Malaysia. However, train arrival time has increased with time delays experienced by most customers with KTM Komuter services. The current study aimed to minimize total delay time of trains. Having exhibited similarities to previous works in this area, this study has chosen to adapt the Mixed Integer Programming (MIP) method to the Padang Besar (PB)-Sungai Petani (SP) KTM Komuter service routes. Included as decision variables were start and end time of rescheduled event as well as total delay from the rescheduled event. Primary data needed for delay data development was collected from 14 morning and evening KTM Komuter Monday and Friday trips on the SP-PB route from week two to four of February 2016. Delay data development in this study has used the original commuter schedule and primary data. As a result, the MIP run in Microsoft Excel has successfully achieved the minimum delay time of 1 minute and 45 seconds.
Keywords: Delay Data, Group Design Data, Mixed Integer Programming; Optimization; Survey Data.
Introduction
Easy public access to train stations throughout Malaysia has made the KTM train more preferred over other transportations. Like all public transportations, KTM Komuter has faced various challenges such as delays, punctuality arrival time, modified ticketing systems and delay time (Zakaria et al., 2010). Customer complaints in the official website of KTM have placed delay time as one of the prominent problems faced by KTM Komuter. In particular, almost 78% of respondents have experienced delays in trips from 2010 to 2012 (Bachok et al., 2012).
Delays which take place will affect cost and passenger activities. When delays are caused by operational problems like technical failures and equipment breakdown on the system or locomotive engine as well as inadequate train system like provision of coaches and low quality train sets, maintenance time is normally long and travel time may increase (Alwadood et al., 2015). Therefore, any delay will affect time schedule of the train.
Delays in KTM services have to be minimized in order to achieve customer satisfaction (Khalid et al., 2014). In an attempt to solve delays in train scheduling, the current study has adapted Mixed Integer Programming (MIP) method from previous related works to KTM Komuter two-way services on the Sungai Petani (SP) - Padang Besar (PB) route.
Literature Review
MIP has been widely used by researchers over the years. This section will look at the works of Acuña-Agost (2010), Li et al. (2012), Pellegrini et al. (2014), Alwadood et al. (2015) and Wan Ahmad Fatthi et al. (2016).
Acuña-Agost (2010) have proposed the use of MIP and Constraint Programming (CP) to find a new provisional timetable caused by disrupted operations. Although both models have the same objective, the definition of decision variables and constraints differs significantly. MIP alone has been found to become unmanageable in the presence of big size data because of the exponential number of binary variable used to model the order of train. Thus, the combined method can be used to solve delay problems for bigger sized data.
the optimal solution, the solutions exhibited small relative error but the tabu search algorithm was unstable due to dependence on the initial solution. However, the tabu search combined with the route adjustment algorithm has the ability to improve the quality and stability of solutions. Furthermore, the departure order of heterogeneous trains has exerted important influences on train route choice.
When a train does not abide by its original schedule, it may claim a section on the track that belongs to another train. Under such circumstance, one of the trains has to slow down or stop to ensure no conflict. Conflicts are synonymous to junctions where multiple lines cross. In case of perturbation like this, Pellegrini et al. (2014) have applied mixed-integer linear programming to find the best train routing and scheduling. The objective of their research was to minimize secondary delay suffered by any train and to minimize the total secondary delay. Findings from several instances representing perturbed traffic in the Lille Flandres station (France) found that duration of time interval increased since the computation time for the optimal solution took so long.
Delays can also occur due to service disruptions. The MIP model chosen by Alwadood et al. (2015) aimed to minimize total service delay under such conditions by using temporary timetable. All complexities were defined in the model formulation. Preliminary experiments were carried out on a small scale railway system by using a modified MIP model for rescheduling to find the optimal solution. Two
problem cases were created and the MIP model was able to generate optimal solutions.
MIP has also been applied to service time of trucks. Many organizations have found cross docking practice a promising cost-saving alternative to traditional warehousing because it has been shown to lessen operating costs and to fulfil customer’s demand especially for the retail products. Furthermore, it offers direct transshipment of goods from in-coming trucks to the outgoing trucks without any storage or with just temporary storage in between. Usually, the shipments will spend less than 24 hours in a cross docking facility or sometimes less than one hour. In the works by Wan Ahmad Fatthi et al. (2016), the MIP model was used for real-time truck-to-door assignment and scheduling of the inbound phase at the cross docking warehouse. Aimed with the objective to minimize the total service time of truck, the MIP model was able to reduce waiting time of truck at warehouse. Results of this study have been approved by experts from the cross docking warehouse.
By comparing the characteristics of the current study to previous works, similar attributes of the current study can be found in the work by Alwadood et al. (2015). Therefore, this current study has decided to use a MIP approach to solve delays.
Methodology
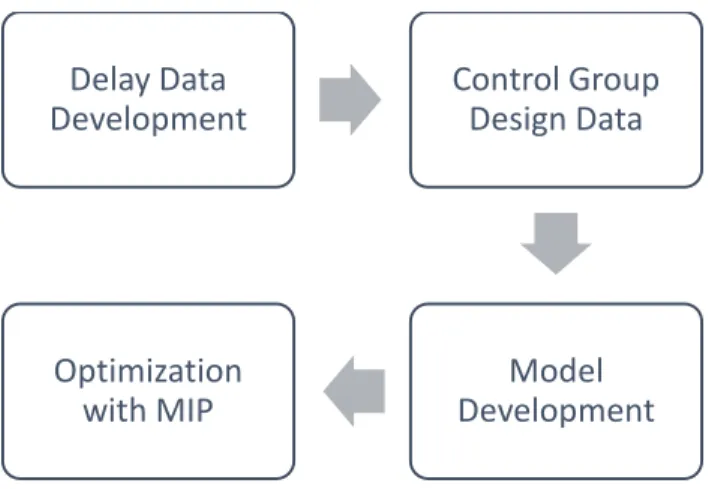
In doing this study, several important steps were conducted as displayed in Figure 1.
Figure 1: Important steps in MIP model
Delay Data Development
Data used here were KTM Komuter current schedule and primary data collected from 14 trips (morning and evening) on the KTM Komuter (7 to-and-from trips on the SP-PB route) on Mondays and Fridays in weeks two, three and four of February 2016. Monday and
Friday represent the beginning and end of weekdays, respectively.
Types of data used in this study were qualitative and quantitative data. Variables identified for use in the MIP model were set of trains, set of schedule in term of departure time, arrival time and destination, and set delay time. All data except set of train and destinations were quantitative data. In general, some parameters
Delay Data
Development
Control Group
Design Data
Model
Development
Optimization
like scheduled departure and arrival times were assumed to be fixed in order to minimize the total train delay. Data collected for three consecutive weeks were used to develop the actual delay time based on the original commuter schedule.
Control Group Design Data
All the information obtained were organized carefully in terms of time, destination and general. The survey data was used to develop data on minimum time at the segment, actual departure time and actual arrival time.
Model Development
The parameters used in this study are listed in Table 1.
Table 1: List of Parameters
T
i
- set of train T Sj - set of segment S
E
k
- set of events EE
k
i
- ordered set of events of train iE
L
j
- ordered set of events of segments ji
n
- last event of set of events of train ii
m
- last event of set of events of train j
k
1
- the first proceeding event ofevent k
k
- the minimum time an event k running at a segmentS k
d
- the schedule departure time of event k as in timetableS k
a
- the schedule arrival time of event k as in timetableA k
d
- the actual departure time of event kA k
a
- the actual arrival time of event kr
T
- the actual travel time after arriving at destinationIn addition, the decision variables used in this study are given in Table 2.
Table 2: Decision Variables
R k
d
- start time ofrescheduled event k
R k
a
- end time ofrescheduled event k
where kE,
K
i
E
,
andL
j
E
.
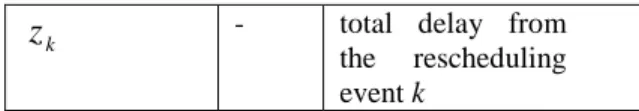
k
z
- total delay fromthe rescheduling event k
Formulation of Model
The complete formulation for the MIP model is given below:
Minimize
.T i ni z (1) subject to
,
k R k R kd
a
k
E
(2),
1 R k R kd
a
k
K
i ,i
T
:k
n
i (3),
k R k R kd
a
k
E
(4),
S k R k
d
d
k
E
(5),
A k R k
d
d
k
E
:d
kS
0
(6),
A k R k
a
a
k
E
:a
kA
0
(7),
k S k R
k
a
z
a
k
E
(8)r
T
=a
kA
d
kA.
(9)The objective function (1) calculates the minimum sum of delays experienced by all trains when they reach the final destination subject to the following constraints:
i. Constraint (2) indicates the minimum running time for each train event.
ii. Constraint (3) ensures that each train event must be directly succeeded by the next one, as far as the original schedule is concerned. iii. Constraint (4) indicates the train should strictly
depart and arrive according to the planned scheduled.
iv. Constraint (5) indicates that the reschedule departure time should never be earlier than the original time scheduled.
v. Constraint (6) and (7) force new departure and arrival time in the occurrence of disruption. vi. Constraint (8) defines the total delay of all
trains as the deviation between the reschedule and the original arrival times.
vii. Constraint (9) defines the actual travel time for train after arriving at their destination.
Optimization Procedure by MIP Method
Results And Discussion
Delay Data Development
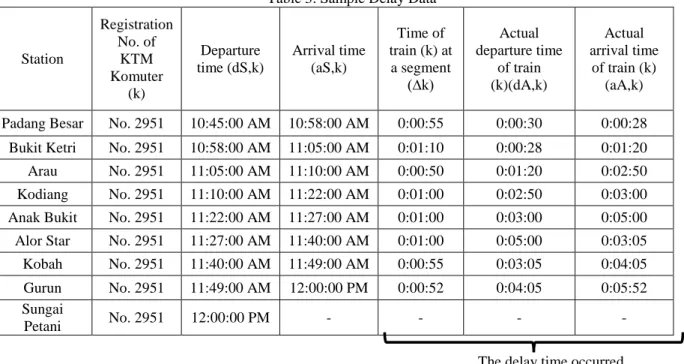
The delay data development was successfully done using the current original commuter schedule to and from PB to SP and survey data. There were altogether 14 trips to consider in this study. Table 3 displays one sample delay data.
Control Group Design Data
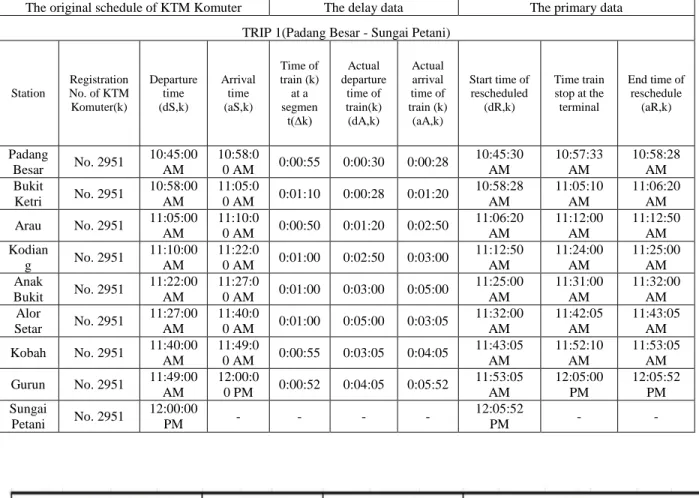
Table 4 shows a sample of control group design data used in this study. The minimum time of train at the segment is 10 seconds while the maximum time at the segment is 2 minutes and 29 seconds. Time taken at platform stops is longer due to technical problems like servicing train air-conditioned system.
Table 3 and Table 4 are used in the optimization procedure. Figure 2 displays the result for Trip 1. Table 3: Sample Delay Data
Station
Registration No. of
KTM Komuter
(k)
Departure time (dS,k)
Arrival time (aS,k)
Time of train (k) at a segment
(∆k)
Actual departure time
of train (k)(dA,k)
Actual arrival time
of train (k) (aA,k)
Padang Besar No. 2951 10:45:00 AM 10:58:00 AM 0:00:55 0:00:30 0:00:28
Bukit Ketri No. 2951 10:58:00 AM 11:05:00 AM 0:01:10 0:00:28 0:01:20
Arau No. 2951 11:05:00 AM 11:10:00 AM 0:00:50 0:01:20 0:02:50
Kodiang No. 2951 11:10:00 AM 11:22:00 AM 0:01:00 0:02:50 0:03:00
Anak Bukit No. 2951 11:22:00 AM 11:27:00 AM 0:01:00 0:03:00 0:05:00
Alor Star No. 2951 11:27:00 AM 11:40:00 AM 0:01:00 0:05:00 0:03:05
Kobah No. 2951 11:40:00 AM 11:49:00 AM 0:00:55 0:03:05 0:04:05
Gurun No. 2951 11:49:00 AM 12:00:00 PM 0:00:52 0:04:05 0:05:52 Sungai
Petani No. 2951 12:00:00 PM - - - -
The delay time occurred
The Developed Model
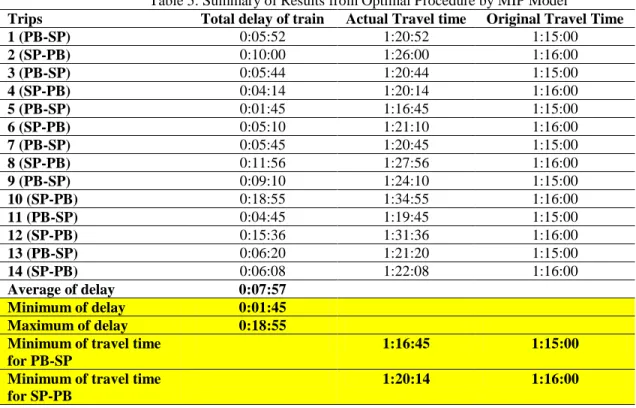
Table 5 shows the summary of results of optimal procedure by MIP model. As can be seen, average delay is 7 minutes and 57 second and minimum delay is about 1 minute and 45 seconds while maximum delay is about 18 minutes and 55 seconds. Meanwhile, minimum of actual travel time for PB-SP is about 1 hour 16 minutes and 45 seconds while minimum of actual travel time for SP-PB is about 1 hour 20 minutes and 14 seconds. Therefore, the results of actual time indicate that all trips experienced delays.
Conclusion And Recommendation
Table 4: Sample of Group Design Data
The original schedule of KTM Komuter The delay data The primary data
TRIP 1(Padang Besar - Sungai Petani)
Station
Registration No. of KTM Komuter(k)
Departure time (dS,k)
Arrival time (aS,k)
Time of train (k) at a segmen
t(∆k)
Actual departure
time of train(k) (dA,k)
Actual arrival time of train (k) (aA,k)
Start time of rescheduled
(dR,k)
Time train stop at the terminal
End time of reschedule
(aR,k)
Padang
Besar No. 2951
10:45:00 AM
10:58:0
0 AM 0:00:55 0:00:30 0:00:28
10:45:30 AM
10:57:33 AM
10:58:28 AM Bukit
Ketri No. 2951
10:58:00 AM
11:05:0
0 AM 0:01:10 0:00:28 0:01:20
10:58:28 AM
11:05:10 AM
11:06:20 AM
Arau No. 2951 11:05:00
AM
11:10:0
0 AM 0:00:50 0:01:20 0:02:50
11:06:20 AM
11:12:00 AM
11:12:50 AM Kodian
g No. 2951
11:10:00 AM
11:22:0
0 AM 0:01:00 0:02:50 0:03:00
11:12:50 AM
11:24:00 AM
11:25:00 AM Anak
Bukit No. 2951
11:22:00 AM
11:27:0
0 AM 0:01:00 0:03:00 0:05:00
11:25:00 AM
11:31:00 AM
11:32:00 AM Alor
Setar No. 2951
11:27:00 AM
11:40:0
0 AM 0:01:00 0:05:00 0:03:05
11:32:00 AM
11:42:05 AM
11:43:05 AM
Kobah No. 2951 11:40:00
AM
11:49:0
0 AM 0:00:55 0:03:05 0:04:05
11:43:05 AM
11:52:10 AM
11:53:05 AM
Gurun No. 2951 11:49:00
AM
12:00:0
0 PM 0:00:52 0:04:05 0:05:52
11:53:05 AM
12:05:00 PM
12:05:52 PM Sungai
Petani No. 2951
12:00:00
PM - - - -
12:05:52
PM - -
Table 5: Summary of Results from Optimal Procedure by MIP Model
Trips Total delay of train Actual Travel time Original Travel Time
1 (PB-SP) 0:05:52 1:20:52 1:15:00
2 (SP-PB) 0:10:00 1:26:00 1:16:00
3 (PB-SP) 0:05:44 1:20:44 1:15:00
4 (SP-PB) 0:04:14 1:20:14 1:16:00
5 (PB-SP) 0:01:45 1:16:45 1:15:00
6 (SP-PB) 0:05:10 1:21:10 1:16:00
7 (PB-SP) 0:05:45 1:20:45 1:15:00
8 (SP-PB) 0:11:56 1:27:56 1:16:00
9 (PB-SP) 0:09:10 1:24:10 1:15:00
10 (SP-PB) 0:18:55 1:34:55 1:16:00
11 (PB-SP) 0:04:45 1:19:45 1:15:00
12 (SP-PB) 0:15:36 1:31:36 1:16:00
13 (PB-SP) 0:06:20 1:21:20 1:15:00
14 (SP-PB) 0:06:08 1:22:08 1:16:00
Average of delay 0:07:57
Minimum of delay 0:01:45
Maximum of delay 0:18:55
Minimum of travel time for PB-SP
1:16:45 1:15:00
Minimum of travel time for SP-PB
1:20:14 1:16:00
References
Acuña-Agost, R. (2010). Mathematical modeling and methods for rescheduling trains under disrupted operations. Université d'Avignon.
Alwadood, Z., Shuib, A., & Abdul Hamid, N. (2015). A modified Mixed Integer Programming Model for Train Scheduling. Journal of Industrial and Intelligent Information, 3(2), 102-109. doi: 10.12720/jiii.3.2.102-109
Bachok, S., Osman, M. M., Khalid, U. A., & Zainaldin, M. F. (2012). The Application of Regression Analysis on Users' Tolerance to Prolonged Waiting Times: The Case of KTM Komuter Services of Malaysia. WIT Transactions on The Built Environment, 127, 299-310.
Khalid, U. A., Bachok, S., Osman, M. M., & Ibrahim, M. (2014). User Perceptions of Rail Public Transport Services in Kuala Lumpur, Malaysia: KTM Komuter. Social and Behavioral Science, 153, 566-573.
Li, F., Gao, Z., Li, K., & Wang, D. Z. (2012). Train routing model and algorithm combined with train scheduling. Journal of Transportation Engineering, 139(1), 81-91.
Pellegrini, P., Marlière, G., & Rodriguez, J. (2014). Optimal train routing and scheduling for managing traffic perturbations in complex junctions.
Transportation Research Part B: Methodological, 59, 58-80.
Wan Ahmad Fatthi, W. N. A., Shuib, A., & Dom, R. M. (2016). A Mixed Integer Programming Model for Solving Real-Time Truck-to-Door Assignment and Scheduling Problem at Cross Docking Warehouse. MANAGEMENT, 12(2), 431-447.