7
CURRENT WORKING TECHNOLOGIES FOR DRAFTING FOREST
MANAGEMENT PLANS
FLORIN ACHIM1, SILVIU PĂUNESCU1, FLORIN-DORIAN COJOACĂ1, GABRIEL
LAZĂR1, PETRE ZANOCEA1, CRINU BUZATU1, RĂZVAN RĂDUCU1
1National Institute for Research and Development in Forestry „Marin Drăcea“
Corresponding author email: [email protected]
Key words: thinnings, optimal structure, function, forest management objectiv
ABSTRACT
Keywords: time rule, production norm, forest management planning, forest management plans
This paper identifies the technology and working methods used to develop drafts of forest management plans, with therequired activities – executed using modern technologies and existing equipment –being indicated. Each operation in the drafting is described in detail, including the working technologies, organisation of the workplaces, training units, measurement units, instruments and equipment, working conditions with specific influence factors, and elements that contribute to the updating of working methodologies in the drafting and increase labour productivity.
1. INTRODUCTION
In the last three decades, major changes have been made in forest management planning that have been closely linked to developments recorded across several areas, especially calculation techniques, the theory of relational databases, database management systems, geographic information systems (GISs) and the evolution of equipment, software, etc.
The entire process of data collection and the development of forest management plans is part of a normal process of adapting to the realities of the moment andremovingnovel elements from various fields of activity.
For the processing of field data, specific software products have been developed and adapted in tandem with developmentsin computing techniques. In 1992, an informatics product – AS – Forest management plans version 3.3 – was developed, which carried out the computer-aided design of forest management on IBM PC-compatible computers. It was configured in MS-DOS version 4.1, which could be used on a
personal computer.This was a redesign of the previous version (3.2) that could be used on a Juniormicrocomputer (Seceleanu, 1992).
This product was used as long as it was possible to operate using existing operating systems (from 1992 to 2005),up to the appearance of Windows 95. When the operating system became incompatible with the forest management planning software, the software had to be redesigned to be compatible with the operating systems existing after 2005. As a consequence, the informatics product AS2007 – Forest management plans was produced,developed for Visual Fox Pro. This was compatible with Windows 95 through Windows Vista (Lazar et al., 2009).The facilities provided by this new software enabled a developed database to be obtained, which could contain a greater number of reports, with the direct consequence of shortening the period of development of forestry management plans.
8
the first plan developed using GIS was in Brăneşti Forest District (FD). The forestry maps obtained using the GIS technique for the plan were made usingdigitisationinAutocad MAP, the topologies usedArcInfo Workstation and the GIS side using ArcView 3.1 C512 (Achim, 2013). The GIS database included spatial information taken from the maps used in forest management and descriptive information taken from the field.
The implementation of GIS in forest management planning has provided several benefits, including reducing the time needed to produce and update the maps, reducing the time involved in updating the database, obtaining accurate and standardised information andallowing quick access to information.
Based onthesetechnology-influencing aspects, we here present the current working technologyfor developing forest management plans, which has replaced the classic technology used before the introduction of GIS techniques. The need to identify the existing operations results from the need to update time and production norms, whichhave direct implications for increasing productivity in the management planning stage.
2. MATERIAL AND METHOD
In order to identify the activities carried out by personnel during the drafting of forest management plans, and to study the work time in such a way that the recorded data would lead to the development of time and production norms for developing forest management plans, it was necessary to use appropriate technical methods. Thus, for the identification of activities related to this phase, observation and photography
of the working day were employed. The photography involved two steps – preparation and photograph-taking.
The preparation involved choosing the workersabout whom the observations were to be made, and explaining to them the purpose and importance of the observations.They had to work at a normal pace, following their working methodology, and completea working conditions sheet.The photography involved recording an entire activity being performed by the chosen worker during regular work hours.
Each activity was recorded on photograph sheets, using a clock and a timer to record the times and duration of each work element.
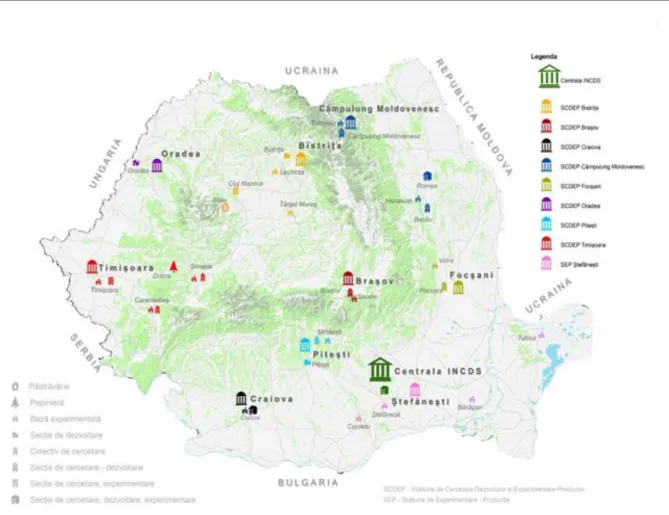
The observations were made,using the subunits of the National Institute for Research and Development in Forestry ‘Marin Drăcea’, in Braşov, Craiova, Bistriţa, Roman, Timisoara, Pitesti and Oradea (Fig. 1).
In all the subunits of the institute, there are specialised, collective workers who carry out forest planning, and it was intended that all of them would be involved in the implementation of the project. In this way, the representativeness of the results was ensured at the national level.
3. RESULTS AND DISCUSSIONS
9
Fig. 1 Subunits of the National Institute for Research and Development in Forestry ‘Marin Drăcea’
Table 1
Operations indentified for drafting forest management plans (numbered points in the second column are referred to in the text below by their numbers)
Classic writing, work operations Current writing,
work operations
Drafting forest management plans
Drafting forest management plans
Works using GIS techniques
1. Graphical reports, classic technology
1.Graphical reports, modern (digital) technology
2. Cubic calculations, classic technology, manual calculations or dedicated software
2. Cubic calculations, modern technology, dedicated
software
3. Transposition the parcel and subparcel from the old plans to the new ones using photography or photocopying
3. Transposition the parcel and subparcel from the old plans to the new ones using scanning and vectorising
4. Assemble reports on the basic plans using classic methodology
10 5. Classical method using a
planimeter
- Analytical determination of
surfaces
6. Draw the old map, classically - Developmaps using GIS techniques
7. Automated data processing using the AS3 – Forestry software product
5. Automated data
processing using the AS2009 –Forestry software product
8. Draft the forest management plan on Yield Management Unit (YMU), writethe manuscript
6. Preparationfor the second Conference on Forest Planning
7. Draft the forest
management plans on YMU, write on PC
9. Guidance for, and reception and approval of, the forest management plan draft
8. Guidance for, and reception and approval of, the forest management plan draft
Below are brief descriptions of each indentified operation, and the differences between the classic technology and that used after the implementation of GIS.
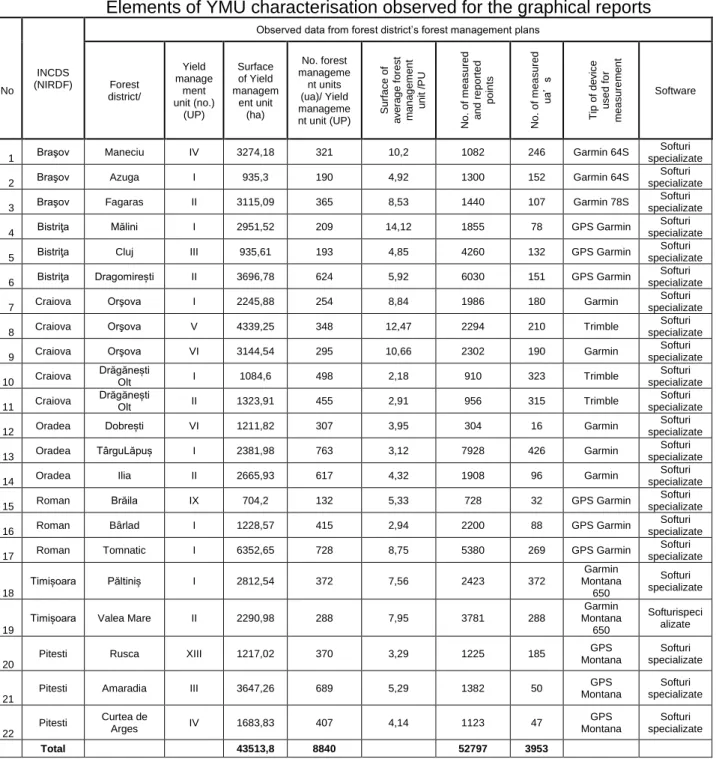
1. Graphical reports are currently producedin the office by a technician or engineer, using GPS equipment, a PC computer and printer.The unit of measurement is 1000 reported points. In the classic system of drafting forest management plans, the graphical reports were produced by a designer or technical designer, using a spacer, a rapporteur, millimetre paper and calc paper, and the unit of measurement was also 1000 reported points (Ministry of Forest Waters and Environmental Protection - MFWEP, 1999). The current working technology is radically different and improved due to changes in field data collection equipment and the replacement of topographic compasses with GPS technology.
Observations for the graphical reports were made in 19 forestry
areas/experimental bases (Table 2), where:
- the production units (YMUs) had different surface sizes (from 935.3 ha to 6352.65 ha);
- the layout units had different surface sizes, to illustrate the diversity of situations;
- the YMUs in which a variable number of field measurements were carried out also captured the quantity of work performed per territorial unit;
- various specialised software packages, compatible with the GPS equipment, wereused for the measurements;
11
Table 2
Elements of YMU characterisation observed for the graphical reports
INCDS (NIRDF)
Observed data from forest district’s forest management plans
No Forest
district/ Yield manage ment unit (no.) (UP) Surface of Yield managem ent unit (ha) No. forest manageme nt units (ua)/ Yield manageme
nt unit (UP) S
u rfa ce o f a ve ra g e f o re st m a n a g e m e n t u n it / P U No. o f m e a su re d a n d r e p o rte d p o in ts No. o f m e a su re d ua ’ s T ip o f d e vic e u se d f o r m e a su re m e n t Software
1 Braşov Maneciu IV 3274,18 321 10,2 1082 246 Garmin 64S
Softuri specializate
2 Braşov Azuga I 935,3 190 4,92 1300 152 Garmin 64S
Softuri specializate
3 Braşov Fagaras II 3115,09 365 8,53 1440 107 Garmin 78S
Softuri specializate
4 Bistriţa Mălini I 2951,52 209 14,12 1855 78 GPS Garmin
Softuri specializate
5 Bistriţa Cluj III 935,61 193 4,85 4260 132 GPS Garmin
Softuri specializate
6 Bistriţa Dragomirești II 3696,78 624 5,92 6030 151 GPS Garmin
Softuri specializate
7 Craiova Orşova I 2245,88 254 8,84 1986 180 Garmin
Softuri specializate
8 Craiova Orşova V 4339,25 348 12,47 2294 210 Trimble
Softuri specializate
9 Craiova Orşova VI 3144,54 295 10,66 2302 190 Garmin
Softuri specializate
10 Craiova
Drăgănești
Olt I 1084,6 498 2,18 910 323 Trimble
Softuri specializate
11 Craiova
Drăgănești
Olt II 1323,91 455 2,91 956 315 Trimble
Softuri specializate
12 Oradea Dobrești VI 1211,82 307 3,95 304 16 Garmin
Softuri specializate
13 Oradea TârguLăpuș I 2381,98 763 3,12 7928 426 Garmin
Softuri specializate
14 Oradea Ilia II 2665,93 617 4,32 1908 96 Garmin
Softuri specializate
15 Roman Brăila IX 704,2 132 5,33 728 32 GPS Garmin
Softuri specializate
16 Roman Bârlad I 1228,57 415 2,94 2200 88 GPS Garmin
Softuri specializate
17 Roman Tomnatic I 6352,65 728 8,75 5380 269 GPS Garmin
Softuri specializate
18
Timișoara Păltiniș I 2812,54 372 7,56 2423 372
Garmin Montana 650 Softuri specializate 19
Timișoara Valea Mare II 2290,98 288 7,95 3781 288
Garmin Montana 650 Softurispeci alizate 20
Pitesti Rusca XIII 1217,02 370 3,29 1225 185 GPS
Montana
Softuri specializate
21
Pitesti Amaradia III 3647,26 689 5,29 1382 50 GPS
Montana
Softuri specializate
22
Pitesti Curtea de
Arges IV 1683,83 407 4,14 1123 47
GPS Montana
Softuri specializate
Total 43513,8 8840 52797 3953
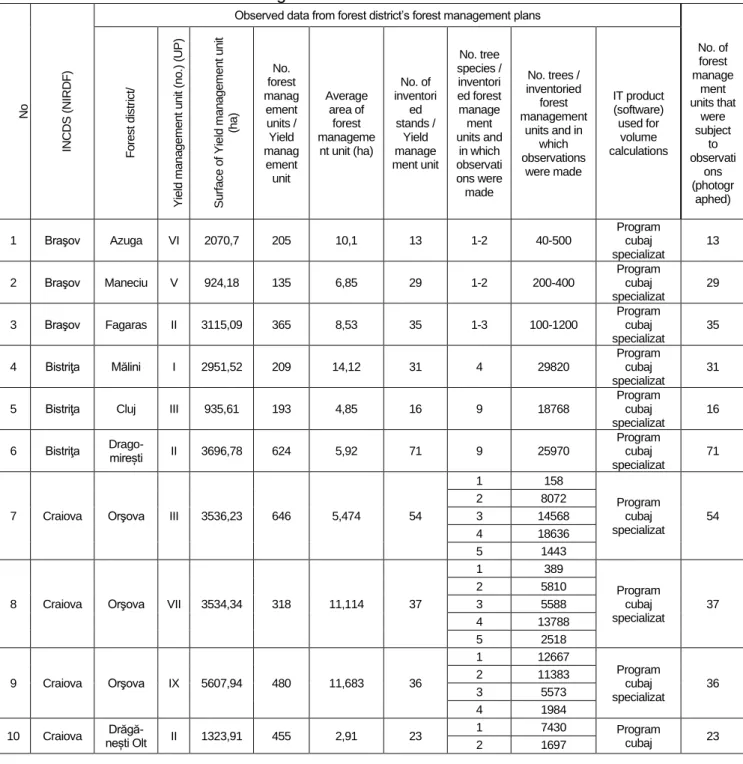
2. Cubic calculations are performed in the office by a designer (technician or engineer) using a PC, specialised software, a field notebook, a notebook with the centralisation of the sheet points and a printer.The unit of measurement used is the number of development units.In the classic system of drafting forest management plans, cubic calculations were performed manually by a technician, using a field notebook, a notebook with the centralization of the sheet points and a
sheet of cubic calculations. The unit of measurement was also the number of development units (MFWEP,1999).The technology has been much improved by using specialised software.
Observations for the cubic calculations were made in 19 forestry areas/experimental bases (Table 3), and:
12
- the observations were carried out in forestry units where the trees were inventoried by statistical land integral procedures (wire by wire); - the standscomprised a variable
number (1–5) of species, so that the influencing factors having a significant impact on the calculation of the time and production normscould be identified, analysed and selected;
- forestry units made up of a variable number of trees were analysed;
- a single specialised software was used for the automated calculation of the volumes of the inventoried trees;
- observations were made on a total of 704 stands, with the total number above 420000 trees.
Table 3
Elements characterisingthe YMUs observed for use in the cubic calculations
No IN C D S ( N IR D F )
Observed data from forest district’s forest management plans
F o re s t d is tr ic t/ Y ie ld m a n a g e m e n t u n it (n o .) ( U P ) S u rf a c e o f Y ie ld m a n a g e m e n t u n it (h a ) No. forest manag ement units / Yield manag ement unit Average area of forest manageme
nt unit (ha)
No. of inventori ed stands / Yield manage ment unit No. tree species / inventori ed forest manage ment units and in which observati ons were made
No. trees / inventoried forest management
units and in which observations were made IT product (software) used for volume calculations No. of forest manage ment units that were subject to observati ons (photogr aphed)
1 Braşov Azuga VI 2070,7 205 10,1 13 1-2 40-500
Program cubaj specializat
13
2 Braşov Maneciu V 924,18 135 6,85 29 1-2 200-400
Program cubaj specializat
29
3 Braşov Fagaras II 3115,09 365 8,53 35 1-3 100-1200
Program cubaj specializat
35
4 Bistriţa Mălini I 2951,52 209 14,12 31 4 29820
Program cubaj specializat
31
5 Bistriţa Cluj III 935,61 193 4,85 16 9 18768
Program cubaj specializat
16
6 Bistriţa Drago-mirești II 3696,78 624 5,92 71 9 25970
Program cubaj specializat
71
7 Craiova Orşova III 3536,23 646 5,474 54
1 158
Program cubaj specializat
54
2 8072
3 14568
4 18636
5 1443
8 Craiova Orşova VII 3534,34 318 11,114 37
1 389
Program cubaj specializat
37
2 5810
3 5588
4 13788
5 2518
9 Craiova Orşova IX 5607,94 480 11,683 36
1 12667
Program cubaj specializat
36
2 11383
3 5573
4 1984
10 Craiova nești Olt Drăgă- II 1323,91 455 2,91 23 1 7430 Program
cubaj 23
13
3 1828 specializat
4 4465
11 Oradea Dobrești VI 1211,82 307 3,95 60
1 304
Program cubaj specializat
13
2 2269
3 13757
4 5622
5 2393
12 Oradea Târgu Lăpuș I 2381,98 763 3,12 90
1 1197
Program cubaj specializat
11
2 963
3 2550
13 Oradea Ilia II 2665,93 617 4,32 75
1 2404
15
2 1335
3 2306
4 1607
14 Roman Brăila IX 704,2 132 5,33 41 1-3 6017
Program cubaj specializat
41
15 Roman Bârlad I 1228,57 415 2,94 42 3-4 32874
Program cuba jspecializat
42
16 Roman Tomnatic I 6352,65 728 8,75 126 2-3 127883
Program cubaj specializat
126
17 șoara Timi- Păltiniș I 2812,54 372 7,56 27 3 560
Program cubaj specializat
27
18 șoara Timi- Valea
Mare II 2290,98 288 7,95 30 3 540
Program cubaj specializat
30
19 Pitesti Rusca XIII 1217,02 370 3,29 20 1,2 2250
Program cubaj specializat
20
20 Pitesti Amaradia III 3647,26 689 5,29 57 1,2,3 13575
Program cubaj specializat
16
21 Pitesti Curtea
de Arges IV 1683,83 407 4,14 22 1,2,3,4 10245
Program cubaj specializat
18
Total 935 423206 704
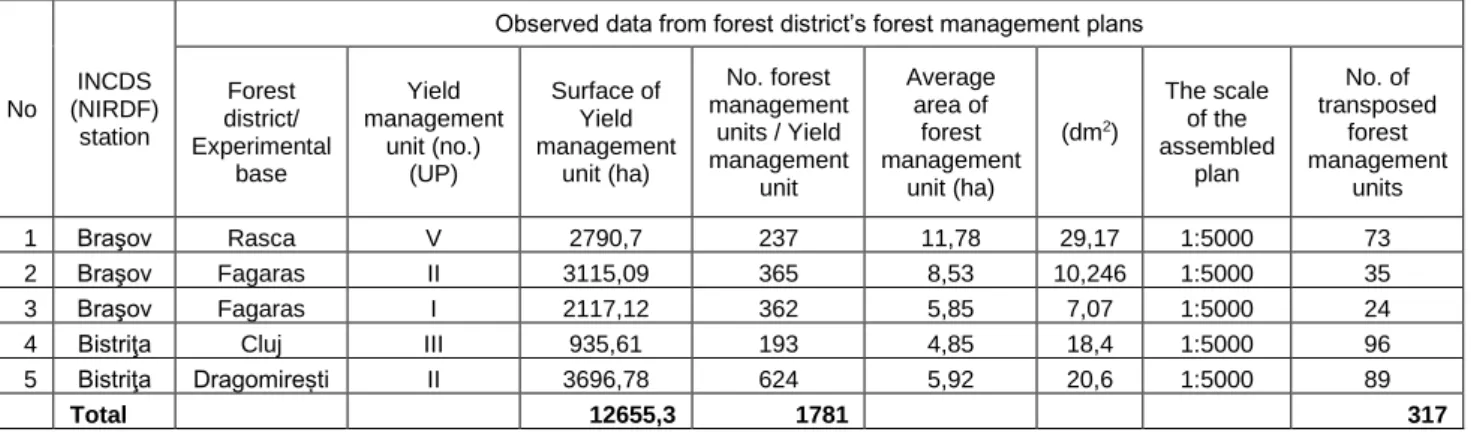
3.Transpositioning of the parcel and subparcel on the base map (change or create the base map) is currently performed in the office by an engineer, using a PC, specialised software, the old 1:10,000 topographic plans, the forestry maps, orthophotomaps and a plotter, and the unit of measurement for the base map transposition is dm2. In the classic system
of drafting forest management plans, the transposition of parcels and subparcels from the old base maps to the new ones (change the base map) was performed by a worker and a technical designer.The work technology in the classical system was different, with the old plans being
transposedusing photography or phocopying, at the same topographical scale as the new plans. The existing informationfrom the new plans was copied ontocalc paper and, using a special table to which the new plans were fixed, the contours of the existing parcels and subparcelsweredrawn using a pen. Then, the parcels and subparcelson the new plans were drawnonto the printed boundaries, and the information wais completed with the number of parcels, subparcels and bourns. The unit of measurement was also dm2
(MFWEP,1999).
14
(change or create the base map) were performed in four forestry areas (Table 4), and included:
- five production units of different surface size (from 935 ha to 3697 ha) and with various areal sizes (from 5.9 ha to 11.8 ha); - the areas transposed on the
base planes ranged from 7 dm2
to FDFăgăraş and 29 dm2 to
FDRâşca;
- the transposition of the parcel and subparcel to the base map was carried out on the topographic plans(scale 1:5000), as recomanded by technical forest management norms;
- the observations were made for the 317 units transposed onto the topographic plans.
Table 4
Elements characterising the YMUs observed for use in the transposition of the parcel and subparcel
No
INCDS (NIRDF)
station
Observed data from forest district’s forest management plans
Forest district/ Experimental
base
Yield management
unit (no.) (UP)
Surface of Yield management
unit (ha)
No. forest management
units / Yield management
unit
Average area of
forest management
unit (ha)
(dm2)
The scale of the assembled
plan
No. of transposed
forest management
units
1 Braşov Rasca V 2790,7 237 11,78 29,17 1:5000 73
2 Braşov Fagaras II 3115,09 365 8,53 10,246 1:5000 35
3 Braşov Fagaras I 2117,12 362 5,85 7,07 1:5000 24
4 Bistriţa Cluj III 935,61 193 4,85 18,4 1:5000 96
5 Bistriţa Dragomirești II 3696,78 624 5,92 20,6 1:5000 89
Total 12655,3 1781 317
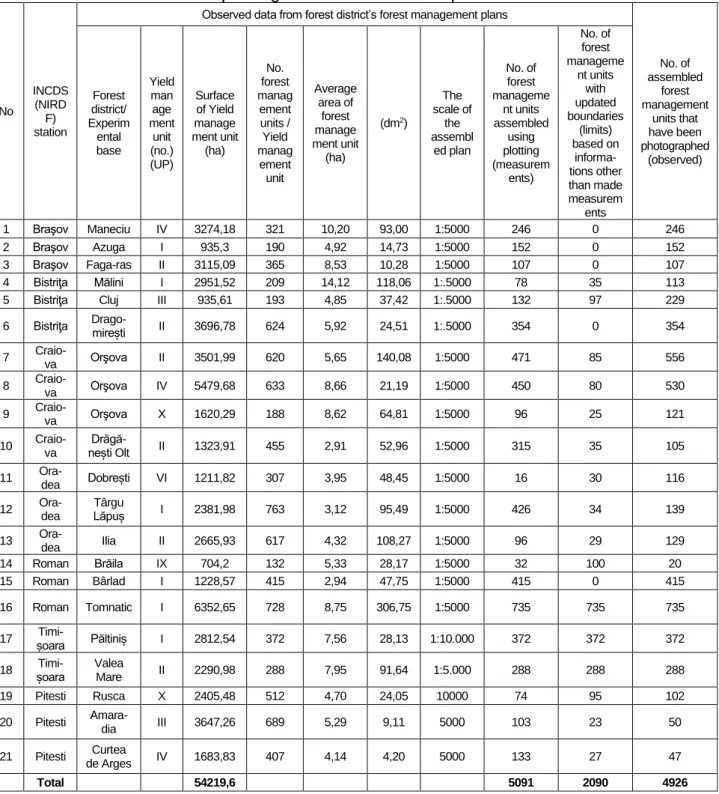
4. Assembling reports and updating information on the basic plans is now performed in the office by an engineer, using a PC, specialised software, the field reports on the subparcels measuredelectronically or printed out on hard support format, the orthophotoplanes and a plotter, the unit of measurement is the dm2.In the classical
system,assembly of the reports on the basic plans was carried out by an engineer,using the kilometre as the unit of measurement.The work technology in the classic system is different, insofar as the graphical reports executed on calc paper overlapped on the base planes through connection points (bourns, roads, borders, valleys, peaks). After this overlapping, by pinching the reported points and then drawing the contour by joining the resulting signs, the base plan was assembled using the reported details (MFWEP, 1999).
Observations for assembling reports and updating information on the cartographic bases were made in 19
forestry areas/experimental bases (Table 5), and included:
- the geomorphology (wetland, plain, hill, mountain) constituted a potential influencing factor in the forestry area in determining time and production norms; - YMUs with different surface
sizes, from 704 ha in YMU IX from FD Braila to 6352 ha in YMU I from Experimental Base Tomnatic;
- report assembly for parcels and subparcels was carried out for both base planes at scales 1:5,000 and 1:10,000;
- oservations on 4926 subparcels assembled on the base planes; - subparcels assembled on basic
15
Table 5
Elements characterising the YMUs observed for use in assembling reports and updating information on basic plans
No
INCDS (NIRD
F) station
Observed data from forest district’s forest management plans
No. of assembled
forest management
units that have been photographed
(observed) Forest
district/ Experim ental base
Yield man
age ment
unit (no.) (UP)
Surface of Yield manage ment unit
(ha)
No. forest manag ement units / Yield manag ement unit
Average area of
forest manage ment unit
(ha)
(dm2)
The scale of
the assembl
ed plan
No. of forest manageme
nt units assembled
using plotting (measurem
ents)
No. of forest manageme
nt units with updated boundaries
(limits) based on
informa-tions other than made measurem
ents
1 Braşov Maneciu IV 3274,18 321 10,20 93,00 1:5000 246 0 246
2 Braşov Azuga I 935,3 190 4,92 14,73 1:5000 152 0 152
3 Braşov Faga-ras II 3115,09 365 8,53 10,28 1:5000 107 0 107
4 Bistriţa Mălini I 2951,52 209 14,12 118,06 1:.5000 78 35 113
5 Bistriţa Cluj III 935,61 193 4,85 37,42 1:.5000 132 97 229
6 Bistriţa Drago-mirești II 3696,78 624 5,92 24,51 1:.5000 354 0 354
7
Craio-va Orşova II 3501,99 620 5,65 140,08 1:5000 471 85 556
8
Craio-va Orşova IV 5479,68 633 8,66 21,19 1:5000 450 80 530
9 Craio-va Orşova X 1620,29 188 8,62 64,81 1:5000 96 25 121
10 Craio-va nești Olt Drăgă- II 1323,91 455 2,91 52,96 1:5000 315 35 105 11
Ora-dea Dobrești VI 1211,82 307 3,95 48,45 1:5000 16 30 116
12 Ora-dea
Târgu
Lăpuș I 2381,98 763 3,12 95,49 1:5000 426 34 139
13 Ora-dea Ilia II 2665,93 617 4,32 108,27 1:5000 96 29 129
14 Roman Brăila IX 704,2 132 5,33 28,17 1:5000 32 100 20
15 Roman Bârlad I 1228,57 415 2,94 47,75 1:5000 415 0 415
16 Roman Tomnatic I 6352,65 728 8,75 306,75 1:5000 735 735 735
17 șoara Timi- Păltiniș I 2812,54 372 7,56 28,13 1:10.000 372 372 372
18 șoara Timi- Valea
Mare II 2290,98 288 7,95 91,64 1:5.000 288 288 288
19 Pitesti Rusca X 2405,48 512 4,70 24,05 10000 74 95 102
20 Pitesti
Amara-dia III 3647,26 689 5,29 9,11 5000 103 23 50
21 Pitesti Curtea
de Arges IV 1683,83 407 4,14 4,20 5000 133 27 47
Total 54219,6 5091 2090 4926
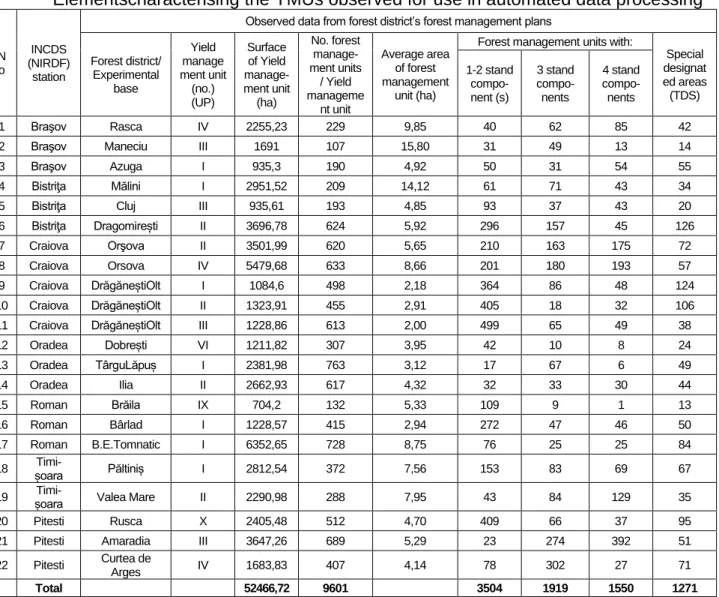
5. Automated data processing is performed at the office, by an engineer/technician or programming analyst, using a PC, specialised software, field notebooks, an ecotypical scheme and a printer.The unit of measurement used is the number of YMUs.In the classic system, automated data processing was performing by a worker,
16
The observations for the automated data processing with specialised software were made in 19 forest areas/experimental bases (Table 6):
- the geomorphology (wetland, plain, hill, mountain) constituted a potential influencing factor in the forestry area in determining time and production norms; - the production units had
different surface sizes, from 704 ha in YMU IX from FD Braila to 6352 ha in YMU I from Experimental Base Tomnatic;
- the time taken to enterdata on forest type (with one-two stand components, three, four stand components or more) ontoparcelar description sheets influenced the duration of these operations;
- theparcelar description sheets contain a description of the land with special designated areas, which involves a small amount of data and information; the time taken toinput these into the forest planning software is variable.
Table 6
Elementscharacterising the YMUs observed for use in automated data processing
N o
INCDS (NIRDF)
station
Observed data from forest district’s forest management plans
Forest district/ Experimental
base
Yield manage ment unit
(no.) (UP)
Surface of Yield manage-ment unit
(ha)
No. forest manage-ment units
/ Yield manageme
nt unit
Average area of forest management
unit (ha)
Forest management units with:
Special designat ed areas
(TDS) 1-2 stand
compo-nent (s)
3 stand compo-nents
4 stand
compo-nents
1 Braşov Rasca IV 2255,23 229 9,85 40 62 85 42
2 Braşov Maneciu III 1691 107 15,80 31 49 13 14
3 Braşov Azuga I 935,3 190 4,92 50 31 54 55
4 Bistriţa Mălini I 2951,52 209 14,12 61 71 43 34
5 Bistriţa Cluj III 935,61 193 4,85 93 37 43 20
6 Bistriţa Dragomirești II 3696,78 624 5,92 296 157 45 126
7 Craiova Orşova II 3501,99 620 5,65 210 163 175 72
8 Craiova Orsova IV 5479,68 633 8,66 201 180 193 57
9 Craiova DrăgăneștiOlt I 1084,6 498 2,18 364 86 48 124
10 Craiova DrăgăneștiOlt II 1323,91 455 2,91 405 18 32 106
11 Craiova DrăgăneștiOlt III 1228,86 613 2,00 499 65 49 38
12 Oradea Dobrești VI 1211,82 307 3,95 42 10 8 24
13 Oradea TârguLăpuș I 2381,98 763 3,12 17 67 6 49
14 Oradea Ilia II 2662,93 617 4,32 32 33 30 44
15 Roman Brăila IX 704,2 132 5,33 109 9 1 13
16 Roman Bârlad I 1228,57 415 2,94 272 47 46 50
17 Roman B.E.Tomnatic I 6352,65 728 8,75 76 25 25 84
18 șoara Timi- Păltiniș I 2812,54 372 7,56 153 83 69 67
19 șoara Timi- Valea Mare II 2290,98 288 7,95 43 84 129 35
20 Pitesti Rusca X 2405,48 512 4,70 409 66 37 95
21 Pitesti Amaradia III 3647,26 689 5,29 23 274 392 51
22 Pitesti Curtea de
Arges IV 1683,83 407 4,14 78 302 27 71
Total 52466,72 9601 3504 1919 1550 1271
6. Preparationfor the second Conference on Forest Planning is now performed in the office by an forester (engineer/subengineer), using a PC,
17
fieldwork, the minutes of the first conference, correspondence from within the forest district, and a printer.The unit of measurement used is the YMU. Previously, the working technology was included in the drafting of the forest management plans perYMU.
The second Conference on Forest Planningis a necessary milestone for anticipating forest management solutions and so,taking into account the work volume involved in the preparation for this, as well as the the technical process of drafting the forest management plans, this has been separated out as a discrete operation. Compared to the work items evaluated by the work norms in 1999, the
current situation is distinct.After the year 2000, once the low no. 1/2000 and subsequently the low no. 247/2005, as well as with other forestry or environmental regulations, the categories of data to be analysed have increased significantly (including the situation of the stands included in the catalogue of seed stand reserves and forest genetic resources, the status of stands included in natural protected areas, the status of virgin and quasi-virgin stands).
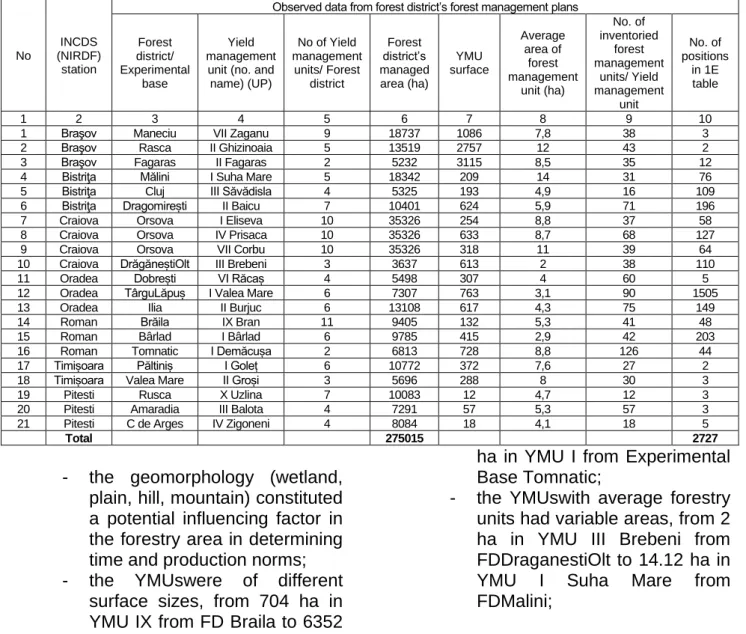
Observations on the forest management plan for preparing for the second Conference on Forest Planning were made in 19 FDs/experimental bases (Table 7), and include:
Table 7
Elements characterising the YMUs observed for use in preparing for the Second Conference onForest Planning
No
INCDS (NIRDF)
station
Observed data from forest district’s forest management plans
Forest district/ Experimental
base
Yield management
unit (no. and name) (UP)
No of Yield management
units/ Forest district
Forest district’s managed area (ha)
YMU surface
Average area of
forest management
unit (ha)
No. of inventoried
forest management
units/ Yield management
unit
No. of positions
in 1E table
1 2 3 4 5 6 7 8 9 10
1 Braşov Maneciu VII Zaganu 9 18737 1086 7,8 38 3
2 Braşov Rasca II Ghizinoaia 5 13519 2757 12 43 2
3 Braşov Fagaras II Fagaras 2 5232 3115 8,5 35 12
4 Bistriţa Mălini I Suha Mare 5 18342 209 14 31 76
5 Bistriţa Cluj III Săvădisla 4 5325 193 4,9 16 109
6 Bistriţa Dragomirești II Baicu 7 10401 624 5,9 71 196
7 Craiova Orsova I Eliseva 10 35326 254 8,8 37 58
8 Craiova Orsova IV Prisaca 10 35326 633 8,7 68 127
9 Craiova Orsova VII Corbu 10 35326 318 11 39 64
10 Craiova DrăgăneștiOlt III Brebeni 3 3637 613 2 38 110
11 Oradea Dobrești VI Răcaș 4 5498 307 4 60 5
12 Oradea TârguLăpuș I Valea Mare 6 7307 763 3,1 90 1505
13 Oradea Ilia II Burjuc 6 13108 617 4,3 75 149
14 Roman Brăila IX Bran 11 9405 132 5,3 41 48
15 Roman Bârlad I Bârlad 6 9785 415 2,9 42 203
16 Roman Tomnatic I Demăcușa 2 6813 728 8,8 126 44
17 Timișoara Păltiniș I Goleț 6 10772 372 7,6 27 2
18 Timișoara Valea Mare II Groși 3 5696 288 8 30 3
19 Pitesti Rusca X Uzlina 7 10083 12 4,7 12 3
20 Pitesti Amaradia III Balota 4 7291 57 5,3 57 3
21 Pitesti C de Arges IV Zigoneni 4 8084 18 4,1 18 5
Total 275015 2727
- the geomorphology (wetland, plain, hill, mountain) constituted a potential influencing factor in the forestry area in determining time and production norms; - the YMUswere of different
surface sizes, from 704 ha in YMU IX from FD Braila to 6352
ha in YMU I from Experimental Base Tomnatic;
18
- the YMUs where the inventory numberwas variable influenced the duration of the analysis of
the calculated volumes and their entry into the database;
Table 7 (continuation)
Observed data from forest district’s forest management plans
No. of Seed Stands
No. of forest management units that are
situated within protected
areas
No. of natural protected
areas
No. of forest management
units considered in the virgin
and quasi-virgin stand
categories
No. of functional categories/
Yield management
unit
No. of working
circles (SUP’s)
The working cirlce’sassignated
code (SUP)
No. of the printed
lists
Average area of
forest management
unit/ Forest district (ha)
11 12 13 14 15 16 17 18 19
1 140 1 12 9 5 A, E, G, K, M 16 10,39
0 0 0 0 6 3 A, K, M 16 9,78
1 349 3 93 14 4 A, E, K, M 16 7,2
1 4 1 2 8 4 A, E, K, M 15 13,06
0 1 1 0 6 2 A, M 15 4,7
0 84 2 0 4 3 A,E,M 15 8,9
0 197 3 0 10 3 A,M,E 12 8,91
0 576 4 0 11 3 A,M,E 12 8,91
0 55 3 0 8 3 A,M,E 12 8,91
0 0 0 0 3 3 A, Q, M 21 2,32
5 290 2 - 11 4 A, M,E, K 16 5,07
0 99 2 - 11 3 A, E, M 16 3,82
0 300 3 - 8 5 A, E, M, O, Q 16 5,5
0 132 3 0 4 5 E,M,X,Y,Z 45 3,18
3 167 4 0 8 6 A,E,K,M,O,Q 47 4,66
18 709 2 7 11 5 A,B,K,M,E 47 8,14
0 0 0 0 5 2 A, M 13 6,69
0 288 3 0 3 2 A, M 13 7,67
3 402 3 0 7 4 K,M,X,Z 104 3,96
3 0 0 0 5 3 A,K,M 62 4,2
2 0 0 0 5 3 A,K,M 62 5,51
37 3793 40 114 157 591
- the forest management plans of the YMUs where the data volumes were recorded in Stand Component Table (EL) tables, regarding the movement of surfaces during the period of application, significantly influenced the development of the forestry plan;
- other elements influenced the time taken, including the number of seed stand reserves, the number of stands included in natural protected areas, the number of virgin and quasi-virgin stands, the number of management subunits the stands were assigned to for their differentiated management, according to the ecological, economic and social objectives of the forests;
- the number of lists/reports calculatedby the specialised
software for data processing that need to be introduced into the forest planning projects.
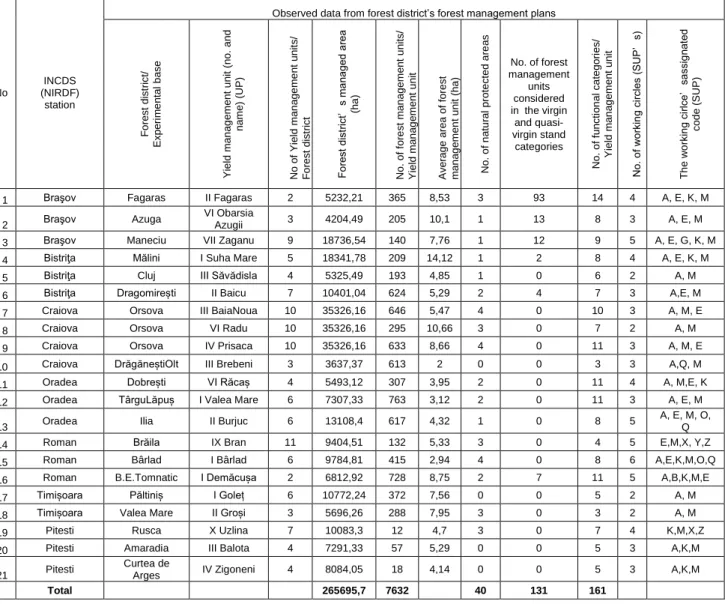
7. Drafting forest management plans for theYMUsis currently performedin the office by an engineer/subengineer, using a PC, specialised software, field notebooks, an ecotypical scheme, previous forest management plans, a design theme, the minutes of the acceptance of the fieldwork, the minutes of the approval of the fieldwork, the minutes of the First Conference of Forest Planning, the minutes of the Second Conference onForest Planning, the correspondence within the forest district, and a printer.The unit of measurement used is the YMU. Classically, the system for drafting the forest management plansfor theYMUsinvolved writing a manuscript.
19
made in 19 FDs/experimental bases (Table 8):
- the geomorphology (wetland, plain, hill, mountain) constituted a potential influencing factor in the forestry area in determining time and production norms; - the YMUs had different surface
sizes, from 704 ha in YMU IX from FD Braila to 6352 ha in YMU I from Experimental Base Tomnatic;
- theYMUswith average forestry units had variable areas, from 2
ha in YMU III Brebeni from FD DraganestiOlt to 14.12 ha in YMU I Suha Mare from FDMalini.
- the YMUs where the number of protected natural areas varied influenced the duration of the analysis of the protected objectives of the management measures from the management plans, and their implementation in the forest management plans;
Table 8
Elements characterising the YMUs observed for use in drafting forest management plans forYMUs
No
INCDS (NIRDF)
station
Observed data from forest district’s forest management plans
F o re st d ist rict/ E xp e ri m e n ta l b a se Y ield m a n a g e m e n t u n it ( n o . a n d n a m e ) ( UP ) No o f Y ield m a n a g e m e n t u n it s/ F o re st d ist rict F o re st d ist rict ’ s m a na ge d a re a (h a ) No. o f fo re st m a n a g e m e n t u n its/ Y ield m a n a g e m e n t u n it Av e ra g e a re a o f fo re st m a n a g e m e n t u n it ( h a ) No. o f n a tu ra l p ro te cte d a re a s
No. of forest management
units considered in the virgin and quasi-virgin stand categories No. o f fu n cti o n a l ca te g o ri e s/ Y ield m a n a g e m e n t u n it No. o f wo rkin g ci rcles ( S UP ’ s) T h e wo rki n g ci rlce ’ sa ssig na te d co d e ( S UP )
1 Braşov Fagaras II Fagaras 2 5232,21 365 8,53 3 93 14 4 A, E, K, M
2 Braşov Azuga
VI Obarsia
Azugii 3 4204,49 205 10,1 1 13 8 3 A, E, M
3 Braşov Maneciu VII Zaganu 9 18736,54 140 7,76 1 12 9 5 A, E, G, K, M
4 Bistriţa Mălini I Suha Mare 5 18341,78 209 14,12 1 2 8 4 A, E, K, M
5 Bistriţa Cluj III Săvădisla 4 5325,49 193 4,85 1 0 6 2 A, M
6 Bistriţa Dragomirești II Baicu 7 10401,04 624 5,29 2 4 7 3 A,E, M
7 Craiova Orsova III BaiaNoua 10 35326,16 646 5,47 4 0 10 3 A, M, E
8 Craiova Orsova VI Radu 10 35326,16 295 10,66 3 0 7 2 A, M
9 Craiova Orsova IV Prisaca 10 35326,16 633 8,66 4 0 11 3 A, M, E
10 Craiova DrăgăneștiOlt III Brebeni 3 3637,37 613 2 0 0 3 3 A,Q, M
11 Oradea Dobrești VI Răcaș 4 5493,12 307 3,95 2 0 11 4 A, M,E, K
12 Oradea TârguLăpuș I Valea Mare 6 7307,33 763 3,12 2 0 11 3 A, E, M
13 Oradea Ilia II Burjuc 6 13108,4 617 4,32 1 0 8 5
A, E, M, O, Q
14 Roman Brăila IX Bran 11 9404,51 132 5,33 3 0 4 5 E,M,X, Y,Z
15 Roman Bârlad I Bârlad 6 9784,81 415 2,94 4 0 8 6 A,E,K,M,O,Q
16 Roman B.E.Tomnatic I Demăcușa 2 6812,92 728 8,75 2 7 11 5 A,B,K,M,E
17 Timișoara Păltiniș I Goleț 6 10772,24 372 7,56 0 0 5 2 A, M
18 Timișoara Valea Mare II Groși 3 5696,26 288 7,95 3 0 3 2 A, M
19 Pitesti Rusca X Uzlina 7 10083,3 12 4,7 3 0 7 4 K,M,X,Z
20 Pitesti Amaradia III Balota 4 7291,33 57 5,29 0 0 5 3 A,K,M
21 Pitesti
Curtea de
Arges IV Zigoneni 4 8084,05 18 4,14 0 0 5 3 A,K,M
Total 265695,7 7632 40 131 161
- other elements influenced the time taken, including the number of virgin and quasi-virgin stands, the number of
20
ecological, economic and social objectives of the forests, and the number of functional categories in which the trees were classified.
8. Guidance, reception and approval of the forest management plan draft is now performedin the office by the project manager and aTechnical Comitee for Project Approval’s expert, using a PC, specialised software, field notebooks, an ecotypical scheme, previous forest management plans, a design theme, the minutes of the receipt of the fieldwork, the minutes of the approval of the fieldwork, the minutes of the first conference, the correspondence within the forest district, and a printer.The unit of measurement used is the YMU.
Observations for guidance and approval activities specificto drafting the forest management plans per YMU were made in 19 FDs/experimental bases, and included:
- the geomorphology (wetland, plain, hill, mountain) constituted a potential influencing factor in the forestry area in determining time and production norms; - the YMUshad different surface
sizes, from 704 ha in YMU IX from FD Braila to 6352 ha in YMU I from Experimental Base Tomnatic;
- the YMUs were the forestry management unit had variable areas from 2 ha in YMU III Brebeni from FDDraganestiOlt to 14.12 ha in YMU I Suha Mare from FDMalini;
- the YMUs where the number of protected natural areas varied influenced the duration of the analysis of the protected objectives of the management measures from the management plans, and their implementation in the forest management plans;
- other elements influenced the time taken for developing the
forestry management plans, includingthe number of virgin and quasi-virgin stands, the number of management subunits assigned to the stands for their differentiated management, framed in relation to the ecological, economic and social objectives of the forests, and the number of functional categories in which the stands were classified.
Comments on the context of the activities included in the drafting of the forest management plans were noted and essential operations were individualised. On this basis, the classic method for drafting forest management planswas compared with the new methodology, as described in the Working NormsforForestry Management Plans (1999 edition).
The differences in technology between the current and classic drafting methods result from:
- emergence of the modern equipment used in forestry management planning (GPS devices) that has led to new methods for field measurements;
- the development of new information products for cubic calculations, which allow the automation of operations for calculating the volumes of exploitable and inventoried trees;
21
- the creation of a new software(AS2007 – Forest management plans) for processing data and obtaining resultsfor forest management planning, allowing a reduction in the work time needed for drafting plans as a result of the additional amount of data and information that can be processed; and
- the use of PCs and the available software by all performers, allowing direct editing without a hand-written manuscript phase.
The current drafting of forest management plans involves taking information from GIS projects to determineareas values and make forestry maps, and the classic planimetric operations (classic or digital planimetry) and hand-drawing of draft maps is no longer done. GIS analytically determines the topography and creates forestry maps directly on a PC. This technological changehas improved the precision in determining the area occupied by national forest and the accuracy of the thematic maps.
GPS equipment has changed the method of measuring the boundaries of the national forest, leading to improved accuracy of boundary (which is related to the performance of the device) and reducing the amount of work involved. Thisdepends on the availability of the satellite signal and the number of available satellites.
The creation of a new software product (AS2007 –Forest management plans) has allowed a greater amount of information to be obtained andprocessed, with direct consequences for time reduction in developing forest management plans.
In summary, all the classic operations involved in the drafting of forest management plans have been transformed and adapted to incorporate new technologies, the possitive effects of
which are evident in the work of forest planning.
4. CONCLUSIONS
The operations involved in drafting forest management plans were indentified and validated, using modern technology and equipment that already exists in forest management.For each operation, the work items, job organisation, work formations, measurement units, tools and equipment, working conditions, and factors that contribute to updating the work methodologies were identified.
The observations made by all the working groups from the subunits of the National Institute for Research and Development in Forestry ‘Marin Dracea’were used to develop the time and production norms for the work of drafting forest management plans, and arecharacterised by a uniformity ofnorms at the national level. Observations were made on 19 FDs, in 21 YMUs, located in various geomorphological conditions (plain, wetland, hill, mountain).These had a diverse number of characteristic elements – elements that constituted potential factors of influence over the calculation of time and production norms.
The observationsused for drafting forest management plans were made based on an existing work methodology.
The experimental data obtained will be interpreted and analysed statistically, allowing it to be interpreted on a scientific basis, and will be used for the calculation of time and production norms in a forest management plan.
BIBLIOGRAPHY
- Achim F., 2018, Adapting and updating the time and production rules in forrest management in relation to current technologies, Phase scientific report, INCDS “Marin Dracea”;
22
Administration –Romsilva Bucharest, pp 39-41;
- Lazar A., Peiov, A., 2009, Elaboration AS2007 version in forest management, Scientific report INCDS “Marin Dracea”; - Low no. 53/2003 Work Code. Republished, updated and consolidated; - Low no. 46/2008 Forestry Code, with subsequent amendments and additions; - MAP, 2018, Technical rules of 23 iulie 2018 about the elaboration of forest management plans, modification their provisions and change the land use category of the forestry found. Ministry of Water and Forests, Official Gazette No. 730. Of 23 August 2018;
- MAPPM, 2000, Technical rules for the forest planning (Rule no.5). OM 1672/2000, Ministry of Water, Forests and Environmental Protection;
- MAPPM, 1999 - Working rules of forest management;
- MM, 1971 – Work study vol. I-VIII.
Ministry of work – ICOP;
- MMPS, 1993, Techniques and methods of organization and standardization. Ministry of work and Social Protection;