*Corresponding author Akram Vahidi
Email: [email protected] Tel: +98 930 740 8974
Article history
Received: September 09, 2013
Received in revised form: April 19, 2014 Accepted: May 06, 2014
CARBON DIOXIDE MINIMUM MISCIBILITY PRESSURE ESTIMATION
(CASE STUDY)
Akram Vahidi1*, Mohammad Ahmadi1, and Alireza Nourmohammad1
1
IOR/EOR Research Institute of National Iranian Oil Company
ABSTRACT
Carbon dioxide flooding is considered to be one of the most effective enhanced oil recovery methods for the light oil reservoirs. Depending on the operating pressure, the process might be miscible or immiscible. Minimum miscibility pressure (MMP) is the most important parameter for assessing the applicability of any miscible gas flood for an oil reservoir. The miscibility condition is determined by conducting displacement tests at various pressures and the recovery is expected to improve as the displacement pressure increases, and then stays almost constant above the MMP. In this study, the MMP of pure carbon dioxide and an Iranian oil reservoir is estimated using slim-tube test. The experiment is performed under constant CO2 injection rate and different
displacement pressures above the bubble point pressure; input and output pressures are continually monitored during the test; the effluent liquid is flashed to atmospheric conditions and produced gases are passed through gas chromatography for compositional analysis. Volumetric oil recovery is measured, and oil recovery is plotted against the injection pressure at a 1.2 pore volume of the injected fluid. The results show that the oil recovery is more than 90% of original oil in place for all the pressures with a constant slope above the bubble point pressure. Therefore, MMP is considered to be equal to the bubble point pressure. In addition to the plot of oil recovery versus pressure, miscibility is also confirmed by the effluent gas composition, slim-tube pressure drop, and visual observations of phase behavior. The single phase high pressure fluid at the outlet of slim-tube, the small pressure drop across it, and no methane bank in the composition of effluent gas indicate that the miscibility is completely achieved. The experimental results are validated by modeling the test using a fully compositional simulator. The effect of varying CO2 mole fraction in
the injected fluid is also investigated. The results show that an increase in CO2 mole fraction of the
injected gas significantly decreases MMP.
Keywords:
CO2 Injection, Minimum Miscibility Pressure (MMP), Slim Tube Test, CompositionalSimulation
INTRODUCTION
Current industry has a remarkable interest in CO2 and hydrocarbon miscible flooding. Since
1990, the production from CO2 miscible process
has increased by 49% [1].
MMP is an important parameter in the design of a miscible CO2 injection project. Miscible CO2
CO2 is injected at a pressure higher than the
MMP [2]. In petroleum terminology, minimum miscibility pressure (MMP) is the pressure at which local miscibility is achieved in a gas injection system. MMP can be measured in the laboratory using slim tube tests, rising bubble apparatus, and the method of vanishing-interfacial-tension (VIT) [3].
• The VIT technique is based on the concept that the interfacial tension between the gas and crude oil phases at reservoir temperature must be reduced to zero. The concept of zero interfacial tension at miscibility is, in turn, based on the well accepted fact that the interface between the phases must vanish as they become miscible with one another. Thus, the minimum miscibility pressure (MMP) can be determined precisely by measuring gas-oil interfacial tension as a function of pressure, down to an interfacial tension value as low as possible by measurement techniques, and then extrapolating the data to zero interfacial tension [4,5].
• Rising bubble apparatus (RBA) is an experimental technique which allows the visual observation of crude oil-solvent miscibility development. In this test, a small bubble of gas is injected into the bottom of oil column at a desired pressure and temperature; then, it moves upward through the oil to either reach equilibrium with original oil or achieve miscibility [1,6].
• Slim tube test is one of the most widely used techniques accepted as a standard mean to measure MMP in petroleum industry. This test is performed to observe actual solvent and oil interaction in a physical simulation of reservoir pore space; it can provide us with very useful and valuable information for evaluating phase behavior models used in gas injection processes [1,6].
The value of MMP depends on the composition of crude oil, the CO2 gas purity, and the reservoir
temperature [7,8,9].
There are different criteria for defining miscibility conditions from slim tube experi-ments; three of the most commonly accepted ones are as follows:
1-Total oil recovery at 1.2 PV of solvent injection is an indicative of a first contact miscibility (FCM) process;
2-Change in the slope of oil recovery versus displacement pressure;
3-90% oil recovery at 1.2 PV of solvent inject-tion is an indicative of multi contact miscibility (MCM) process.
To get the best assessment of solvent-oil miscibility conditions, it is proposed to collect a complete set of parameters during each test. The recommended set, in order of importance, consists of [10,11,12]:
• Effluent gas composition;
• Visual observation of high pressure effluent phase behavior;
• Pressure drop across slim tube;
• Oil recovery.
The purpose of this work is to determine the miscibility conditions of CO2 and an oil sample
from one of Iranian oil reservoirs using slim tube test. Then, the displacement process was numerically modeled with GEM commercial simulator. Finally, the effect of injected gas composition was investigated.
Material and Method
Table 1: Reservoir fluid properties
Composition Recombined Oil
N2 0.179
C1 39.932
CO2 0.954
C2-C4 14.86
C5-C6 6.68
C7 +
37.397 Bubble point pressure (MPa) 16.94 Density of reservoir fluid at Pb 0.7428
Molecular weight Measured
(gr/grmol) 208.73
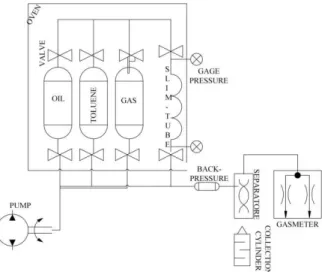
The experimental set-up and procedure were designed based on the literature available on the subject [1,9,13,14]. Figure 1 is a schematic of slim tube equipment used to evaluate injected gas- reservoir oil miscibility condition.
Figure 1: A schematic of slim tube apparatus
The slim tube is 69.38 ft long and 0.148 inch in diameter, packed with glass beads. It was initial-ly cleaned and vacuumed, and then porosity and permeability were determined as reported in Table 2.
Table 2: Slim tube properties Slim-tube properties Glass bead size 149-105 (µm)
Porosity 30%
Permeability 9.11 D
Stock tank oil was injected while the back pressure regulator was gradually brought up to maintain the pore pressure at the desired test pressure. Two pore volumes of the recombined oil were used to displace the stock tank oil to saturate the slim-tube with live oil. After reach-ing temperature stabilization at reservoir tem-perature, the slim-tube is ready for CO2
injection. Solvent injection was then begun at a rate of 6 cc/hr (0.005 cf /day) and continued until 1.2 PV solvent has entered the tube. The produced liquid was collected in a graduated cylinder to measure its volume, and the produced gas was also passed through a gas chromatography (GC) for compositional analysis.
RESULTS AND DISCUSSION
Slim tube miscibility test was performed at 87 °C for CO2 and an oil sample of Iranian reservoir
fluids. Tests were conducted at the injection pressures ranging from 17.24 to 25.51 MPa; the results are reported in Figures 2 to 6. Each experiment was performed at a constant injection rate. The oil recovery after the injection of 1.2 pore volumes (PV) of CO2 is
miscible. In addition to oil recovery, other parameters must also be considered during each test such as effluent gas composition and pressure drop across the slim tube.
Figure 2: Oil recovery versus test pressures
Figure 3: Oil recovery versus injected PV
Figure 4: Pressure drop versus injected PV
Figure 5: Mole fraction of C1 in the effluent gas versus injected PV
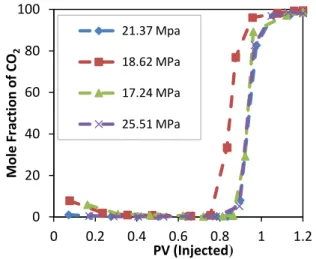
Figure 6: Mole fraction of CO2 in the effluent gas versus injected PV injected
The vaporization process is the most important mechanism in building-up miscibility condition during CO2 injection. In a miscible displacement
process, carbon dioxide can displace oil efficiently by developing a miscible bank through vaporizing the intermediate compo-nents of oil. The criteria distinguishing the vaporizing drive mechanism are:
1-
No C1 peak in the effluent gas;2-
Single phase flow at high pressure;3-
Small final pressure drop across the slim tube;4-
Recovery equal to or greater than 90% at 1.2 PV of solvent injection.Considering Figure 4, the pressure drop across the slim tube is initially high at the beginning of gas injection to initiate the displacement
80 85 90 95 100
15 17 19 21 23 25 27
O
il
R
e
co
v
e
ry
(%
)
Pressure (MPa)
0 0.2 0.4 0.6 0.8 1
0 0.2 0.4 0.6 0.8 1 1.2
O
il
R
e
co
v
e
r
y
(
%
)
PV (injected)
17.24 MPa
18.62 MPa
21.37 MPa
25.51 MPa
0 20 40 60 80
0 0.2 0.4 0.6 0.8 1 1.2
P
re
ss
u
re
d
if
fr
e
n
ce
(
p
si
)
PV (Injected)
17.24 MPa
21.37 MPa
18.62 MPa
25.51 MPa
0 20 40 60 80
0 0.2 0.4 0.6 0.8 1 1.2
M
o
le
f
ra
ct
io
n
o
f
C1
PV (Injected)
17.24MPa
18.62 MPa
21.37 MPa
25.51 MPa
0 20 40 60 80 100
0 0.2 0.4 0.6 0.8 1 1.2
M
o
le
F
ra
ct
io
n
o
f
C
O2
PV (Injected)
21.37 Mpa
18.62 MPa
17.24 MPa
process, but it becomes lower and lower; therefore, the entire displacement process is considered at a constant pressure. In fact, the pressure drop reflects the flow conditions in the slim tube test. If 90% or more of the oil has been displaced by the injected gas, the pressure drop must approach a value which can be calculated from Darcy equation using the absolute permeability of slim tube, injection rate, and the solvent viscosity. Miscibility condition achieve-ment is also confirmed using the flashed gas compositions. During the test, the produced gas was collected in a gas meter and analyzed. Figure 5 demonstrates the mole fraction of methane in the effluent gas; no methane bank was observed in all the tests which, was an indication of miscible condition achievement. The mole fraction of CO2 in effluent gas is shown
in Figure 6, which evidences no early solvent breakthrough for all the tests (the breakthrough exists almost at 0.83-0.88 PV injection).
For further analysis, the experimental results were validated by modeling the test using a fully compositional simulator.
Simulation
The Win Prop software package was used to simulate the experiments performed in the lab and to tune an EOS model for compositional simulation purposes. The experimental data used to model the fluid sample are oil tion, bubble point pressure, constant composi-tion expansion test (CCE), differential libracomposi-tion test (DL), and swelling test. Three parameters of the Peng-Rabinson equation of state were used to model the fluid behavior. Finally, the tuned model was exported to the compositional simulator (CMG-GEM) to simulate slim tube displacement tests. A one dimensional slim tube 21 meters in length, with a permeability of 9.3 Darcy, and 30% porosity was modeled. The straight line miscible relative permeability was used in this model and the numerical dispersion
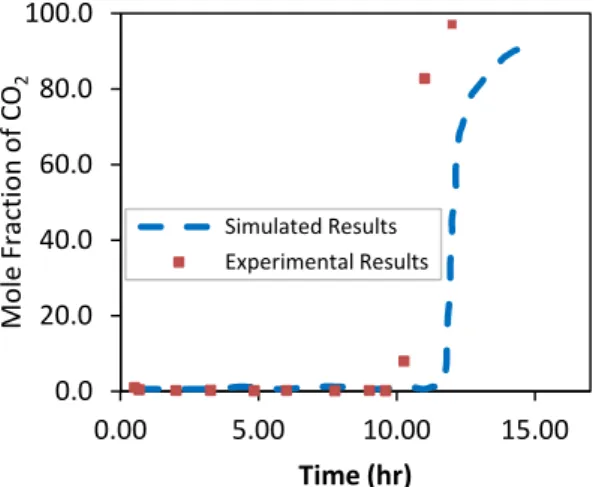
was reduced by increasing and optimizing the number of simulation grid blocks. The laboratory measured oil recovery and effluent gas composi-tion profile were predicted by the simulator for all the tests. Figures 7 to 10 show that there is good agreement between the simulated and experimental data of oil recovery and effluent gas composition at different injection pressures.
Figure 7: Oil recovery factor versus time (at 17.24 MPa)
Figure 8: Mole fraction of CO2 versus time (at 17.24 MPa)
Figure 9: Oil recovery factor versus time (at 18.62 MPa)
0.0 20.0 40.0 60.0 80.0 100.0
0.00 5.00 10.00 15.00
O
il
R
e
co
v
e
ry
(%
)
Time (hr)
Simulated Results Experimental Results
0.0 20.0 40.0 60.0 80.0 100.0
0.00 5.00 10.00 15.00
M
o
le
F
ra
ct
io
n
o
f
C
O2
Time (hr) Simulated Results Experimental Results
0.0 20.0 40.0 60.0 80.0 100.0
0.00 5.00 10.00 15.00
O
il
R
e
co
v
e
ry
(
%
)
Time (hr)
Simulated Results
Figure 10: Mole fraction of CO2 versus time (at 18.62 MPa)
The analysis of the simulation results clearly shows that three different zones exist during the displacement of oil by CO2 injection:
1-A virgin zone that is the leading zone during the displacement process. This zone was identified by analyzing the composition of the produced crude oil and gas. No com-positional change exists in this zone. 2-A second zone, the two-phase flowing zone,
which includes compositional change. The composition profile shown in Figure 11 suggests that the vaporization is very strong at the beginning of the process at the leading edge of the second zone. Having straight lines of different slopes in the composition profile is a direct consequence of variation in vaporization rates. Behind the leading edge of the second zone, the slope of composition profile decreases due to the reduction of vaporization rate during the advancement of the displacement process until the vaporization rate is reduced to zero. 3-A third zone which is the single-phase flowing
zone. The beginning of this zone was detected from the point at the com-position profile where either carbon dioxide fraction was sharply increased or hydrocarbon fraction was drastically reduced.
Figure 11: Mole fraction of C2-C3 in block 1500, 1, 1
According to the simulation results shown in Figure 12, there is a significant reduction in liquid density at miscible bank while the trend is completely different behind this bank; in other words, liquid density increases very sharply due to the stripping of the light components of crude oil.
Figure 12: Oil viscosity and density in block 1500, 1, 1
According to Figure 12, the change in viscosity also indicates that the phenomenon of vaporiza-tion takes place during the displacement pro-cess. It is evident that mobility ratio is improved because of the changes in viscosities of both phases at the leading edge of the second zone; the viscous fingering is also reduced as a consequence of reduced mobility ratio. There-fore, finally a more efficient displacement process is obtained.
0.0 20.0 40.0 60.0 80.0 100.0
0.00 5.00 10.00 15.00
M o le F ra ct io n o f C O2 Time (hr) Simulated Results Experimental Results 0.00 0.02 0.04 0.06 0.08 0.10 0.12
0.0 5.0 10.0 15.0
M o le F ra ct io n o f C2 -C3 in B lo ck (1 5 0 0 ,1 ,1 ) Time (hr) 0.0 0.1 0.2 0.3 0.4 0.5 35 40 45 50 55
0 3 6 9 12 15 18
Theoretically, fully miscible conditions can be achieved when the interfacial tension approaches zero. In most cases, just partial miscibility can be achieved during a multi contact process since the interfacial tension cannot reach zero. In this study, the interfacial tension never reaches the theoretical value of zero; moreover, the crude oil recovery of less than 100% suggests by itself that the partial miscibility was achieved during this displacement.
The effect of injected fluid composition on minimum miscibility pressure was also invest-tigated using the numerical model; first, pure nitrogen was injected at different pressures above the bobble point pressure, and then the flue gas (15% CO2 and 85% nitrogen) was used
as the injection gas.
According to Figures 13 and 14, the MMP of pure nitrogen and flue gas are respectively about 28.27 and 25.51 MPa, which are much higher than that of CO2. The simulation study
shows that increasing the CO2 content of the
injection gas causes the IFT to be decreased and consequently the transition zones to be shrunk, which finally results in late breakthrough, more oil recovery, and less residual oil left behind in the swept zone. Actually, the dissolution of CO2
in oil results in oil swelling and a reduction in oil viscosity, which leads to higher oil recovery.
Figure 13: Oil recovery versus injection pressures at 1.2 PV of Nitrogen injection
Figure 14: Oil recovery versus injection pressures at 1.2 PV of flue gas injection
CONCLUSIONS
According to the results, the following conclusions can be drawn:
1-Obtained minimum miscibility pressure of CO2 in the Iranian oil sample from slim tube
test is about 16.54 MPa, which is almost equal to the bubble point pressure of the oil sample;
2-Effluent gas composition, pressure drop across the slim tube, and the solvent breakthrough time must also be considered to confirm the miscibility conditions; 3-No methane bank is observed in all the
tests and the pressure drop across the slime tube is generally small, which confirms miscibility condition achievement; 4-The minimum miscibility pressure of nitrogen and flue gas in this oil sample is much higher than that of CO2;
5-The simulation studies show that the ultimate oil recovery of CO2 injection is
higher than other gases (i.e. nitrogen and flue gas), and the reason is the swelling of the oil phase by CO2.
ACKNOWLEDGMENT
This research has been done in the Enhanced Oil Recovery Department of Research Institute of National Iranian Oil Company and the financial support of Research and Technology (R&T) Department of National Iranian Oil Company is
0 20 40 60 80 100
15 20 25 30 35
O
il
R
e
co
v
e
ry
(
%
)
Pressure (MPa)
MMP= 28.27 MPa
0 20 40 60 80 100
15 20 25 30 35
O
il
R
e
co
v
e
ry
(
%
)
Pressure (MPa)
gratefully appreciated.
REFERENCES
[1] Huang S. S. and Dyer S. B., “Miscible Displacement in the Wayburn Reservoir: A Laboratory Study,” Journal of Canadian Petroleum Technology JCPT, 1993, 32, 42-52.
[2] Orr Jr. F. M., Silva M. K., Lien C. L., and Pelletier M. T., “Laboratory Experiments to Evaluate Field Prospects for CO2
Flooding,” Journal of Petroleum Tech-nology JPT, 1982, 34, 888-898.
[3] Teklu W. T., Ghedan S. G., Graves. R. M., and Yin X., “Minimum Miscibility Pressure Determination: Modified Multiple Mixing Cell Method,” SPE Conference Paper, 155454-MS, 2012.
[4] Rao D. N., “A New Technique of Vanishing Interfacial Tension for Miscibility Deter-mination,” Fluid Phase Equilibria, 1997, 139, 311-324.
[5] Rao D. N. and Lee J. I., “Evaluation of
Minimum Miscibility Pressure and
Composition for Terra Nova Offshore Project Using the New Vanishing Inter-facial Tension Technique,” SPE/DOE Improved Oil Recovery Symposium, Tulsa,
2000.
[6] Novosad Z., Sibbald L. R., and Costain T. G., “Design of Miscible Solvents for a Rich Gas Drive-comparison of Slim Tube and Rising Bubble Tests,” 90-01-03 PETSOC Journal Paper, 1990, 29, 37-42.
[7] Alarcon A. and Felipe C., “A Laboratory Study with a Light Crude Oil to Determine the Effect of High-pressure Nitrogen
Injection on Enhanced Oil Recovery,” Ph.D. Thesis, University of Oklahoma,
1982.
[8] Alnetaifi A. S., “Experimental Investigation of CO2 Miscible Oil Recovery at Different
Conditions,” Ph.D. Thesis, King Saud University, 2008.
[9] WU R. S. and Batycky J. P., “Evaluation of Miscibility from Slim Tube Tests,” Journal of Canadian Petroleum Technology JCPT,
1990, 29, 63-70.
[10] Graue D. J. and Zana E., “Study of a Possible in the Rangely Field, Colorado,” Chevron Oil Field Co., Fifth Symposium on improved methods for oil recovery of SPE, Tulsa, 7060, 2003.
[11] Holm L. W. and Josendal V. A., “Mecha-nisms of Oil Displacement by Carbon Dioxide,” 4736-PA SPE Journal Paper,
1974, 26, 1,427-1,438.
[12] Yellig W. F. and Metcalfe R. S., “Determination and Prediction of CO2
Minimum Miscibility Pressures,” Journal of Petroleum Technology JPT, 1980, 32, 160-168.
[13] Randall T. E. and Bennion D. B., “Recent Developments in Slime Tube Testing for HCMF Solvent Design,” presented in the Petroleum Society of CIM, held in Rejina,
1987.