27
http://jpst.ripi.ir Journal of Petroleum Science and Technology 2019, 9(3), 27-45
© 2019 Research Institute of Petroleum Industry (RIPI)
ABSTRACT
The lateral sealing ability of a normal fault is a major factor in creating hydrocarbon traps. Therefore, a methodology for assessing the sealing ability of faults in the siliciclastic sequences of subsidence basins has been established; moreover, by using this methodology, the uncertainty inherent in hydrocarbon exploration can be decreased.
Moreover, the petrophysical properties of fault rocks and reservoirs are emphasized by the methodology. In addition, the petrophysical properties of fault rocks and reservoirs are mainly determined based on clay contents and compaction pressure according to experiments on manmade rock samples which are representative of the researching area.
Furthermore, by using this methodology, the petrophysical properties of fault rocks and reservoirs, which are mainly determined based on clay content and compaction pressure according to experiments on manmade rock samples representative of the researching area are emphasized.
Thus, the lateral sealing ability of the fault can be assessed as follows: First, a best-fit equation describing the displacement pressures, clay contents, and compaction pressures of the rock samples is established by us. Then, the positive pressure on the fault plane from the decomposition of effective overburden pressure is calculated; afterwards, the clay content of the fault rock (Shale Gouge Ratio) is calculated by us.
Finally, the displacement pressures of the fault rock and the juxtaposed reservoir rock are predicted. Ultimately, based on this study which has been carried out, the results for the case study of the Tangjiahe fault in Well Gang 64, in the western part of the Qikou Sag, China coincide with the exploration results, which this coincidence confirms that this methodology is capable of evaluating the lateral sealing ability of faults in certain geologic settings.
Keywords: Normal Fault, Lateral Fault Sealing, Siliciclastic Sequences, Fault Rock, Displacement Pressure. Jijian Shi
School of Geoscience, Northeast Petroleum University, Daqing, China
Quantitative Evaluation of the Lateral Sealing Ability of Normal Faults in
Siliciclastic Sequences: Implication for Fault Trap in Well Gang 64, in the
West Qikou Sag, China
*Corresponding author
Jijian Shi
Email: [email protected] Tel: +13 93 675 9620
Fax: +13 93 675 9620
Article history
Received: July 7, 2018
Received in revised form: December 7, 2018 Accepted: December 8, 2018
INTRODUCTION
The lateral sealing ability of a fault is an important factor in creating hydrocarbon traps in rift basins. In a production/development context, it has been recognized that the presence of lateral seals results in different hydrocarbon contents across a fault, while producing reservoirs with faults has poor flow performances [1 to 8]. Therefore, the possibility that hydrocarbons can flow through the juxtaposed rocks across the fault within faulted oil-gas fields, which is one of the key factors controlling trap effectiveness, has attracted a great deal of interest. Although universal agreement has not been reached concerning lateral sealing classification, two types of lateral sealing, which control the sealing behavior of fault in siliciclastic sequences, have already been recognized: (1) juxtaposition sealing and (2) fault rock sealing [9 to 15]. In the case of the first type of lateral sealing, given the fact that the fault cuts a sequence of beds along a single 3D plane, rocks with different lithologies or petrophysical properties, e.g. different porosities, permeabilities, capillary entry pressures, within the hanging wall and footwall can be juxtaposed when the hanging wall of a normal fault moves downward. So, juxtaposition seals can be produced by a permeability gradient among the different rocks juxtaposed across the fault plane. Moreover, reservoir juxtaposition areas across a fault surface were identified (by Allan in 1989, Knipe in 1992, and Lindsay in 1993) to qualitatively evaluate the lateral sealing ability of a fault using previously mapped horizons; in addition, a refined reservoir stratigraphy was defined by isochores at the fault surface [1,13,16].
In the case of the second type of lateral sealing, it
is thought that the fault rock, which has a lower permeability and a lower capillary threshold pressure than the reservoir rock, can provide a barrier to hydrocarbon migration even if reservoir rock is positioned against reservoir rock. Also, fault rocks are composed of different types of host rocks entrained into the fault zone, which is not a single-plane, but a series of fault planes or a network of small fault segments, during fault displacement and subsequent evolution. Therefore, many methods have been developed to predict the permeability and capillary threshold pressure of the fault rock [6,17,18] based on knowledge of the faulting processes [19 to 23], the fault’s architecture [23,24,26-29] , the fault’s population [30 to 33]and the lithological combination within the fault zone [18,24,34,35].
Moreover, this information can then be used to evaluate the lateral sealing ability and hydrocarbon column quantitatively. At present, there are three main ways to evaluate the lateral sealing ability of a fault based on its petrophysical properties [34-41].
a. Estimating the profile thickness of a shale layer along the fault zone during faulting based on the parameters of the shale smearing factor (SSF) [16] and the clay smear potential (CSP) [2,42,43] . b. Statistical methods of predicting the average proportion of fine grained material entrained into the fault gouge from the host rocks such as the shale gouge ratio (SGR) [44 to 49].
c. The fault rock-reservoir displacement pressure difference method, which evaluates the petrophysical properties of the fault rock based on the clay content and the diagenetic grade [16,18,50,51].
http://jpst.ripi.ir
29
Journal of Petroleum Science and Technology 2019, 9(3), 27-45© 2019 Research Institute of Petroleum Industry (RIPI)
effective fluid flow barrier because of its very low porosity and permeability [4,5], all of the parameters in the first method are used to estimate the relative amount of clay that has been smeared from individual shale source beds at a certain point along a fault plane based on the thickness of the faulted mudstone sequence and the fault throw/ distance from the source bed. The relatively good quality of the SSFs and CSPs combined with the presence of oil and gas in connection with the faults confirms that they form an inferior boundary when the clay smear becomes discontinuous, and the lateral sealing capability decreases to the point of failure.
However, the first approach may be difficult to apply directly in thick heterogeneous sequences because it is not feasible to map every shale bed and consider its effect at the fault’s surface. In addition, the SGR algorithm, which is the percentage of shale or clay in the slipped interval, is a simpler approach that considers only the bulk properties of the sequence at the scale of the reservoir mapping of the second method. In addition to the SGR calibration for the area, it is important to explicitly know the across-fault pressure differences measured from wells on both sides of the fault. Then, a typical threshold between the minimal across-fault pressure difference and the significant seal can be defined. Therefore, the second method is more advanced than the first method for quantitatively evaluating the lateral sealing capacity of faults. Moreover, the proposition of the SGR algorithm is necessary for scholars evaluating the lithologic characteristics of fault rocks quantitatively. However, there are still some flaws. First, this method is not based on the sealing theory, and the result of the risks associated with fault-controlled prospects obtained by this method
is only of statistical significance. Furthermore, any study that uses the SGR to predict the fault-sealing ability should not be attempted if there are not any sufficient pressure data from existing local reservoirs to calibrate during the exploration stage. The third method overcomes the problems that the second method cannot resolve. As the lateral sealing properties of the fault can be evaluated based on the capillary threshold pressure or the displacement pressure (Pd) between the reservoir and the juxtaposed fault rocks [6,17,18], hydrocarbon flow across the fault zone will not occur unless the capillary pressure of the fault rocks is less than that of the reservoir. On the contrary, the hydrocarbons cannot flow across the fault zones. In addition, if the faults were lateral sealings, the displacement pressure difference between the reservoir and the juxtaposed fault rocks can be used to predict the hydrocarbon column height of the reservoir. So the key factor involved in this method is to be able to accurately calculate the petrophysical properties of the reservoir and the fault rock.
pressure of rocks within fault zones [43]. This suggests that cataclasis involves nearly the same micro-deformation mechanisms in similar geologic settings, e.g., similar burial depths, fault stress fields, etc. [53]. In addition, cemented faults and/or fractures are the most common result of deformation related cementation, which can effectively reduce the permeability and porosity. The cement seals are associated mostly with the sites where local dissolution and reprecipitation occur during deformation or along the invasion paths of fluid into the faults [54]. So the source of cementation can be internal or external, but it is pointed out by Fisher and Knipe in 1998 [35] that natural oil/gas field examples do not always require an external fluid source to control the sealing properties of the fault zones, especially on a large scale where the external fluids do not promote continuous cementation for extensive sealing. Thus, the internal source of cementation was a pressure solution of quartz particles, and the hydration reaction of clay minerals is more important for decreasing the porosity and permeability of the fault rock. Conversely, the dissolution of the minerals in fault rocks can increase porosity and permeability, which results in conduits for fluids. Furthermore, in some natural oil/gas fields, the burial depth, causes the interaction between the temperature history and the stress history, can also alter the petrophysical properties of the fault rocks within the fault zones, i.e. the quartz cementation and pressure solution occur rapidly when the temperature exceeds 90 °C [39] and the permeability of the fault zone decreases with an increase in confining pressure [55]. In addition to the temperature and stress histories, geological
time is the third factor influencing the permeability evolution of the fault zone, which indicates that the same fault zone can have different sealing properties through time [56].
Unfortunately, there are no robust methods that take all of these factors into account to predict the petrophysical properties of fault rocks despite these developments. Ultimately, any method developed to predict the fluid flow properties of faults in the subsurface requires an understanding of the main factors controlling the fault’s permeability. A case study of the North Sea and Norwegian Continental Shelf by Fisher and Knipe in 2001 [18] plotted the permeability of fault rocks versus the clay content of the host rocks for various fault rock types. Another case study involving transmissibility multipliers performed calculations using realistic fault rock property data (thickness, permeability, and clay distribution within the reservoir), which was previously used in production simulation models [24,45,57,58]. However, the input of accurate geologic data into these models is vital that the predictive capability be increased. At present, for normal faults in tectonically inactive, extensional, continental, sedimentary basins, significant success has been achieved in developing a new algorithm for predicting the displacement pressure of fault rocks based on the main factors affecting the study area, e.g. clay content and stress history, as well as analysis of all of the factors affecting the petrophysical properties of the fault rocks.
http://jpst.ripi.ir
31
Journal of Petroleum Science and Technology 2019, 9(3), 27-45© 2019 Research Institute of Petroleum Industry (RIPI)
from experimental data on the controlling factors and avoiding the use of the input of a large amount of accurate geologic data as the transmissibility multipliers. This means that it is suitable for risk analysis of traps in a petroliferous basin in the early and intermediate stages of exploration. Furthermore, our approach is applied to the fault trap in Well Gang 64 in the Northern Dagang burial hill structural belt of the Qikou Sag. The predicted accumulation of oil and gas in the trap was in agreement with the current oil-gas distribution, which confirms the correctness of the method in this oil-gas field. Finally, we present the ideas and workflow of the new algorithm for evaluating lateral sealing ability, and we hope to apply it to other areas of the world. In future studies, we will investigate and summarize the cementation, tectonic movement, and temporality on the petrophysical properties of fault rocks.
EXPERIMENTAL PROCEDURES
METHODOLOGY
Prediction of the Displacement Pressure
of Siliciclastic Rocks
The quality of a seal is determined by the minimum pressure, i.e. the displacement pressure (Pd), required to force hydrocarbons into the water saturated pores or fractures of the seal at a given time. Previous studies have concluded that the displacement pressure of the siliciclastic rocks is primarily governed by their porosity and lithology [59]. Compaction is a purely mechanical process in which the porosity decreases in response to the increased effective stress caused by mechanical compaction [60,61], and the porosity-vertical effective stress curves for rocks with differing clay fractions have been drawn to illustrate the wide
range of compaction behavior. The relationship between the clay content and the void ratio at the liquid limit for fine-grained clastic sediments has been established by Yang in 2004 [62]. In addition, it has been concluded that the clay content is a reasonable measure of the overall grain size distribution of mudstones. It seems likely that a fairly strong relationship exists, although it is currently lacked a quantitative model that describes the displacement pressure of seals as a function of the compaction and clay content. In fact, cementation and dissolution also play an important role in the evolution of the petrophysical properties of rocks and fault rocks. However, the porosity-depth relationship baseline depends on the mechanical compaction; whereas, dissolution and cementation cause the porosity of the rocks to fluctuate around the baseline.
following experiment was conducted.
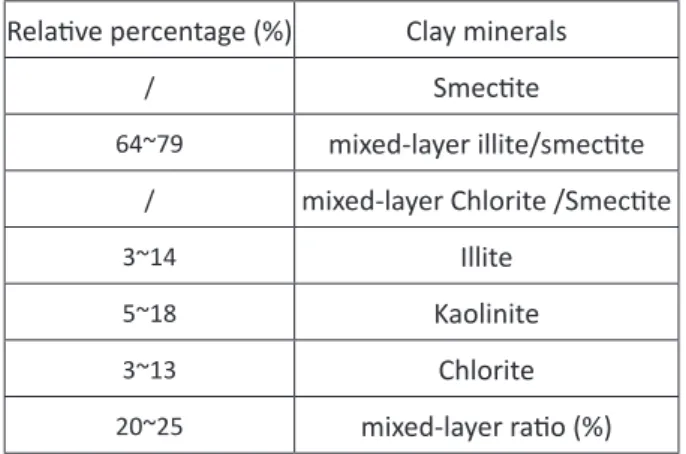
The materials used were silt (370-mesh quartz sand), clay (obtained by crushing and sieving the mudstone from downhole in the Qikou Sag with a clay content of >95%), and distilled water. The compositions of the clay minerals are shown in Table 1.
Table 1: Relative content of clay minerals of mudstone samples from Qikou Sag through XRD analysis.
Relative percentage (%) Clay minerals
/ Smectite
64~79 mixed-layer illite/smectite
/ mixed-layer Chlorite /Smectite
3~14 Illite
5~18 Kaolinite
3~13 Chlorite
20~25 mixed-layer ratio (%)
The clay and silt according to the following ratios: 100:0, 80:20, 60:40, 40:60, and 20:80 have been mixed. Then, they are poured into the mixer, then stirred, and afterwards, keep them wet with a nebulizer until they reach a certain humidity. The clay and silt mixtures were then placed in a compaction mold (2.5 cm diameter cylindrical cavity) (Fig. 1), and pressure (1 MPa, 5 MPa, 10 MPa, and 15 MPa) was applied by pressure bars using a manual pressure pump to simulate compaction. The compaction process under each pressure was maintained for 4 hours. Further, 20 core columns were removed from the compaction mold and were placed in a chamber with a constant temperature of 40 °C until the cores were dry. Finally, the 20 man-made core samples with different compaction pressures and clay contents were obtained for use in the displacement pressure tests (Figure 1).
Figure: 1 Manmade rock preparation equipment and image of 2.5-cm diameter man-made core sample.
During the man-made core sample displacement pressure tests, first, they were evacuated, and then, they were saturated with kerosene. After a few days (generally more than 96 hours), they were taken out of the pressure chamber and tested using a PYC-1 displacement pressure tester (Figure 2).
Figure 2: Experimental equipment (PYC-1) for testing displacement pressure on rocks.
http://jpst.ripi.ir
33
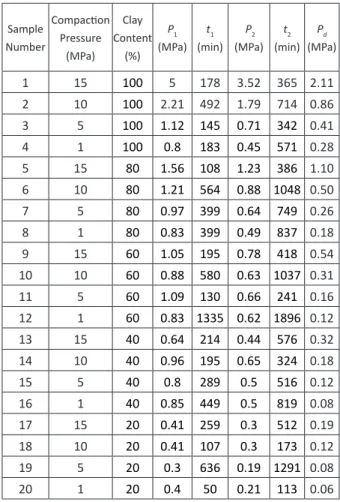
Journal of Petroleum Science and Technology 2019, 9(3), 27-45© 2019 Research Institute of Petroleum Industry (RIPI) Table 2: Results of the displacement pressure tests on
the manmade core samples.
Sample Number Compaction Pressure (MPa) Clay Content (%) P1 (MPa) t1 (min) P2 (MPa) t2 (min) Pd (MPa)
1 15 100 5 178 3.52 365 2.11
2 10 100 2.21 492 1.79 714 0.86
3 5 100 1.12 145 0.71 342 0.41
4 1 100 0.8 183 0.45 571 0.28
5 15 80 1.56 108 1.23 386 1.10
6 10 80 1.21 564 0.88 1048 0.50
7 5 80 0.97 399 0.64 749 0.26
8 1 80 0.83 399 0.49 837 0.18
9 15 60 1.05 195 0.78 418 0.54
10 10 60 0.88 580 0.63 1037 0.31
11 5 60 1.09 130 0.66 241 0.16
12 1 60 0.83 1335 0.62 1896 0.12
13 15 40 0.64 214 0.44 576 0.32
14 10 40 0.96 195 0.65 324 0.18
15 5 40 0.8 289 0.5 516 0.12
16 1 40 0.85 449 0.5 819 0.08
17 15 20 0.41 259 0.3 512 0.19 18 10 20 0.41 107 0.3 173 0.12
19 5 20 0.3 636 0.19 1291 0.08
20 1 20 0.4 50 0.21 113 0.06
The formula for calculating the displacement pressure of each sample was mainly based on the equation derived from Poiseuille’s Law.
(
)
( )
2 8 − = = − dx r P Po d
V .
dt ì L x t q (1)
where V ̇ is the flow rate, x is the amount of displacement liquid, t is the displacement time or breakthrough time, P is the gas pressure applied in the lab, ro is the radius of the maximum connected aperture, μ is the liquid viscosity, L is the length of the rock sample, and q is the hydrodynamic bending.
By integrating and rearranging Equation 1, the following equation is obtained:
(
)
2 2 2 4 = − o d L q ì t .r P P (2) μ
μ
The gas pressures and breakthrough times of each sample were substituted into Equation 2 and simplified to obtain the following equation for displacement pressure.
2 2 1 1 2 1
− =
−
d
P t P t
P .
t t (3)
where P1 is the gas pressure from the first experiment, P2 is the gas pressure from the second experiment, t1 is the breakthrough time from the first experiment, and t2 is the breakthrough time from the second experiment.
By using Equation 3, the displacement pressure of each man-made core sample could be calculated using the second pressure and the time data obtained from the tests.
After this, the relationship between the displacement pressures of the man-made core samples, their clay contents and compaction pressures was analyzed. It is found out that when the clay contents of the samples has been the same, the higher the sample compaction pressure is, the greater the displacement pressure is. Also, when the compaction pressures of the samples are the same, the displacement pressure of the samples increases exponentially with increasing clay content (Figure 3).
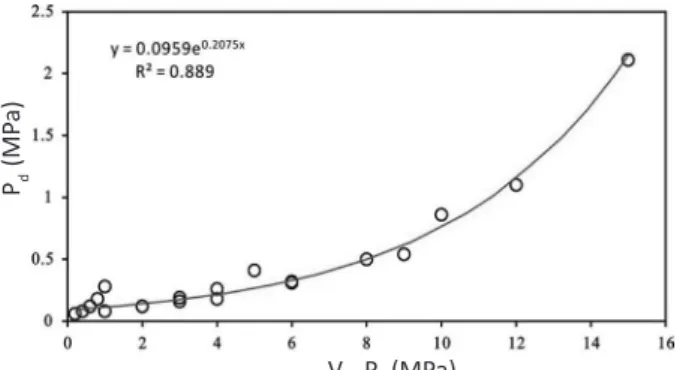
Based on the above findings, further analysis was conducted to reveal the positive relationship between the man-made core displacement pressure and the product of the compaction pressure and the clay content (Figure 4). Thus, the displacement pressure of the rocks based on this relationship can be predicted.
Figure 4: Relationship between the displacement pressures (Pd) of the manmade rock samples and the products of their compaction pressures (Pc) and clay contents (Vsh). It shows that the displacement pressure values increase exponentially with an increase in the products of their compaction pressures (Pc) and clay contents (Vsh).
Evaluation Process for Determining the
Lateral Sealing Ability of a Fault
According to the previously described third evaluation method for evaluating the lateral sealing ability of a fault, the workflow of the method which has been established by us is as follows:
First, it is assumed that the fault rock has been formed by fault debris and is located along the fault surface formed by the positive pressure of the plane. Therefore, the fault rock displacement pressure depends on its clay content and the section pressure. Then, by substituting the above two parameters into the fitting formula for the displacement pressure and the product of the clay content and the compaction pressure established using the measured rock data from the study area, the displacement pressure of the fault rock can be predicted. Similarly, it is also possible to predict the reservoir displacement pressure. Finally, the
lateral sealing ability of the fault can be quantitatively predicted.
a. Defining the relationship between the effective overburden pressure and the burial depth.
It is necessary to establish the relationship between the rock density and depth and to calculate the effective overburden pressure at each depth using the following equation (Equation 4):
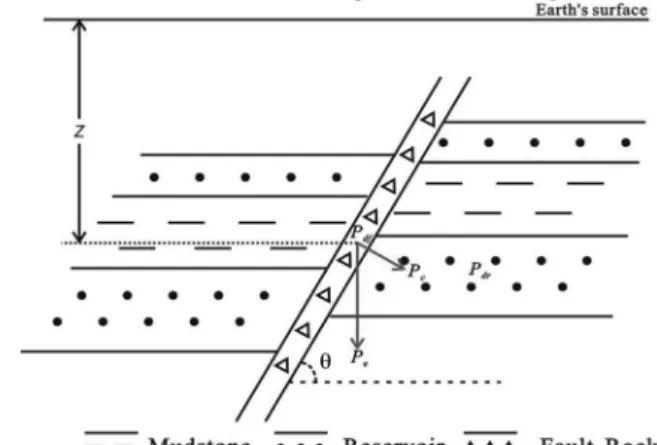
Pe = ρZ . (4) where Z is the depth (m), ρ is the average density of the rock frame above depth Z (kg/m³), Pe is the effective overburden pressure at depth Z (MPa). b. Calculating the compaction of the fault rocks The effective overburden pressure on the fault plane can be decomposed into two mutually perpendicular forces. One is perpendicular to the fault plane, and the other is parallel to the fault plane. Moreover, previous studies have concluded that both the vertical mechanical compaction and the lateral extrusion affect the petrophysical properties of the rocks [65,66]. According to a study in the Tarim Basin, it is concluded by Gao in 2018 that the porosity loss caused by lateral structure compression has been 2.5-23.6% of the bulk porosity loss of sandstones [66]. However, the fault rocks distributed in the fault zone, which is mainly compacted by the positive pressure perpendicular to the fault plane and is rarely affected by the extrusion stress parallel to the fault plane after the fault activity stops, are different from the normal sedimentary strata. Furthermore, the target area, i.e. the Qikou Sag. mainly experienced extensional after the formation of the fault. Therefore, the compaction pressure on the fault rock is equivalent to the positive pressure on the fault plane caused by the gravity of the overlying stratum when there is no overpressure. The following equation explains
Pd
(MP
a)
http://jpst.ripi.ir
35
Journal of Petroleum Science and Technology 2019, 9(3), 27-45© 2019 Research Institute of Petroleum Industry (RIPI)
the mentioned tip.
Pc= Pe cos θ = ρZ cos θ . (5) where Pc is the positive pressure on the fault surface (MPa), which is equivalent to the compaction pressure in the experiment above, and θ is the fault dip angle (
°
).c. Calculating the clay content of the fault rock The shale gouge ratio (SGR) has been defined by Yielding et al in 1997 [44] for describing the bulk properties of fault rocks based on the assumption that debris from the shale/clay beds, which are 100% clay materials, fall into the fault zone in proportion to their even thickness and is distributed along the fault surface where the throw is H. By assuming that the clay content is an average value over defined zones, the equation of SGR calculation has been improved by Freeman in 1998 [44].
c1
V . Z
SGR .
H
∆
=
∑
(6)where SGR is the shale gouge ratio, which can also be considered to be the shale content of the fault at a given point, Vcl indicates the volume fraction of clay in an interval of thickness Z (m3), and H is the
fault throw (m).
d. Establishing the fitting equation to predict the displacement pressure of the rock based on its clay content and the compaction pressure.
The effective overburden pressure on the subsurface can be regarded as mechanical compaction pressure. Thus, a fitting equation can be established to predict the displacement pressure of the rocks based on the effective overburden pressure and the clay content according to the relationship previously derived from the results of the man-made core sample displacement pressure tests and based on the displacement pressures, clay contents, and effective overburden pressure of the bulk rock samples from
the study area obtained from the experiments. e. Predicting the displacement pressure of the fault rocks and the juxtaposed reservoir rocks.
According to Equations 4 and 5, the Pc can be calculated from point depth Z, the average density of the rock frame, and the fault dip. The SGR magnitude can be calculated using Equation 3. Then, the displacement pressure of the fault rock at the target point can be obtained from the fitting equation above, and the displacement pressure of the juxtaposed reservoir rock can be calculated based on its clay content and the effective overburden stress. f. Quantitatively evaluating the lateral sealing ability According to the steps described above, the displacement pressures of the fault rocks (Pdf) and the juxtaposed reservoir rocks (Pdr) can be predicted at each point on the fault plane. Then by comparing Pdf and Pdr, if Pdf Pdr, this point on the fault is not lateral sealed; otherwise, it is sealed. The sealing ability depends on the magnitude of the difference between Pdf and Pdr (Figure 5). The greater the difference, the stronger the lateral sealing ability of the fault is. The lateral sealing ability can also be used to determine the gas column height.
A Case Study: Fault Trap in Well Gang
64, in the West Qikou Sag, China
Geologic Setting
In this case study, the fault trap in Well Gang 64 was selected as an example for the quantitative evaluation of the lateral sealing ability because of data limitations and a lack of software to enable bulk calculations along the fault.
The fault trap in Well Gang 64 is located in a fault block bordered by two northeast-trending faults: (1) the Tangjiahe fault, which mainly effects hydrocarbon accumulation, and (2) a small companion fault to the Tangjiahe fault, in the northern Beidagang structural zone in the west Qikou Sag, China (Figure 6).
Figure 6: Structural map of the Dongying Formation in Well Gang 64, in western part of Qikou Sag. The fault trap of Well Gang 64 is located in a fault block bordered by the Tangjiahe fault and a small companion fault.
The reservoir is in the third member of the Dongying Formation, which is overlain by the second member of the Dongying Formation, a rich mudstone that forms a cap seal (Figure 7).
Figure 7: Stratigraphic column of the Qikou Sag. The reservoir is in the third member of the Dongying Formation, which is overlain by the second member of the Dongying Formation, a rich mudstone that forms a cap seal.
The Tangjiahe fault was primarily active during the deposition of the Shahejie and Guantao Formations. However, the main episodes of oil and gas migration in this area occurred during deposition of the Minghuazhen Formation.
Therefore, the faulting did not destroy the preservation of oil and gas. In addition, the denudation thickness was not significant although this area experienced short-term uplift during late deposition of the Dongying Formation. Thus, the influence of decompression on the reservoir rock and fault rock can be ignored.
Analysis of the Lateral Sealing Ability of
the Fault
http://jpst.ripi.ir
37
Journal of Petroleum Science and Technology 2019, 9(3), 27-45© 2019 Research Institute of Petroleum Industry (RIPI)
overburden pressure and the burial depth in the northern Beidagang structural zone was established according to Equation 4, in which all of the data are from early production tests (Figure 8).
Figure 8: The pressure data from production test. The effective overburden pressures are plotted against the burial depth in the northern Beidagang structural zone.
Second, the reservoirs were all distributed below 2200 m with fault dip angles of 48.5−1.0° at cross points based on readings throughout the structural diagram and seismic profile. So, for the reservoir section of Well Gang 64, the positive pressures of the cross points on the fault plane calculated using Equation 5 were found to be 32.9-36.2 MPa. Third, the fault throw, the thickness, and the clay content of the sand and mudstone layers in the Dongying Formation were used with Equation 6 to calculate the SGRs at the cross points, 32.2-38.4%. The clay content of the layers was obtained through the analysis of the gamma log data for Well Gang 64.
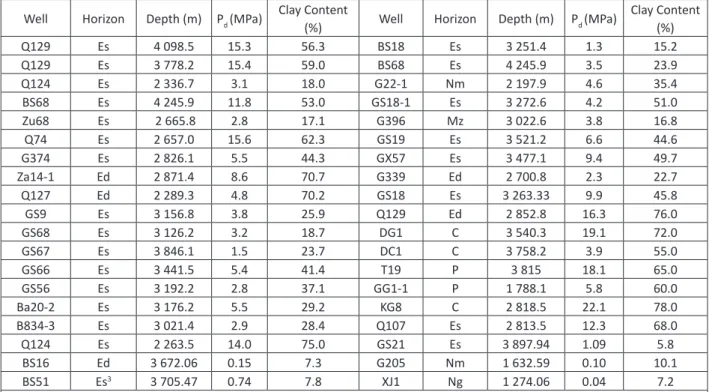
Fourth, displacement pressure tests were conducted on 38 rock samples from the Qikou Sag with different burial depths and clay contents using the experimental equipment (PYC-1) (Table 3).
Table 3: Experimental displacement pressures of the rocks in the Qikou sag.
Well Horizon Depth (m) Pd (MPa) Clay Content (%) Well Horizon Depth (m) Pd (MPa) Clay Content (%) Q129 Es 4 098.5 15.3 56.3 BS18 Es 3 251.4 1.3 15.2 Q129 Es 3 778.2 15.4 59.0 BS68 Es 4 245.9 3.5 23.9 Q124 Es 2 336.7 3.1 18.0 G22-1 Nm 2 197.9 4.6 35.4 BS68 Es 4 245.9 11.8 53.0 GS18-1 Es 3 272.6 4.2 51.0 Zu68 Es 2 665.8 2.8 17.1 G396 Mz 3 022.6 3.8 16.8 Q74 Es 2 657.0 15.6 62.3 GS19 Es 3 521.2 6.6 44.6 G374 Es 2 826.1 5.5 44.3 GX57 Es 3 477.1 9.4 49.7 Za14-1 Ed 2 871.4 8.6 70.7 G339 Ed 2 700.8 2.3 22.7 Q127 Ed 2 289.3 4.8 70.2 GS18 Es 3 263.33 9.9 45.8 GS9 Es 3 156.8 3.8 25.9 Q129 Ed 2 852.8 16.3 76.0 GS68 Es 3 126.2 3.2 18.7 DG1 C 3 540.3 19.1 72.0 GS67 Es 3 846.1 1.5 23.7 DC1 C 3 758.2 3.9 55.0 GS66 Es 3 441.5 5.4 41.4 T19 P 3 815 18.1 65.0 GS56 Es 3 192.2 2.8 37.1 GG1-1 P 1 788.1 5.8 60.0
Ba20-2 Es 3 176.2 5.5 29.2 KG8 C 2 818.5 22.1 78.0
B834-3 Es 3 021.4 2.9 28.4 Q107 Es 2 813.5 12.3 68.0 Q124 Es 2 263.5 14.0 75.0 GS21 Es 3 897.94 1.09 5.8 BS16 Ed 3 672.06 0.15 7.3 G205 Nm 1 632.59 0.10 10.1 BS51 Es3 3 705.47 0.74 7.8 XJ1 Ng 1 274.06 0.04 7.2
Because the depth of these rock samples can be used to calculate the compaction pressure using Equation 4, the fitting equation for the displacement pressure prediction for this area was established based on the test data (Figure 9).
Figure 9: Relationship between displacement pressure, burial depth, and mudstone content in the Qikou sag. It shows that the displacement pressure values increase exponentially with the increase of the product of the clay content and the compaction pressure in the Qikou Sag.
Finally, the displacement pressure of the fault rock was obtained using the fitting equation from Figure 4 based on the compaction pressure, and the clay contents of the fault rock and the juxtaposed reservoir. There are a total of 11 effective reservoirs in the Eogene third Dongying Group related to the Fault Tangjiahe fault, of which layers 8, 9, 10, 12, 13, 17, and b5 have been confirmed to contain gas. It is found out that the displacement pressures of the fault rocks were greater than 1.6 MPa, and that of the reservoirs in the footwall are in the range of 1.14~1.83 MPa (Table 4).
Table 4: The calculation parameters for the displacement pressures of the fault rocks and reservoirs in Well Gang 64.
Reservoir Number
Depth of Fault Rock and Reservoir (m)
Reservoir Thickness
(m)
Clay Content of Reservoir
(%)
Reservoir Pd
(MPa) SO&G SGR (%) Dip Angle
(°)
Positive Pressure on
Fault Plane (MPa)
Fault Rock Pd
(MPa)
Displacement Pressure Difference
(MPa)
8 2261 1.8 10.3 0.85 Gas 33.8 51 32.9 1.23 0.39
9 2264 3.8 9.3 0.82 Gas 33.4 51 32.9 1.23 0.41
10 2271.5 3.8 7.8 0.78 Gas 32.7 50.5 33.4 1.22 0.44
12 2279 2.8 12.4 0.91 Gas 32.2 50 33.8 1.22 0.30
13 2287 4.2 11.7 0.89 Gas 32.2 50 34.0 1.22 0.33
17 2313 7 5.2 0.71 Gas 34.1 50 34.3 1.28 0.57
b3 2348 3.8 22.8 1.34 oil trace 34.2 49 35.6 1.32 -0.02
b4 2352 3 23.4 1.37 oil trace 34.7 49 35.6 1.34 -0.03
b5 2366 3 12 0.92 oil trace 37.6 49 35.9 1.44 0.53
b6 2384 10 10.3 0.86 oil trace 38.4 48.5 36.5 1.49 0.63
b7 2391 3.8 12.6 0.94 oil trace 37.9 49 36.2 1.47 0.53
P(MP
a)
Vsh. Pc(MPa)
http://jpst.ripi.ir
39
Journal of Petroleum Science and Technology 2019, 9(3), 27-45© 2019 Research Institute of Petroleum Industry (RIPI)
The differences in the displacement pressures of the fault rocks and the juxtaposed reservoirs varied with a maximum value of 0.64 MPa in layer B6 and a minimum value of −0.03 MPa in layer B4. Based on these results, we conclude that the fault through the reservoir in the third member of the Dongying Formation is laterally closed except in layers B3 and B4 because the fault rocks have greater values than the reservoirs, which indicates good preservation conditions for oil and gas accumulation (Figure 10).
Figure 10: Gas pool section of the trap in Well Gang 64 in the western part of the Qikou Sag. The result is that the fault through the reservoir in the third member of the Dongying Formation is laterally closed except in layers B3 and B4 because of the greater values of fault rocks than that of reservoirs.
RESULTS AND DISCUSSION
The results of the application of our method to the trap in Well Gang 64 emphasize the possibility of the successful prediction of the lateral sealing ability of the fault, which indicates that clay content and compaction pressure are the main
factors controlling the petrophysical properties of the fault rocks in the study area. However, there are still three issues which need to be discussed further.
One is the relationship among the displacement pressure and the product of the clay content and the compaction pressure. The product of the clay content and the compaction pressure reflects the reduction in the compaction pressure due to the clay content of the rock, which has a lubricating effect and fills the intergranular pores.
shallow stratum [69,70,71]. The predicted data for the petrophysical properties resulting from this equation may be wrong for deep fault rocks or reservoirs.
The second is the predicted value of the displacement pressures of the fault rocks and reservoirs. The results suggest that there be a good correlation between the sealing ability of the fault, determined from the difference in the displacement pressures of the fault rocks and reservoirs, and the hydrocarbon-bearing characteristics of the reservoirs, except for layers B6 and B7, which have no gas or oil because Well Gang 64 is located outside the oil/gas-bearing area of the trap. In addition, the differences between the displacement pressures of the fault rocks and the reservoirs can be used to predict the height of the oil/gas column. Unfortunately, the predicted height of the gas column is 0-10 m less than the actual height, which indicates that the accuracy of the predicted displacement pressure of the fault rock and reservoir is 85-90%.
The last one is that in this paper, only on determining the lateral sealing ability of the fault at present is concentrated. The static evaluation of the lateral sealing ability was not accurate when the fault trap and accommodating space for oil/ gas in the fault trap were not consistently available [67,68,69,70,71,72] As burial depth increases, the compaction pressure of the fault rocks increases, so later tectonic movement can result in an increase in the fault throw and changes in the SGR value of the target interval. All of these events can affect the petrophysical properties of the fault rocks, or even the sealing of faults and the sealing ability of faults. Therefore, dynamic evaluation of the lateral sealing ability during oil and gas migration and accumulation can be studied using techniques such
as the paleothickness of strata recovery, ancient fault throw recovery, and fault activity analysis. However, these problems could be solved the effects of tectonic movement, cementation, dissolution, temperature, and geological time based on the ideas and workflow of our methodology were paid attention. The quantitative evaluation of the lateral sealing ability will be more practical in the future.
CONCLUSIONS
http://jpst.ripi.ir
41
Journal of Petroleum Science and Technology 2019, 9(3), 27-45© 2019 Research Institute of Petroleum Industry (RIPI)
faults. However, this method is still insufficient in the quantitative characterization of the fault rocks’ diagenetic process and evaluation of past lateral sealing ability. In addition, on these defects has been being studied to establish an evaluation method for determining the lateral sealing ability of faults more accurately based on a series of techniques.
ACKNOWLEDGMENTS
It would have been impossible to finish this manuscript without the discussion and suggestions from many colleagues. We would like to thank Dr. Fu Guang and Dr. Lv Yan-Fang for their valuable contributions to this article. This work has been supported by the Science and Technology Research Project of Heilongjiang Education Department (12541067).
NOMENCLATURE
SGR: Shale Gouge RatioREFERENCES
1. Allan U. S., “Model for Hydrocarbon Migration and Entrapment within Faulted Structures,” American Association of Petroleum Geologists Bulletin, 1989, 73(7), 803-811.
2. Bouvier J. D., Kaarssijpesteijn C. H., Kluesner D. F., and Onyejekwe C. C., “Three-dimensional Seismic Interpretation and Fault Sealing Investigations, Nun River Field, Nigeria,” American Association of Petroleum Geologists Bulletin, 1989, 73(11), 1397-1414.
3. Schowalter T. T., “Mechanics of Secondary Hydrocarbon Migration and Entrapment,” American Association of Petroleum Geologists Bulletin, 1979, 63(5), 723-760.
4. Smith D. A., “Theoretical Considerations of
Sealing and Non-sealing Faults.” American
Association of Petroleum Geologists Bulletin, 1966, 50(2), 363-374.
5. Smith D. A., “Sealing and Nonsealing Faults in Louisiana Gulf Coast Salt Basin,” American
Association of Petroleum Geologists Bulletin, 1980, 64(2), 145-172.
6. Watts N. L., “Theoretical Aspects of Cap-rock and Fault Seals for Single and Two-phase Hydrocarbon Columns,” Marine and Petroleum
Geology, 1987, 4(4), 274-307.
7. Corrigan A. F., “Estimation of Recoverable Reserves: the Geologists Job,” Petroleum
Geology of Northwest Europe: Proceedings of
the 4th Conference, 1993, 1473-1482.
8. Knipe R. J., “Juxtaposition and Seal Diagrams to Help Analyze Fault Seals in Hydrocarbon Reservoirs,” American Association of Petroleum Geologists Bulletin, 1997, 81(2), 187-195. 9. Cerveny K., Davies R., Dudley G., and Fox R.,
“Reducing Uncertainty with Fault-seal Analysis,” Oilfield Review, 2004, 16(4), 38-51.
10. Faulkner D. R., Jackson C. A. L., Lunn R. J., and Schlische R. W., “A Review of Recent Developments Concerning the Structure, Mechanics and Fluid Flow Properties of Fault Zones,” Journal of Structural Geology, 2010,
32(11), 1557-1575.
11. Jolley S. J., Barr D., Walsh J. J., and Knipe R. J., “Structurally Complex Reservoirs: An Introduction,” Geological Society London Special Publications A, 2007, 292, 1-24.
13. Knipe R. J., “Faulting Processes and Fault Seal,” Structural and Tectonic Modelling and Its Application to Petroleum Geology, 1992, 1, 325-342.
14. Knipe R. J., Fisher R. J., Jones G., and Clennell M. R., “Fault Seal Analysis: Successful Methodologies, Application, and Future Directions,” Norwegian Petroleum Society Special Publications B, 1997,
7(97), 15-40.
15. Knott S. D., “Fault Seal Analysis in the North Sea,” American Association of Petroleum Geologists Bulletin, 1993, 77(5), 778-792.
16. Lindsay N. G., Murphy F. C., Walsh J. J., Watterson J., Flint S., and et al., “Outcrop Studies of Shale Smears on Fault Surfaces,” The Geological Modelling of Hydrocarbon Reservoirs and Outcrop Analogues, 1993, 15, 113-123 17. Fisher Q. J. and Jolley S. J., “Treatment of Faults
in Production Simulation Models,” Geological Society London Special Publications, 2007, 292, 219-233.
18. Fisher Q. J. and Knipe R. J., “The Permeability of Faults within Siliciclastic Petroleum Reservoirs of the North Sea and Norwegian Continental Shelf,” Marine and Petroleum Geology, 2001, 18
(10), 1063-1081.
19. Balsamo F., Storti F., Salvini F., and Silva A. T., “Structural and Petrophysical Evolution of Extensional Fault Zones in Low-porosity, Poorly Lithified Sandstones of the Barreiras Formation,” NE Brazilian Journal of Structural Geology, 2010,
32(11), 1806-1826.
20. Caine J. S., Evans J. P., and Forster C. B., “Fault Zone Architecture and Permeability Structure,” Geology, 1996, 24(11), 1025-1028.
21. Childs C., Nicol A., Walsh J.J., and Watterson J., “Growth of Vertically Segmented Normal
Faults,” Journal of Structural Geology, 1996,
18(12), 1389-1397.
22. Childs C., Manzocchi T., Walsh J. J., and Bonson C. G., “A Geometric Model of Fault Zone and Fault Rock Thickness Variations,” Journal of
Structural Geology, 2009, 31(2), 117-127. 23. Walsh J. J., Bailey W. R., Childs C., and Nicol A.,
“Formation of Segmented Normal Faults: A 3-D Perspective,” Journal of Structural Geology, 2003, 25(8), 1251-1262.
24. Jolley S. J., Dijk H., Lamens J. H., and Fisher Q. J., “Faulting and Fault Sealing in Production Simulation Models: Brent Province, northern North Sea,” Petroleum Geoscience B, 2007,
13(4), 321-340.
25. Peacock D. C. P. and Sanderson D. J., “Geometry and Development of Relay Ramps in Normal Fault Systems,” American Association of Petroleum Geologists Bulletin, 1994, 78(2), 147-165. 26. Peacock D. C. P. and Sanderson D. J., “Displacements,
Segment Linkage and Relay Ramps in Normal Fault Zones,” Journal of Structural Geology, 1991, 13(6), 721-733.
27. Peacock D. C. P. and Sanderson D. J., “Effects of Layering and Anisotropy on Fault Geometry,” Journal of the Geological Society, 1992, 149(5), 793-802.
28. Rotevatn A. and Bastesen E., “Fault Linkage and Damage Zone Architecture in Tight Carbonate Rocks in the Suez Rift (Egypt): Implications for Permeability Structure Along Segmented Normal Faults,” Geological Society London Special Publications, 2014, 374(1), 79-95.
http://jpst.ripi.ir
43
Journal of Petroleum Science and Technology 2019, 9(3), 27-45© 2019 Research Institute of Petroleum Industry (RIPI)
Northern Apennines (Rapolano Terme, Central Italy),” Tectonophysics, 2015, 638, 126-146. 30. Billi A., Salvini F., and Storti F., “The Damage
Zone-fault Core Transition in Carbonate Rocks: Implications for Fault Growth, Structure and Permeability,” Journal of Structural Geology, 2003, 25(11), 1779-1794.
31. Cowie P. A. and Scholz C. H., “Displacement-Length Scaling Relationship for Faults: Data Synthesis and Discussion,” Journal of Structural
Geology, 1992, 14(10), 1149-1156.
32. Cowie P. A., Vanneste C., and Sornette D., “Statistical Physicsmodel for the Spatiotemporal evolution of Faults,” Journal of Geophysics Research, 1993, 98(B12), 21809-21821. 33. Cowie P. A., Knipe R. J., and Main I. G.,
“Introduction to the Special Issue: Scaling Laws for Fault and Fracture Populations-analyses and Applications,” Journal of Structural Geology, 1996, 18(2-3), v-xi.
34. Tueckmantel C., Fisher Q. J., Knipe R. J., and Lickorish H., “Fault Seal Prediction of Seismic-scale Normal Faults in Porous Sandstone: A Case Study from the Eastern Gulf of Suez Rift, Egypt,” Marine and Petroleum Geology, 2010, 27(2), 334–350.
35. Fisher Q. J. and Knipe R. J., “Fault Sealing Processes in Siliciclastic Sediments,” Geological Society London Special Publications, 1998, 147, 117-134.
36. Fossen H. and Bale A., “Deformation Bands and their Influence on Fluid Flow,” American
Association of Petroleum Geologists Bulletin, 2007, 91(12), 1685–1700.
37. Fossen H., Schultz R. A., and Torabi A., “Conditions and Implications for Compaction Band Formation
in the Navajo Sandstone, Utah,” Journal of
Structural Geology, 2011, 33(10), 1477–1490. 38. Fisher Q. J., Casey M., Harris S. D., and Knipe R.
J., “Fluid-flow Properties of Faults in Sandstone: the Importance of Temperature History,” Geology, 2003, 31(11), 965-968.
39. Fisher Q. J., Knipe R. J., and Worden R. H., “Microstructures of Deformed and Nondeformed Sandstones from the North Sea: Implications for the Origins of Quartz Cement in Sandstones,” In Quartz Cementation in Sandstones, Worden R. H., Morad S., Ed. Oxford, UK: Blackwell Publishing Ltd, 2009, 129-146.
40. Knipe R. J., Jones G., and Fisher Q. J., “Faulting, Fault Sealing and Fluid Flow in Hydrocarbon Reservoirs: an Introduction,” Geological Society London Special Publications, 1998, 147(1), 7-12. 41. Welch M. J., Souque C., Davies R. K., and
Knipe R. J., “Using Mechanical Models to Investigate the Controls on Fracture Geometry and Distribution in Chalk,” Geological Society, London, Special Publications, 2015, 406(1), 281-309.
42. Fulljames J. R., Zijerveld L. J. J., and Franssen R. C. M. W., “Fault Seal Processes: Systematic Analysis of Fault Seals over Geological and Production Time Scales,” Norwegian Petroleum Society Special Publications, 1997, 7(7), 51-59. 43. Nicol A. and Childs C., “Cataclasis and Silt Smear
on Normal Faults in Weakly Lithified Turbidites,” Journal of Structural Geology, 2018, 117, 44-57. 44. Yielding G., Freeman B., and Needhanm D. T.,
“Quantitative Fault Seal Prediction,” American
Association of Petroleum Geologists Bulletin, 1997, 81(6), 897-917.
Geohistory,” Norwegian Petroleum Society Special Publications, 2002, 11, 1-15.
46. Yielding G., “Using Probabilistic Shale Smear Factor to Relate SGR Predictions of Column Height to Fault-zone Heterogeneity,” In 2nd EAGE
International Conference on Fault and Top Seals-From Pore to Basin Scale, 2009, 93-95.
47. Choi J. H., Yang S. J., Han S. R., and Kim Y. S., “Fault Zone Evolution during Cenozoic Tectonic Inversion in SE Korea,” Journal of Asian Earth
Sciences, 2015, 98, 167-177.
48. Qu D., Røe P. and Tveranger J., “A Method for Generating Volumetric Fault Zone Grids for Pillar Gridded Reservoir Models,” Computers and Geosciences Journal, 2015, 81, 28-37. 49. Bretan P. “Trap Analysis: an Automated Approach
for Deriving Column Height Predictions in Fault-bounded Traps,” Petroleum Geoscience Journal, 2017, 23(1), 56-69.
50. Iyer K., Schmid D. W., Helmut R. L., and Skeie J. E., “Importance of Evolving Fault Seals on Petroleum Systems: Southern Halten Terrace, Norwegian Sea” American Association of Petroleum Geologists Bulletin, 2017, 102(4), 671-689.
51. Michie E. A. H. and Haines T. J., “Variability and heterogeneity of the petrophysical properties of extensional carbonate fault rocks, Malta,” Petroleum Geoscience Journal, 2016, 22(2), 136-152.
52. Grunau H. R., “A worlwide look at the cap-rock problem,” Journal of Petroleum Geology, 1987,
10(3), 245-266.
53. Rawling G. C. and Goodwin L. B., “Cataclasis and particulate flow in faulted, poorly lithified sediments,” Journal of Structural Geology,2003,
25(3), 317-331.
54. Pei, Y.W., Paton D. A., Knipe R. J., and Wu K. Y., “A review of fault sealing behaviour and its evaluation in siliciclastic rocks,” Earth-Science Reviews, 2015, 150, 121-138.
55. Zhu W. L. and Wong T. F., “The transition from brittle faulting to cataclastic flow: permeability evolution,” Journal of Geophysical Research, 1997, 102(B2), 3027-3041.
56. Indrevar K., Stunitz H., and Bergh S.G., “On Palaeozoic-Mesozoic brittle normal faults along the SW Barents Sea margin: fault processes and implications for basement permeability and margin evolution,” Journal of the Geological
Society, 2014, 171(6), 831-846.
57. Sverdrup E., Helgesen J., and Vold J., “Sealing properties of faults and their influence on water-alternating-gas injection efficiency in the Snorre field, northern North Sea,” American
Association of Petroleum Geologists Bulletin, 2003, 87(9), 1437-1458.
58. Strand J., Langhi L., Ross A. S., and Dyt C., “Coupled stratigraphic and fault seal modelling used to describe trap integrity in the frontier Bight Basin, Australia,” Marine and Petroleum
Geology, 2017, 86, 474-485.
59. Ovcharenko A. V., Ermakov B. V., Myatchin K. M., and Shlezinger A. E., “Caprocks in Hydrocarbon Fields,” Lithology and Mineral Resources Journal, 2007, 42(2), 201-213.
60. Audet M. D. “Compaction and Overpressuring in Pleistocene sediments on the Louisiana Shelf, Gulf of Mexico,” Marine and Petroleum
Geology, 1996, 13(5), 467-474.
http://jpst.ripi.ir
45
Journal of Petroleum Science and Technology 2019, 9(3), 27-45© 2019 Research Institute of Petroleum Industry (RIPI)
marine sediments,” Journal of Geophysical Research: Solid Earth, 2003, 108(B4), 2197-2219.
62. Yang Y, Aplin A. C., and Larter S. R., “Quantitative assessment of mudstone lithology using geophysical wireline logs and artificial neural networks,” Petroleum Geoscience, 2004, 10, 141-151.
63. Yang Y. and Aplin A. C., “Permeability and petrophysical properties of 30 natural mudstones,” Journal of Geophysical Research Solid Earth, 2007, 112(B3), 485-493. 64. Wang P., Yu W. J., Feng, T., and Zhu Y. J.,
“Experimental study on second diagenesis by compaction and consolidation of soft and broken rock,” Chinese Journal of Rock Mechanics and Engineering, 2018, 37(8), 1884-1894.
65. Laubach S. E., Eiehhubl P., Hilgers C., and Lander, R. H., “Structural diagenesis,” Journal
of Structural Geology, 2010, 32(12), 1866-1872.
66. Gao Z. Y., Ma J. Y., Cui J. G., and Feng J. R., “Deep Reservoir Pore Evolution Model of a Geological Process from Burial Compaction to Lateral Extrusion,” Acta Sedimentologica Sinica, 2018,
36(1), 176-187.
67. Solum J. G. and Huisman B. A. H., “Toward the creation of models to predict static and dynamic fault seal potential in carbonates,” Petroleum Geoscience, 2017, 23, 70-91. 68. Aplin A. C., and Larter S. R. “Fluid Flow,
Pore Pressure, Wettability, and Leakage in Mudstone Cap Rocks,” in Proceedings of the AAPG Hedberg Conference, 2005, 1-12. 69. Schultz R. A. and Fossen H., “Terminology for
structural discontinuities,” American Association of Petroleum Geologists Bulletin, 2008, 92(7), 853-867.
70. Kolyukhin D., Schueller S., Espedal M., and Fossen H., “Deformation band populations in fault damage zone—impact on fluid flow,” Computers and Geosciences Journal, 2010,
14(2), 231–248.
71. Freeman B., Yielding G., Needham D. T., and Badley M. E., “Fault seal prediction: the gouge ratio method,” Geological Society, London, Special Publications, 1998, 127(1), 19-25. 72. Reilly C., Nicol A., Walsh J. J., and Kroeger K.,
“Teegmporal changes of fault seal and early charge of the Maui Gas-condensate field, Taranaki Basin, New Zealand,” Marine and
Petroleum Geology Journal, 2016, 70, 237-250. 73. Freeman B., Yielding G., Needham D. T., and
Badley M. E., “Fault seal prediction: the gouge ratio method,” Geol. Soc. Lond., Spec. Publ., 1998, 127(1), 19-25.
74. Kolyukhin D., Schueller S., Espedal M., and Fossen H., “Deformation band populations in fault damage zone-impact on fluid flow,” Comput. Geosci., 2010, 14(2), 231–248. 75. Reilly C., Nicol A., Walsh J. J., and Kroeger K.,
“Teegmporal changes of fault seal and early charge of the Maui Gas-condensate field, Taranaki Basin, New Zealand,” Mar. Pet. Geol., 2016, 70, 237-250.
76. Schultz R. A. and Fossen, H., “Terminology for structural discontinuities,” Am. Assoc. Pet.