Systematic Analysis of Yeast F-box Proteins Reveals a New Role of Ubiquitination in Polarity Establishment
By Joshua B. Sheetz
Senior Honors Thesis Department of Chemistry
University of North Carolina at Chapel Hill
April 9th, 2015
Approved:
ABSTRACT
Systematic Analysis of Yeast F-box Proteins Reveals New Role of Ubiquitination in Polarity Establishment
Joshua B. Sheetz1, Joshua B. Kelley1,2, Samantha M. Miller2, Jillian H. Hurst1, Everett G. Young1, Henrik G. Dohlman1,2
1Department of Biochemistry and Biophysics 2Department of Pharmacology
University of North Carolina at Chapel Hill, Chapel Hill, North Carolina, United States of America
Ubiquitination is a post-translational modification that regulates protein activity by tagging specific substrates for degradation. Regulation of proteins by ubiquitination has been demonstrated to help terminate the response to mating pheromone in budding yeast. The yeast pheromone response is comprised of two branches, one leading to MAPK activation and gene
transcription, the other leading to cellular polarization and shmoo formation. The Skp1/Cdc53/F-box (SCF) ubiquitin ligase employs different F-box
subunits to recruit specific substrates for ubiquitination. In yeast, F-box proteins have been identified as interchangeable components of the SCF complex. One of these, Cdc4, specifically targets pathway components
response in 16 yeast strains – each lacking one of the known (or candidate) F-box genes. To gain an understanding of specific F-box functions, we
TABLE OF CONTENTS
Page
Abstract………2
Table of Contents………...4
List of Tables and Figures………...5
List of Abbreviations………... …..7
I. Introduction………...8
II. Materials and Methods………. …….14
III. Results and Discussion A. Results………..26
B. Discussion………30
IV. Contributions………34
VI. Supplemental
LIST OF TABLES AND FIGURES
Page
Figure 1 – The yeast pheromone
pathway………..10
Figure 2 – The role of the F-box
protein……….11
A. SCF mediated degradation
B. Summary of the 16 yeast F-box proteins
Table 1 – Summary of the strains used in this study………. ……….15
Figure 3 – Screening the yeast F-box-ome: MAPK/transcription branch...24
A. FUS1 Transcription Levels B. MAPK Activation Levels
Figure 4 – Screening the yeast F-box-ome: morphology branch………. ……...26
A. Changes in shmoo morphology
Figure 5 – Characterization of the Pfu1∆
phenotype……….28
A. Bem1-GFP localization in wild type cells B. Bem1-GFP localization in Pfu1∆ cells
Figure 6 – SCFPfu1 regulates cell polarity during pheromone response………...32
Supplemental Figure 1 – Diagrams of each F-box Mutant Screen………...40
Supplemental Figure 2 – Microfluidics and Live-cell Microscopy………..42
Supplemental Figure 3 – Wild Type vs. rga1∆ vs. pfu1∆ Morphology………43
LIST OF ABBREVIATIONS
GAP GTPase Activating Protein
GEF Guanine Nucleotide Exchange Factor
GPCR G-protein coupled receptor
LRR Leucine Rich Repeat
MAPK Mitogen-activated protein kinase
PFU1 Polarity Factor involved in Ubiquitination (YDR306c)
I. INTRODUCTION
Ubiquitination is a post-translational modification that is central to proteasomal degradation in eukaryotes. Ubiquitin, an evolutionarily well-conserved protein, is conjugated to specific target proteins by complex molecular machinery and, thus, tags the target protein for degradation (Hershko & Ciechanover, 1998). Ubiquitination has traditionally been
connected to protease activity, though it is more recently being associated with a range of non-proteolytic functions including roles in cell adhesion, vesicle trafficking, and signal transduction (Schaefer et al, 2012). While ubiquitin’s role in mitosis has been well characterized, regulation by ubiquitination during cellular expansion without division is scarcely
understood. For instance, it has only recently been discovered that ubiquitin-binding factors deliver the large G-protein to its cellular destination during pheromone-induced morphogenesis (Dixit et al 2014). Here we further investigate the regulation of pheromone-induced morphogenesis by ubiquitination.
subsequently conjugating the C-terminal carboxyl of the ubiquitin moiety to a lysine side chain of the substrate (Pickart, 2001). The covalently bound ubiquitin group then acts as a substrate in the formation of a
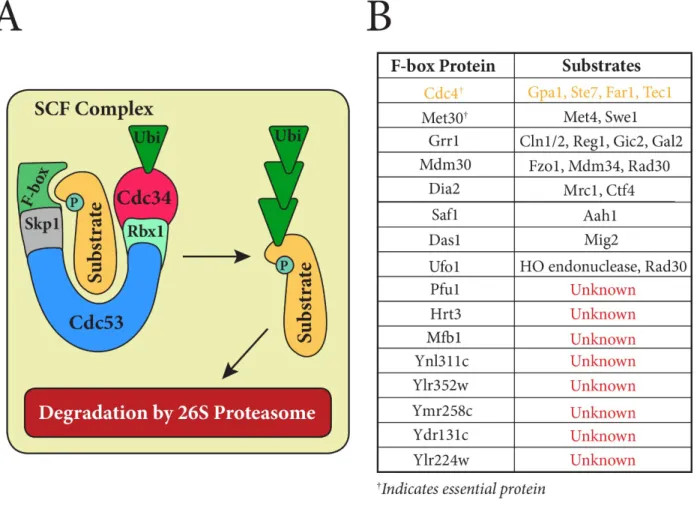
poly-ubiquitinated product that is consequently seized and degraded by the 26S proteasome (Kus et al, 2004; Varshavsky et al, 2012; Deshaies et al, 2009; Voges et al, 1999). Directed ubiquitination of a growing number of proteome constituents has been connected to the Skp1/Cdc53/F-box (SCF) complex, a multi-subunit E3 ubiquitin-ligase (Cardozo & Pagano, 2004; Pickart, 2001). In budding yeast, the SCF core components have been identified as the cullin structural subunit Cdc53, the adaptor subunit Skp1, and the RING domain containing subunit Rbx1 (Landry et al, 2012) (Figure 1a). It is the F-box subunit, however, that largely governs which substrate will interact with the SCF complex (Zhou et al, 2000; Patton et al 1998; Kus et al, 2004).
The F-box subunit is central to the specificity of SCF mediated ubiquitination. It is an interchangeable component that directly binds a phosphorylated substrate (Patton et al, 1998). In S. cerevisiae, there are sixteen putative F-box proteins, many of which have remained
determine if and to what extent other F-box proteins modulate the pheromone response.
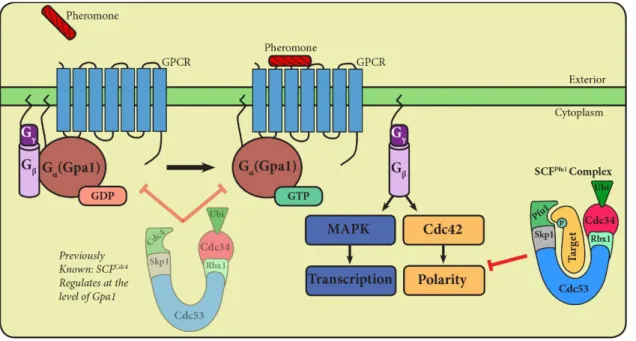
Figure 1. A) The Skp1/Cdc53/F-box (SCF) Complex facilitates the ubiquitination of specific proteins for subsequent degradation. The F-box protein is an interchangeable subunit, which serves to recruit the target substrate. B) Sixteen putative F-box proteins have been identified in S. cerevisiae; however, most are
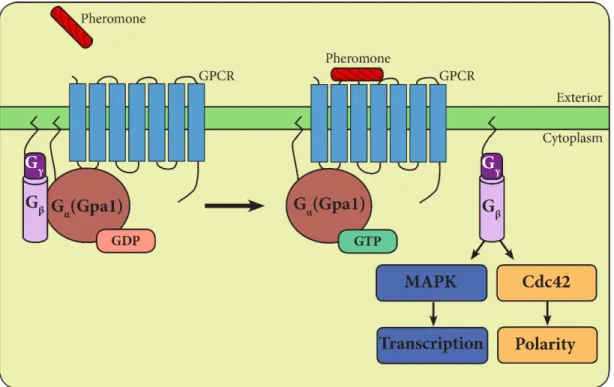
The yeast mating pathway employs a canonical heterotrimeric G-protein and mitogen-activated G-protein kinase (MAPK) cascade (Figure 2). Haploid yeast exists as one of two mating types, a- and α-type, and secrete peptide pheromone called a- and α-factor. Upon pheromone binding to cell-surface receptors, yeast undergo a number of physiological changes. Among these are cell-cycle arrest, polarized growth (formation of a shmoo), new gene transcription, cell fusion, and the formation of a diploid cell (Dohlman & Thorner, 2001).
Stimulation of the α-factor receptor (Ste2) promotes exchange of GDP for GTP on the Gα subunit (Gpa1). GTP-bound Gα then undergoes a
conformational change and dissociates from the Gβγ (Ste4/18) subunit dimer (Dohlman & Thorner, 2001). Activation of Gβγ leads to two distinct pathway
outputs. On one branch of the pathway, Gβγ signals through a MAPK cascade
leading to transcriptional induction of genes necessary for mating, such as
Figure 2. An external pheromone signal is transduced through a G-protein coupled receptor (GPCR) on the surface of the cell. The heterotrimeric G-protein dissociates into its active Gα and Gβγ
subunits, leading to two distinct pathway outputs. One branch of the pathway consists of MAP kinase phosphorylation and
transcriptional induction of genes necessary for mating. The other branch leads to activation of the small G-protein Cdc42. Activated Cdc42 aids in the organization of the actin
cytoskeleton during cell polarization. We are interested in
Morphology of yeast and mammalian cells is controlled by the small GTPase Cdc42, which is responsible for organization of the actin cytoskeleton (Melendez et al, 2011). In yeast, Cdc42 becomes activated by its guanine nucleotide exchange factor (GEF) Cdc24 as a result of pheromone receptor stimulation (Etienne-Manneville, 2004). The scaffold protein Bem1 provides a platform that binds many polarity factors, including Cdc42 and Cdc24
(Chenevert et al, 1992; Yamaguchi et al, 2007; Takuku et al, 2010). Upon mating pheromone stimulation, Bem1 localizes to the bud tip and plays a key role in orchestrating the machinery necessary for shmoo formation and polarized growth (Takuku et al, 2010). The yeast mating pheromone response has proven to be a powerful model for studying both polarized growth (Kelley et al, 2014) and F-box facilitated protein regulation (Cappell et al, 2010; Hurst & Dohlman, 2013). In this report, we seek to reveal a connection between F-box function and correct propagation of the polarity axis.
Here we conduct a study to determine which F-box proteins, if any, were involved in the polarity establishment branch of the yeast mating
pheromone response pathway. In our initial screen, we measured pheromone response pathway activation via the transcriptional reporter FUS1 and
YDR306c – has no effect on either FUS1 transcriptional levels or MAP kinase activation yet exhibits profound irregularities in pheromone-stimulated
II. MATERIALS AND METHODS
Strains and Growth Conditions – Standard methods for the growth, maintenance, and transformation of yeast and bacteria and for the
manipulation of DNA were used throughout. The yeast Saccharomyces cerevisiae strains used in this study were BY4741 (MATa leu2Δ met15Δ his 3Δ ura3Δ) (Research Genetics, Huntsville, AL) or BY4741-derived mutants
listed in Table 1, many of which were obtained from the Yeast Knock-Out gene deletion library (YKO, Open Biosystems) (Winzeler EA et al, 1999). Strains obtained from the Yeast GFP clone collection (Life Technologies) were utilized for quantitative fluorescent microscopy (Huh W et al 2003). Deletion strains originating from this study were validated by PCR amplification of genomic DNA. PCR was performed using either MyFi (Bioline), Velocity
Plasmid Construction – The yeast shuttle plasmids used were pRS315 (CEN, ampR, and LEU2) and pRS316 (CEN, ampR, and URA3). Plasmid
pRS423-FUS1-lacZ contains the FUS1 pheromone responsive element fused to the lacZ gene and was previously described (Hoffman et al, 2003).
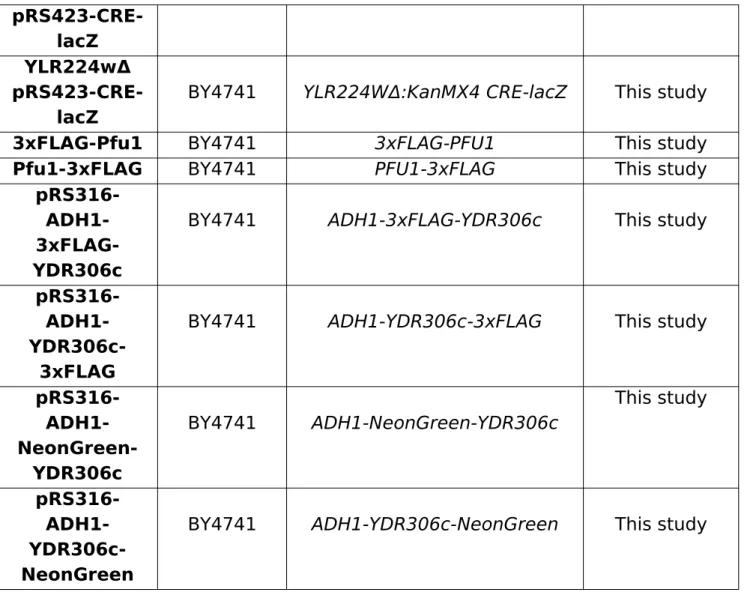
Plasmid pRS423-CRE-lacZ contains the salt-dependent cyclic-AMP response element (CRE) fused to the lacZ gene and was described previously by Tatebayashi et al (Tatebayashi et al, 2006). pRS316-ADH1-3xFLAG-YDR306c, pRS316-ADH1-YDR306c-3xFLAG, pRS316-ADH1-NeonGreen-YDR306c, and pRS316-ADH1-YDR306c-NeonGreen were constructed by PCR amplification from BY4741 genomic DNA, restriction digestion by EcoRI (New England Biolabs), CIP alkaline phosphatase (New England Biolabs) digestion to prevent self-religation, and ligation into pRS316-ADH1 using NEB Gibson Assembly (New England Biolabs).
Strain Backgroun d
Genotype Source
BY4741 MATa leu2Δ met15Δ his 3Δ
ura3Δ
--TetO7-Cdc4 BY4741 TetO7-CDC4 Mnaimned et
al TetO7-Met30 BY4741 TetO7-MET30 Mnaimned et
al Grr1Δ BY4741 GRR1Δ::KanMX4 This study Mdm30Δ BY4741 MDM30Δ::KanMX4 Mnaimned et
al Dia2Δ BY4741 DIA2Δ::KanMX4 Mnaimned et
al Saf1Δ BY4741 SAF1Δ::KanMX4 Mnaimned et
al Ufo1Δ BY4741 UFO1Δ::KanMX4 This study Pfu1Δ BY4741 PFU1Δ::KanMX4 Mnaimned et
al Hrt3Δ BY4741 HRT3Δ::KanMX4 Mnaimned et
al Mfb1Δ BY4741 MFB1Δ::KanMX4 Mnaimned et
al YNL311cΔ BY4741 YNL311CΔ::KanMX4 Mnaimned et
al YLR352wΔ BY4741 YLR352WΔ::KanMX4 Mnaimned et
al YMR258cΔ BY4741 YMR258CΔ::KanMX4 Mnaimned et
al YDR131cΔ BY4741 YDR131CΔ::KanMX4 Mnaimned et
al YLR224wΔ BY4741 YLR224WΔ:KanMX4 Mnaimned et
al Rga1Δ BY4741 RGA1Δ::KanMX4 Mnaimned et
al Bem1-GFP BY4741 PFU1Δ::KanMX4
BEM1-GFP::HIS3
Winzeler et al
Pfu1Δ Bem1-GFP
BY4741 PFU1Δ::KanMX4 BEM1-GFP::HIS3
This study
TetO7-Cdc4
pRS423-FUS1-lacZ
BY4741 TetO7-CDC4 FUS1-lacZ Cappell et al
TetO7-Met30
pRS423-FUS1-lacZ
BY4741 TetO7-MET30 FUS1-lacZ This study
Grr1Δ pRS423-FUS1-lacZ
BY4741 GRR1Δ::KanMX4 FUS1-lacZ This study
Mdm30Δ pRS423-FUS1-lacZ
BY4741 MDM30Δ::KanMX4 FUS1-lacZ This study
Dia2Δ
FUS1-lacZ Saf1Δ pRS423-FUS1-lacZ
BY4741 SAF1Δ::KanMX4 FUS1-lacZ This study
Das1Δ pRS423-FUS1-lacZ
BY4741 DAS1Δ::KanMX4 FUS1-lacZ This study
Ufo1Δ pRS423-FUS1-lacZ
BY4741 UFO1Δ::KanMX4 FUS1-lacZ This study
Pfu1Δ pRS423-FUS1-lacZ
BY4741 PFU1Δ::KanMX4 FUS1-lacZ This study
Hrt3Δ pRS423-FUS1-lacZ
BY4741 HRT3Δ::KanMX4 FUS1-lacZ This study
Mfb1Δ pRS423-FUS1-lacZ
BY4741 MFB1Δ::KanMX4 FUS1-lacZ This study
YNL311cΔ pRS423-FUS1-lacZ
BY4741 YNL311CΔ::KanMX4 FUS1-lacZ This study
YLR352wΔ pRS423-FUS1-lacZ
BY4741 YLR352WΔ::KanMX4 FUS1-lacZ This study
YMR258cΔ pRS423-FUS1-lacZ
BY4741 YMR258CΔ::KanMX4 FUS1-lacZ This study
YDR131cΔ pRS423-FUS1-lacZ
BY4741 YDR131CΔ::KanMX4 FUS1-lacZ This study
YLR224wΔ pRS423-FUS1-lacZ
BY4741 YLR224WΔ:KanMX4 FUS1-lacZ This study
Das1Δ
pRS423-CRE-lacZ
BY4741 DAS1Δ::KanMX4 CRE-lacZ This study
pRS423-CRE-lacZ YLR224wΔ
pRS423-CRE-lacZ
BY4741 YLR224WΔ:KanMX4 CRE-lacZ This study
3xFLAG-Pfu1 BY4741 3xFLAG-PFU1 This study Pfu1-3xFLAG BY4741 PFU1-3xFLAG This study
pRS316- ADH1- 3xFLAG-YDR306c
BY4741 ADH1-3xFLAG-YDR306c This study
pRS316- ADH1-
YDR306c-3xFLAG
BY4741 ADH1-YDR306c-3xFLAG This study
pRS316- ADH1- NeonGreen-YDR306c BY4741 ADH1-NeonGreen-YDR306c This study pRS316- ADH1- YDR306c-NeonGreen
BY4741 ADH1-YDR306c-NeonGreen This study
Table 1. Strains used in this study.
Transcription Reporter Assay – Strains were transformed with the pRS423-FUS1-lacZ reporter plasmid, grown in selective SCD-His medium for two days, and arrayed in a 96-well format at mid-log growth (0.8 OD600) on the third day. Four separate colonies from each deletion strain
10X of the indicated concentration (0 M – 300 M -factor). After 90 minutes at 30°C, the strains were incubated at 37C with 20 L FDG solution (0.5 mM fluorescein di--D galactopyranoside, 0.25% Triton X-100, and 130mM PIPES, pH 7.2) for 60 minutes. FDG is hydrolyzed into fluorescein in the presence of the enzyme -galactosidase, allowing for spectroscopic detection. A
nonlinear regression of sigmoidal-dose response with variable slope using Graphpad Prism 4 was used to analyze the data. For each graph, mean -galactosidase activity +/- standard error of the mean was plotted against concentration of pheromone or salt. Similar methods were used for yeast transformed with the CRE-lacZ reporter plasmid with the following
exceptions. Aliquots of 60 L of cells were added to 20 L of stimulus, and the strains were incubated for 90 minutes in twelve concentrations of stimulus (0 – 0.75 M KCl). Then, the strains were incubated in 20 L of FDG for 6 hours (Hurst & Dohlman 2013) (Chasse & Dohlman, 2004).
Cell Extracts and Immunoblotting – Wild type BY4741 and each of the F-box mutant strains were grown at 30 C to mid-log growth phase (0.8 OD600), and then treated with 3 M -factor for up to 90 minutes. Protein extracts were produced by glass bead lysis in trichloroacetic acid as
Biotechnology) at 1:1000, and glucose-6-phosphate dehydrogenase (A9521, Sigma) at 1:50000. Anti-phospho-p44/42 recognizes the
dually-phosphorylated, fully active form of the MAP kinase Fus3 and the partially redundant MAPK Kss1. Anti-Fus3 was used to measure total Fus3
concentration at each time point. Anti-glucose-6-phosphate dehydrogenase was used as a loading control. Immunoreactive species were visualized by chemiluminescent detection (PerkinElmer Life Sciences) of horseradish peroxidase-conjugated antibodies (Santa Cruz Biotechnology or BioRad). Protein concentration was determined by detergent-compatible protein assay (500-0112, Bio-Rad). Band intensity was quantified through scanning densitometry using ImageJ (National Institutes of Heath). Phospho-Fus3 and phospho-Kss1 were normalized to the glucose-6-phosphate dehydrogenase loading control (Hurst & Dohlman 2013).
Mating Projection Morphology Assay – Wild type BY4741 and each of the F-box mutant strains were grown in SCD medium to mid-log phase (0.8 OD600). Cells were then transferred to an agar pad (2% agar in SCD)
containing 30 μM pheromone, and images were taken using a Zeiss LSM 710. Differential interface contrast (DIC) images were taken at 1-hour intervals for 18 hours. Average shmoo length was quantified using ImageJ (National
Live-Cell Imaging – Live cell microscopy was performed using an Olympus Revolution XD (Olympus/Andor) spinning disc confocal microscope (IX81) using a 60x 1.4 NA objective, an IXon (Andor) electron multiplying charge coupled device (EMCCD) camera, and controlled by Metamorph (Molecular Devices). The temperature of the specimen was maintained at 30°C using a Bioptechs Objective Heater (Bioptechs). As the entire imaging portion of the microfluidic device was in contact with the oil immersion objective, the cells were warmed to the same temperature as the objective. Cells were imaged at 5-minute intervals for 12 hours in a microfluidic device containing SCD medium and α-factor pheromone as indicated. The 488 nm and 561 nm channels were collected as 6 Z-positions spaced 1 μm apart, and centered on the middle of the cell. Alexafour 647 hydrazide was used at 0.2 μg/ml in the medium to visualize pheromone in the chamber. For live cell
experiments, laser intensities were set as low as possible while still obtaining useable data, in order to minimize phototoxicity (Kelley et al 2015).
then cleaned successively with Scotch Tape (3M), 100% Methanol, 70% Ethanol, and filtered dH2O. The cast and a 24x40mm coverslip (Corning) were plasma cleaned at high for 1 min in a PDC-32G plasma cleaner (Harrick Plasma) and then bonded to each other. The ports were fed from 5 ml
syringes at the following heights, measured relative to the height of the stage: Inputs L1, L2, R1 and R2 at an average height of 33.75”; shunt at 11.2”; cell Load/waste at 1.75”; and waste at -3.5”. Each syringe was
connected to its port with Tygon tubing fitted to 23 gauge luer stubs (Kelley et al 2015).
Image analysis – Image analysis was performed using FIJI (FIJI Is Just ImageJ, http://fiji.sc/Fiji (Schindelin J et al, 2012) and MATLAB (Mathworks). Images were processed in the following manner using FIJI: a 1 pixel range Gaussian Blur was applied to smooth out camera noise, Background Subtraction was used at its default settings, and a maximum intensity
projection was performed on the z-stacks. The images were registered by the DIC channel using the FIJI plugin, “Descriptor-based series registration
(2D/3D + t)” (Preibisch et al, 2010) (Kelley et al 2015).
Cell mask production – In order to make cell masks, the average
Kymographs – Kymographs were created using a four pixel wide border along the perimeter of the cell. The cells were masked, and that mask was turned into a line scan of intensities along the perimeter of the cell using the “Multi Plot” function in FIJI. Alternatively, the perimeter intensities were measured in MATLAB using the mask to define a curve with the functions “bwtraceboundary” and “improfile” from the MATLAB Image Processing Toolbox. The profile for each time point was normalized to integrate to 1 (Kelley et al 2015).
Co-immunoprecipitation Assay. Transformed yeast strains were grown to OD600 ~ 1.0, harvested by centrifugation at 3000 X g, and resuspended in FLAG buffer (50 mM Tris, pH 8.0, 150 mM NaCl, 1 mM EDTA, 3 mM MgCl2, 25 mM β-glycerophosphate, 0.1% Triton X-100, protease inhibitor mixture pellets (Roche Applied Science, 1 pellet/25 ml of buffer)). Cells were lysed by vortexing with glass beads for 10 minutes at 4°C. Lysates were rocked at 4°C for 30 minutes to solubilize membrane proteins and centrifuged once at 6000 X g for 1 min and again for 30 minutes to remove insoluble matter. Protein content of the supernatant was determined by DC Protein Assay (Bio-Rad) and equalized. For FLAG immunoprecipitations, 20 μl of M2 FLAG
affinitity resin (Sigma) equilibrated with FLAG Lysis Buffer was added to each sample. After two hours of gentle rocking at 4°C, the resin was collected by centrifugation at 500 X g for 1 minute. Resin was washed four times with 1.5 ml of FLAG Lysis Buffer, and bound proteins were eluted twice with 2.5
III. RESULTS AND DISCUSSION
A. RESULTS
Screening Pheromone Pathway Activation in F-box Mutants – To identify additional regulators of G-protein signaling, we examined 16 F-box mutants for alterations in pheromone pathway activation. Three levels of pathway activation were probed by three separate assays. Each level monitored is downstream of Gβγ activation. With respect to one pathway branch, transcriptional induction of FUS1 and MAPK phosphorylation were examined; with respect to the polarized growth branch, changes in
morphology were examined. Strains were derived from wild type BY4741 yeast and contain the kanamycin resistance gene in place of each respective F-box gene. For essential F-box genes MET30 and CDC4, TetO7 (tet-Off) titratable promoter knock down strains were substituted for whole gene deletions.
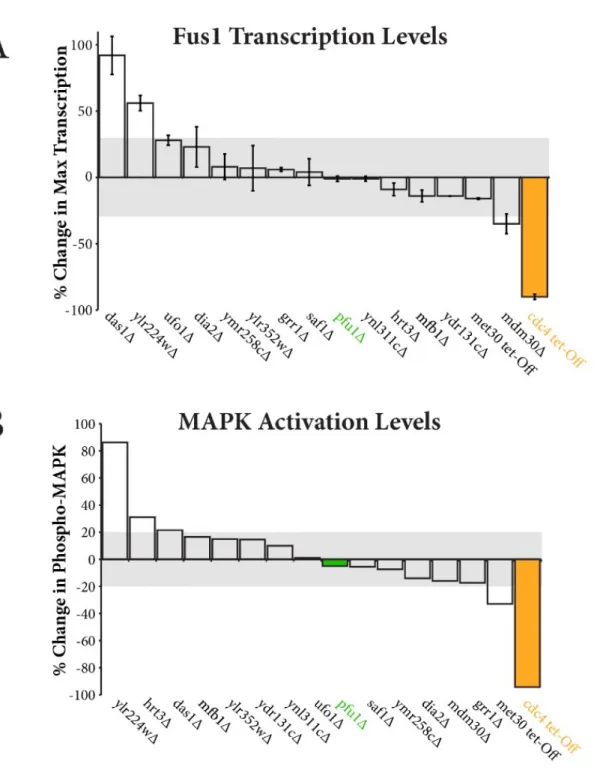
The results of our initial screen reveal multiple F-box genes have a significant effect on the levels of FUS1 transcripts (Figure 3A). FUS1 transcription in
mdm30Δ decreased to a lesser extent than the cdc4 tet-Off mutant but nevertheless suggests that Mdm30 may also positively regulate the pathway response. Conversely, FUS1 transcripts increased in ylr224wΔ and das1Δ, indicating a negative role in pathway regulation for each respective F-box.
Though changes in FUS1 transcription indicate a biochemical
perturbation, they may not necessarily be specific to pheromone response genes. A parallel change in non-pathway-related transcripts could indicate a general trend in transcription. We measured transcriptional induction using the salt inducible promoter CRE-lacZ in mdm30Δ, das1Δ, and ylr224wΔ. We observed a decrease in CRE transcripts in the mdm30Δ mutant, suggesting a general decrease in transcription that is not pheromone specific
(Supplemental Figure 4). das1Δ and ylr224wΔ exhibited decreased and unchanged levels of CRE transcription, respectively. Thus, the increase in
FUS1 transcripts as a result of Das1 or YLR224w deletion is pheromone pathway specific.
To monitor pathway activation upstream of FUS1 transcription, we measured changes in MAPK activation by immunoblotting. Each mutant and wild type strain were stimulated with 3µM α-factor pheromone for 90
dehydrogenase. The main conclusions of our MAPK screen were in agreement with the transcriptional reporter assay. Whereas mdm30Δ
Figure 3. Changes in transcription and MAP kinase activation in F-box mutant cells. A) Plot shows percent change in maximum
FUS1 transcription levels in comparison to wild type cells. B) Plot shows percent change in MAP kinase phosphorylation in
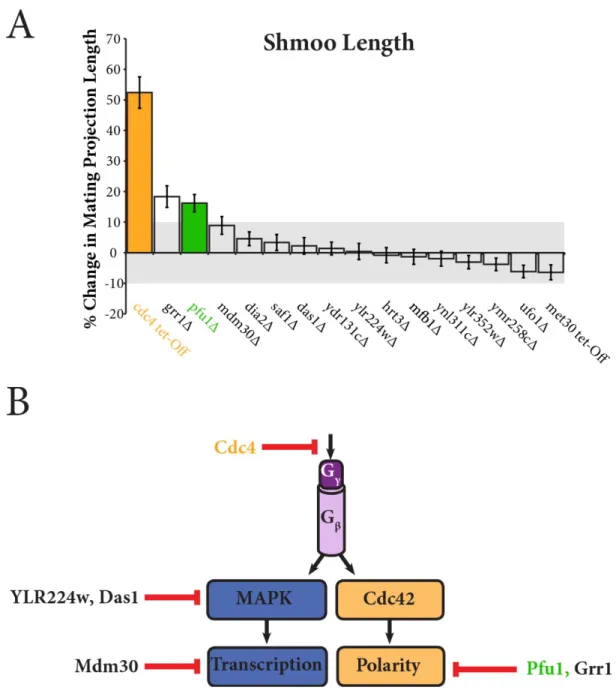
Pfu1, Grr1, and Cdc4 Mutants Produce Larger Mating Projections –
Next, we looked for variations in the polarized growth branch of the
pheromone response. We allowed each F-box mutant and wild type strain to grow for 18 hours in 30 µM α-factor and nutrient enriched media. We then quantified changes in cellular morphology as the percentage change in mating projection length in comparison to wild type cells. As expected, the Cdc4 tet-Off strain exhibited larger mating projection due to increased stability of Gpa1. Additionally, cells lacking Grr1 and Pfu1 have increased mating projections. Interestingly, deletion of neither Grr1 nor Pfu1 resulted in a substantial change in FUS1 transcription or MAPK activation. For this
Figure 4. A) Changes in mating projection length in F-box mutant cells. Plot shows percent change in mating projection length of the mutant strain in comparison to wild type. B) Summary of potential pathway regulators. Our summary
transcription branch while Pfu1 and Grr1 act on the polarity branch.
Pfu1 is needed to abandon a shmoo before starting another – We further investigated strains in which we were interested by microfluidic live-cell imaging, which has previously allowed us to track individual live-cell
morphology over 12-hour progressions (Dixit et al, 2014; Kelley et al, 2014). We exposed wild type and Pfu1Δ cells to 300 nM α-factor and monitored the location of the polar cap using Bem1-GFP as a reporter. When exposed to uniform pheromone, wild type cells elongate in one direction with the polar cap located at the shmoo tip (Figure 5A). After failing to find a mating partner, yeast abandon the initial shmoo, relocate its polarity machinery to another plasma membrane site, and begin to elongate in a new direction. This second shmoo is generally ~120 degrees away from the initial mating projection. If the cell fails to mate once again, it will produce a third shmoo ~120 degrees from the previous two. In cells lacking Pfu1, we do not observe this characteristic response to pheromone. These mutants fail to abandon the first mating projection; instead, they form a second shmoo that
Figure 5. Bem1 localization in wild type cells exposed to 300 nM α-Factor over a 500 minute time course. B) Bem1 localization in
pfu1Δ cells exposed to 300 nM α-Factor over a 700 minute time course.
B. DISCUSSION
The yeast pheromone pathway is a powerful system for studying G-proteins and MAPK signaling. Both heterotrimeric and MAPK pathways are potent, highly conserved signaling pathways found in organisms as diverse as yeast and humans. Transmembrane G-protein coupled receptors
recognize a wide array of ligands, making them excellent drug targets. In fact, nearly 40% of FDA approved drugs target GPCRs (Filmore D, 2004). Although GPCRs have proven to be effective means of preventing conditions such as heart failure, the activation or inhibition of receptors causes a broad signaling effect. This often results in undesired side effects or decreased efficacy over time. Additionally, uncontrolled growth is a characteristic step that occurs in all cancers (Downward J, 2003). Many cancers are derived from defects in MAPK signaling that leads to uncontrolled growth. By vigorously studying MAPK and heterotrimeric G-protein pathways in basic organisms, we will gain the necessary knowledge to tackle relevant
pharmacological issues. The yeast pheromone pathway provides a means to examine both pathways at once.
Das1, YLR224w and Mdm30 as potential regulators (Figure 3). Das1 and YLR224w appear to function at, or prior to, the level of MAPK activation, as the null mutant resulted in increased level of MAPK phosphorylation and
FUS1 transcription. Mdm30 appears to function downstream of MAPK
activation yet prior to FUS1 transcription. The proposed function of Mdm30 was ascertained by the Mdm30 null mutant resulting in negligible change in phosphorylated MAPK and decreased FUS1 transcription. The decreased transcription levels in mdm30Δ are not pheromone specific, because a
similar decrease in transcription was observed in the salt-inducible CRE-lacZ assay (Supplemental Figure 4).
Our screen for changes in pheromone-induced polarized growth
revealed Grr1 and Pfu1 as potential regulators of the polarity branch (Figure 4A). Pfu1 serves as an interesting candidate regulator because of its
additional characteristics related to polarity. Pfu1 was shown to be haploid-specific in a systematic study of yeast genes (Godoy et al, 2008). It occurred to us that Pfu1 likely targets a component of the pheromone pathway that is absent in diploid cells. Secondly, Pfu1 was previously shown to bind Bem1 (Tonikian et al, 2009). While this interaction was observed in a high
morphology of rga1Δ cells (Supplemental Figure 3). As a GTPase Activating Protein (GAP) for Cdc42, Rga1 negatively regulates cellular polarity in yeast. We reasoned that Pfu1 may promote the degradation of a positive regulator of polarity.
IV. AUTHOR CONTRIBUTIONS
J.B.K, J.H.H, and H.G.D. conceived the study and designed the
experiments. J.H.H. constructed strains, performed MAPK assays, and performed FUS1-lacZ assays. J.B.S. performed the microscopy
experiments, constructed strains, performed image analysis,
V. REFERENCES
1. Hershko, A., Ciechanover, A. (1998) The ubiquitin system. Annu. Rev. Biochem. 67, 425-79.
2. Schaefer, A., Nethe, M., Hordijk, P. L. (2012) Ubiquitin links to
cytoskeletal dynamics, cell adhesion and migration. Biochem J. 442(1), 13-25.
3. Dixit, G., Kelley, J. B., Houser, J. R., Elston, T. C., Dohlman, H. G. (2014) Guanine nucleotide-binding protein (Gα) endocytosis by a cascade of ubiquitin binding domain proteins is required for sustained
morphogenesis and proper mating in yeast. J. Biol. Chem. 289(21), 15052-63.
4. Pickart, C. M. (2001) Mechanisms underlying ubiquitination. Annu. Re. Biochem. 70, 503-33.
5. Kus, B. M., Caldon, C. E., Andorn-Broza, R., Edwards, A. M. (2004)
Functional interaction of 13 yeast SCF complexes with a set of yeast E2 enzymes in vitro. Proteins. 54(3), 4555-67.
6. Varshavsky, A. (2012) The ubiquitin system, an immense realm. Annu Rev. Biochem. 81, 167-76.
7. Deshaies, R. J., Joazerio, C. A. (2009) RING domain E3 ubiquitin ligases.
8. Voges, D., Zwickl, P., Baumeister, W. (1999) The 26S proteasome: a molecular machine designed for controlled proteolysis. Annu. Rev. Biochem. 68, 1015-68.
9. Cardozo, T., Pagano, M. (2004) The SCF ubiquitin ligase: insights into a molecular machine. Nat. Rev. Mol Cell Biol. 5(9), 739-51.
10. Landry, B. D., Doyle, J. P., Toczyski, D. P., Benanti, J. A. (2012) F-box protein specificity for g1 cyclins is dictated by subcellular
localization. PLoS Genet. 8(7), e1002851.
11. Zhou, P., Bogacki, R., McReynolds, L., Howley, P. M. (2000) Harnessing the ubiquitination machinery to target the degradation of specific cellular proteins. Mol. Cell. 6(3), 751-6.
12. Patton, E. E., Willems, A. R., Tyers, M. (1998) Combinatorial control in ubiquitin-dependent proteolysis: don’t Skp the F-box hypothesis. Trends Genet. 14(6), 236-43.
13. Cappell, S. D., Baker, R., Skowyra, D., Dohlman, H. G. (2010) Systematic analysis of essential genes reveals important regulators of G protein signaling. Mol. Cell. 38(5), 746-57.
14. Blondel, M., Galan, J. M., Chi, Y., Lafourcade, C., Longaretti, C., Deshaies, R. J., Peter, M. (2000) Nuclear-specific degradation of Far1 is controlled by the localization of the F-box protein Cdc4. EMBO J.
19(22), 6085-97.
mitrogen-activated protein kinase (MAPK) specificity. J. Biol. Chem.
288(26), 18660-71.
16. Dohlman, H. G., Thorner, J. W. (2001) Regulation of G protein-initiated signal transduction in yeast: paradigms and principles. Annu. Rev. Biochem. 70, 703-54.
17. Melendez, J., Grogg, M., Zheng, Y. (2011) Signaling role of Cdc42 in regulating mammalian physiology. J. Biol. Chem. 286(4), 2375-81. 18. Etienne-Manneville, S. (2004) Cdc42—the centre of polarity. J.
Cell Sci. 117(8), 1291-300.
19. Chenevert, J., Corrado, K., Bender, A., Pringle, J., Herskowitz, I. (1992) A yeast gene (BEM1) necessary for cell polarization whose product contains two SH3 domains. Nature. 356(6364), 77-9.
20. Yamaguchi, Y., Ota, K., Ito, T. (2007) A novel Cdc42-interacting domain of the yeast polarity establishment protein Bem1. Implications for modulation of mating pheromone signaling. J. Biol. Chem. 282(1), 29-38.
21. Takuku, T., Ogura, K., Kumeta, H., Yoshida, N., Inagaki, F. (2010) Solution structure of a novel Cdc42 binding module of Bem1 and its interaction with Ste20 and Cdc42. J. Biol. Chem. 285(25), 19346-53. 22. Kelley, J. B., Dixit, G., Sheetz, J. B., Venkatapurapu, S. P., Elston,
T. C., Dohlman, H. G. (2015) RGS proteins and septins cooperate to promote chemotropism by regulating polar cap mobility. Curr. Biol.
23. Winzeler, E. A., Shoemaker, D. D., Astromoff, A., Liang, H.,
Anderson, K., Andre, B., Bangham, R., Benito, R., Boeke, J. D., Bussey, H., Chu, A. M., Connelly, C., Davis, K., Dietrich, F., Dow, S. W., El
Bakkoury, M., Foury, F., Friend, S. H., Gentalen, E., Giaever, G., Hegemann, J. H., Jones, T., Laub, M., Liao, H., Liebundguth, N.,
Lockhart, D. J., Lucau-Danila, A., Lussier, M., M’Rabet, N., Menard, P., Mittmann, M., Pai, C., Rebischug, C., Revuelta, J. L., Riles, L., Roberts, C. J., Ross-MacDonald, P., Scherens, B., Synder, M., Sookhai-Mahadeo, S., Storms, R. K., Véronneau, S., Voet, M., Volckaert, G., Ward, T. R., Wysocki, R., Yen, G. S., Yu, K., Zimmermann, K., Philippsen, P.,
Johnston, M., Davis, R. W. (1999) Functional characterization of the S. cerevisiae genome by gene deletion and parallel analysis. Science.
285(5429), 901-6.
24. Huh, W. K., Falvo, J. V., Gerke, L. C., Carroll, A. S., Howson, R. W., Weissman, J. S., O’Shea E. K. (2003) Global analysis of protein
localization in budding yeast. Nature. 425(6959), 686-91.
26. Hoffman, G. A., Garrison, T. R., Dohlman, H. G. (2002) Analysis of RGS proteins in Saccharomyces cerevisiae. Methods Enzymol. 344, 617-631
27. Tatebayashi, K., Yamamoto, K., Tanaka, K., Tomida, T., Maruoka T., Kasukawa, E., Saito, H. (2006) Adaptor functions of Cdc42, Ste50, and Sho1 in the yeast osmoregulatory HOG MAPK pathway. EMBO J.
25(13), 3033-44.
28. Chasse, S. A., Dohlman, H. G., (2004) Identification of yeast pheromone pathway modulators by high-throughput agonist response profiling of a yeast gene knockout strain collection. Methods Enzymol.
389, 399-409.
29. Dixit, G., Kelley, J. B., Houser, J. R., Elston, T. C., Dohlman, H. G. (2014) Cellular noise suppression by the regulator of G protein
signaling Sst2. Mol. Cell. 55(1), 85-96.
30. Schindelin, J., Arganda-Carreras, I., Frise, E., Kaynig, V., Longair, M., Pietzsch, T., Preibisch, S., Rueden, C., Saalfeld, S., Schmid, B., Tinevez, J. Y., White, D. J., Hartenstein, V., Eliceiri, K., Tomancak, P., Cardona, A. (2012) Fiji: an open-source platform for biological-image analysis. Nat. Methods. 9(7), 676-82.
32. Brown, J. L., Jaquenoud, M., Gulli, M. P., Chant, J., Peter, M. (1997) Novel Cdc42-binding proteins Gic1 and Gic2 control cell polarity in yeast. Genes Dev. 11(22), 2972-82.
33. Tonikian, R., Xin, X., Toret, C. P., Gfeller, D., Landgraf, C., Panni, S., Paoluzi, S., Castagnoli, L., Currell, B., Seshagiri, S., Yu, H., Winsor, B., Vidal, M., Gerstein, M. B., Bader, G. D., Volkmer, R., Cesareni, G., Drubin, D. G., Kim, P. M., Sidhu, S. S., Boone, C. (2009) Bayesian modeling of the yeast SH3 domain interactome predicts
spatiotemporal dynamics of endocytosis proteins. PLoS Biol. 7(10), e1000218.
34. Filmore, D. (2004) It’s a GPCR world. Mod. Drug Disc. 7(11), 24-28.
35. Downward, J. (2003) Targeting RAS signalling pathways in cancer therapy. Nat. Rev. Cancer. 3(1), 11-22.
VI. SUPPLEMENTAL DATA
Supplemental Figure 2. A) Microfluidic Live-Cell Imaging. Yeast are imaged in the central cell trap, while media flows past either side of the imaging area. Nutrients and stimuli diffuse through feeder channels to the cells, maintaining a homeostatic environment for long periods of time. Use of different solutions for the two sides allows formation of a gradient across the cell imaging area. This device was designed by the Hasty Lab at UCSD. B)
Cell Periphery Kymographs. Kymographs demonstrate changes in localization along the cellular periphery over time. Bem1-GFP is used as polar cap
Supplemental Figure 4. The following data comprises the MAPK/FUS1-lacZ screens in each of the 16 mutant strains. This data was collected by Jillian Hurst and Everett Young.
pp-Fus3 pp-Kss1
YDR306c
YLR224w
P-Kss1
0 5 15 30 60 90 0 5 15 30 60 90