Evaluating the Euro: An exploration of the Euro’s impacts on the European Monetary Union
Daniel V. Maltsev
An honors thesis submitted to the faculty of the Kenan-Flagler Business School at the University of North Carolina at Chapel Hill
Chapel Hill 2017
ABSTRACT Daniel Maltsev
Evaluating the Euro: An exploration of the Euro’s impacts on the European Monetary Union (Under the direction of Douglas Elvers)
LIST OF TABLES
Table 6.1 SEA Real GDP Growth, Government Surplus (Deficit) and Government Debt 2008-2012. . . .. . . .47 Table 6.2 SEA Real GDP Growth, Government Surplus (Deficit) and Government Debt
2012-2015. . . .. . . .49 Table 7.1 EMU Nations’ Maastricht Criteria Metrics 1998. . . .. . . 55 Table 7.2 Southern Eurozone Area Debt Held by Core Eurozone Banks
LIST OF FIGURES
Figure 4.1 NEA Current Account Balances as Percent of GDP 1992-1999 . . . 18
Figure 4.2 NEA Government Surplus/Deficit as Percent of GDP 1992-1999 . . . 19
Figure 4.3 NEA Current Account Balances as Percent of GDP 1999-2009 . . . 21
Figure 4.4 NEA Yearly Percentage GDP Growth 1999-2008. . . 22
Figure 4.5 NEA Annual Percentage GDP Growth 2008-2015. . . . . . 24
Figure 5.1 German Current Account Balance 1999-2013. . . 30
Figure 5.2 Current Account Balances in Germany, Italy, Portugal and Spain 1999-2008. . . 34
Figure 6.1 SEA Current Account Balances as Percent of GDP 1990-1999. . . 42
Figure 6.2 Italy, Spain, and Portugal 1992-1999 Long-Term Bond Yields 1992-1999. . . . . . .43
Figure 6.3 Italy, Spain and Portugal Percent Change in GDP 1999-2008. . . 44
Figure 7.1 Current Account Balances in Germany, Italy, Portugal and Spain 1999-2008. . . 59
TABLE OF CONTENTS
ABSTRACT . . . .ii
LIST OF TABLES . . . .iii
LIST OF FIGURES . . . iv
Chapter I. INTRODUCTION. . . . . . 1
II. LITERATURE REVIEW. . . . . . 4
A. Establishing the Euro. . . . 4
B. After the Euro’s Implementation . . . 7
C. The Eurozone Debt Crisis. . . . . . .. . . 10
D. The Future of the Euro. . . .. . . 11
III. METHODOLOGY. . . .. . . . . . 13
A. Primary Research and Data Analysis . . . 13
B. Secondary Qualitative and Quantitative Research . .. .. . . 14
IV. NORTHERN EUROZONE AREA (NEA). . . .17
A. NEA Pre-Euro Implementation (1992-1999). . . .18
B. NEA Post-Euro Implementation (1999-2009). . . .20
C. NEA During the Eurozone Debt Crisis (2009-2014). . . 23
D. NEA Since the Eurozone Debt Crisis. . . 23
V. GERMANY. . . .26
A. Germany’s Role in Establishing the Euro (1992-1999). . . . . . .28
1. Germany’s Policies Set Path to Divergence. . . 33
C. Germany in the Eurozone Debt Crisis (2009-2014). . . 35
D. Germany Since the Debt Crisis (2014-Present).. . . .. . . 37
VI. SOUTHERN EUROZONE AREA (SEA). . . .. . . 39
A. The SEA Pre-Euro Implementation (1992-1999). . .. . . 40
B. The SEA After the Euro’s Implementation (1999-2009). . . 44
C. The SEA During the Eurozone Debt Crisis (2009-2014). . . 46
D. The SEA Since the Debt Crisis (2014-Present). . . .49
VII. EUROZONE. . . 52
A. Before the Euro’s Implementation (1992-1999). . . .. . . 52
B. After the Euro’s Implementation (1992-2009). . . 56
C. The Eurozone Debt Crisis. . . 60
1. Effect on Bond Yields. . .. . . 60
2. Policy Decisions and Push Toward Austerity. . . 65
D. The Eurozone Since the Debt Crisis (2014-Present). . . .. . . 69
E. The Future of the Eurozone. . . .71
1. Political and Social Uncertainty in the Eurozone. . . 71
2. Economic Uncertainty of the Euro. . . 73
VIII. CONCLUSION. . . ..76
INTRODUCTION
Originally implemented in 1999, the Euro has become a modern example of the economic effects of a monetary union. Eleven countries initially discontinued the use of their traditional national currency in favor of the Euro, thus establishing the European Monetary Union (EMU). Since 1999, the EMU has grown to include nineteen total member nations, with a growing number of other European nations expressing interest in joining the union.
However, the debate as to whether the implementation of the Euro has had a positive or negative effect on the Eurozone countries is more contentious than ever. Supporters of the Euro argue that monetary integration has led to increased trade and a more integrated European economy, while critics point to the lack of substantial European economic growth and the multi-year debt crisis that has strained the EMU. Both sides of the debate present various,
substantiated arguments that make the Euro’s efficacy even harder to judge.
Additionally, the lack of established criteria by which the Euro can be judged further complicates the matter. Definitive metrics to measure the Euro’s success were never set, and there is no timetable with regular intervals at which EMU members can evaluate their economic position and choose whether or not to continue with the Euro. Withdrawal from the EMU would be next to impossible, and legally controversial (Athanassiou, 2009). In short, the
implementation of the Euro set the EMU on a course of monetary integration that is, at least in the short term, irreversible.
This thesis aims to present a holistic view of the Euro’s impact on the Eurozone’s
Nations that implemented the Euro have experienced economic and financial benefits at times, and serious hardships in others. Furthermore, the heterogeneity of EMU nations – both economically and culturally – makes for a complex and nuanced union. Because the Eurozone is so politically and economically diverse, what is good for one nation may not necessarily be beneficial to the rest. A large governing body, made up of representatives from each EMU nation and charged with governing the Eurozone, is generally slow to act because of the
immensely difficult task of building consensus due to the varying interests of the member states. This complication has been particularly present in the last few years because of the strain the debt crisis put on the EMU.
In general, the majority of the Eurozone countries can be grouped into one of two
Although this methodology excludes two countries from specific consideration, it allows for an effective structure by which the overall effect of the Euro on the Eurozone can be
discussed. Additionally, 9 of the original 11 Eurozone nations fit into either the NEA or SEA grouping criteria, allowing for the vast majority of the Eurozone to be represented in the analysis.
Additionally, I have singled out Germany for additional discussion because of the pivotal role it has played throughout the Euro’s life. In the years between the signing of the Maastricht Treaty and the Euro’s implementation, the Germans had significant say in the vision of the Euro. Furthermore, particularly during and after the Euro crisis, Germany emerged as the leading voice in the Eurozone, both politically and economically.
LITERATURE REVIEW
Current literature on the topic of the Euro’s impacts generally focuses on one specific economic area or consequence (e.g. the Euro’s effect on Real Interest Rates or Current Account Balances). These relatively narrow approaches fail to present a holistic picture of the Euro’s overall impact on the Eurozone, thus making it harder to judge the Euro’s overall success or failure. My research aims to tie in both sides of the Euro debate to illustrate the Euro’s overall impact, making it easier to project the short and long-term economic effects EMU countries will face.
Analyzing the Euro’s overall historic trends, successes, and failures allows for a more informed projection of the future, as opposed to using any one particular data point (such as a month or one year’s worth of economic data). Thus, it is important to establish a timeline to contextualize the Euro’s progression through the 21st century. The timeline that I will focus on will include: the goals of establishing the Euro (1992-1999), the Euro’s impacts in its first decade (1999-2009), the Eurozone Debt Crisis (2009-2014), the Euro since the debt crisis (2014-present) and what the future of the Euro might entail.
Establishing the Euro (1992-1999)
At the time, a monetary union with such size and scope had never been attempted before, effectively making the move toward a common European currency unprecedented. As a result, the supporters of the Euro needed to build a strong case in support of the common
currency; one that aligned with Europe’s economic and political goals.
The Euro was established under the assumptions that it would: “bring Europe ever closer together, and was the next step in Europe’s integration; that the closer economic integration would lead to faster economic growth; and that this greater economic integration and the
consequent greater political integration would ensure a peaceful Europe” (Stiglitz, 2016). Since the Maastricht Treaty was signed in 1992, it gave member nations seven years to prepare, both economically and politically, for the Euro.
Given the macroeconomic instability throughout Europe at the time, the promise of economic integration and stability was attractive. A key advantage of implementing the Euro would be the removal of foreign exchange risk, which “would cut transaction costs, and increase planning security for transborder trade and investment…” (Regling, Deroose, Felke & Kutos, 2010). Advocates of the Euro argued that the removal of foreign exchange risk would greatly benefit an economically active, yet geographically small area such as Europe.
Furthermore, advocates argued that an integrated monetary policy would bring about macroeconomic stability in the region and lead to stable inflation rates that would not be heavily affected by single-country economic shocks, and would disallow currency devaluation as a means of emergency economic alignment (Regling et al., 2010). Advocates made the case that the Eurozone economy would, in theory, behave similarly to that of a single nation, with the traditional economic boundaries erased and integration encouraged.
However, many on the other side of the debate were skeptical of the Euro’s potential advantages. Critics of the Euro were primarily concerned about “the ability of the single
monetary policy to address country-specific shocks and about the interaction between centralized monetary policy and decentralized fiscal policy” (Regling et al, 2010). A singular Eurozone monetary policy coupled with individual countries’ fiscal policies could lead to economic divergence among member nations, particularly given the varying economic tendencies among Eurozone nations.
A singular currency would mean that individual countries would not have the ability to nominally devalue their national currency. Devaluing currency is an economic strategy often used by countries seeking to boost exports or foreign investment. While advocates of the Euro argued that the removal of this option in the Eurozone would lead to more stable interest rates and macroeconomic trends, critics insisted that the inability to devalue the national currency could hurt nations that struggle economically in relation to their neighbors.
experiment that could be scrapped if it did not accomplish its goals; rather, it was seen as a European economic and political project that understandably needed reevaluation and reform in the future (Juncker, Tusk, Dijsselbloem, Draghi & Schulz, 2014).
After the Euro’s Implementation (1999-2009)
Since no definitive criteria for success were set at the Euro’s inception, economists and politicians generally tend to analyze the Euro’s effects in relation to the goals in originally establishing the single currency. Economic metrics such as Current Account Balances and Interest Rates have commonly been analyzed in order to judge the Euro’s impacts on the Eurozone economies (De Grauwe 2013; Hall 2014; Hope 2016).
The debate among economists and politicians as to the Euro being a beneficial economic implementation remains contentious. Economists on both sides of the issue analyze economic data in varying ways in order to substantiate their view on the Euro. Because the Euro is a union of economics and politics, it is important to contextualize economic data, as well as to factor in external and internal political movements when analyzing the Euro. Many economic papers regarding the Euro fail to do so, opting instead to crunch raw data and present a conclusion based simply on econometrics.
have separate currencies (Glick & Rose, 2016). The Euro, along with a lack of foreign exchange risk, effective price comparison, and the advantages of a single market has proved to be effective in increasing trade volume within the Eurozone.
These findings are further substantiated by Mongelli and Vega (2006), who found that, “After the start of EMU, the [e]uro has already boosted intra-euro area trade by five to ten percent, and without trade diversion vis-à-vis the rest of the world (i.e., no ‘fortress Europe’)” (p.5). The consideration of trade diversion is an important one because it contextualizes
European trade within the broader scope of world trade. Mongelli and Vega’s findings show that intra-European trade has increased independently from EU countries’ increase in global trade.
However, some economists remain skeptical of the Euro’s direct involvement in
increasing trade flow within the Eurozone. Critics of the Euro argue that when contextualizing European trade patterns, trade between European countries had been trending upwards over the course of the second half of the 20th century. Furthermore, several key policy changes were made before the introduction of the Euro that boosted inter-European trade. The result of these policies was closer European integration, and increased trade flow was the logical conclusion of nearly fifty years of increasingly closer economic ties (Berger & Nitsch, 2008).
In addition to an increase in trade volume, the Euro has had a substantial effect on
Since the Euro’s introduction, there has been a divergence in Current Account Balances within the Eurozone. Varying fiscal policies contribute to this divergence, as each Eurozone member nation has autonomy in determining its own fiscal policy. Critics’ worry that a singular monetary policy coupled with independent fiscal policy has been validated in that several
Eurozone countries have run Current Account deficits for the majority of the Euro’s life (Regling et al., 2010). In addition, the lack of ability to devalue currency to boost foreign investment (theoretically driving Current Account Balances upward) accelerates the deterioration of a country’s Current Account Balance.
According to research gathered by Hope (2016), in general, countries in the Southern Euro Area (SEA) have trended downward in terms of Current Account Balance, while countries in Northern Europe and Scandinavia have trended upward. In particular, France, Greece, Italy, and Spain have seen a significant downward trend in Current Account Balances, while Germany and Austria have seen improvement. A negative Current Account Balance can be problematic over time because it forces a country to run a budgetary deficit in order to compensate for the lack of revenue from exports.
EMU, began to run higher deficits than their respective historical norms. (Jaumotte & Sodsriwiboon, 2010).
The divergence in Current Account Balances between the SEA and the rest of the
Eurozone corresponds to a divergence in fiscal policy as well. As the SEA began to run deficits, countries like Germany and Austria began to run surpluses (Regling et al, 2010).
The Eurozone Debt Crisis (2009-2014)
These fiscal divergences began to threaten the continued existence of the Euro during the global financial crisis of 2008 and the ensuing Eurozone crisis of 2009. Continued movement toward financial integration was always a large part of the Euro’s agenda, but the debt crisis that many Eurozone (particularly SEA) economies faced proved that the planned financial integration had not been quick enough. The external, country-specific shocks that critics had long worried about began to strain the foundation of the Eurozone.
As Eurozone countries such as Spain, Italy and Portugal began to run the risk of
defaulting on government debt, the Eurozone began to split on the issue of what caused the SEA Current Account deficits and the increased risk of SEA governments defaulting on debt.
Germany, in particular, pointed toward the SEA’s fiscal irresponsibility in running up massive Current Account deficits. Conversely, SEA countries pointed toward Germany’s insistence on low inflation rates and export-heavy tendencies as the reason why SEA economies could not compete enough to grow at a reasonable pace (Trautwein & Körner, 2014). Again, the inability to devalue currency hurt the SEA economies, and Germany’s tendency to run a Current Account surplus meant that another country had to run a correlating Current Account deficit.
after the Eurozone crisis, critics of the Euro attacked the previous successes of the Euro, as well as the lack of foresight of European economic leaders. A general consensus reached by the Euro’s supporters and critics alike was increased financial integration and fiscal structure was necessary in order to shield the Eurozone’s vulnerabilities and prevent another debt crisis. The Future of the Euro
Although the Eurozone has stabilized since the Eurozone debt crisis, the call for reform is still prevalent among EMU nations (Juncker et al., 2014). The economic divergence between Germany and the SEA continues to grow, and political tensions have arisen from economic disagreements on how to continue on with the Euro. Since the Eurozone debt crisis, the question has been posed of whether or not the Eurozone would benefit by some members withdrawing. Additionally, the British referendum to leave the European Union established a sort of precedent for a EU member leaving the EU.
The future of the Eurozone is relatively uncertain, but European countries are pushing hard in order to improve the monetary union. Because of the Euro’s benefits, and resulting tight-knit economic integration of the Eurozone, getting rid of the Euro would be such a gargantuan economic and legal task, that no Eurozone country is seriously considering it. Even one of the harshest critics of the Euro, a Nobel Prize winner, Joseph Stiglitz, concludes that the Euro “can and must be saved” (Stiglitz, 2016).
The consensus among European economic leaders is that there must be a push toward increased financial integration. Increased economic and financial integration would,
While the leaders of the Eurozone are not pushing for such radical short-term reform, they agree that structural economic reform is needed. As a result, the European Commission has put forth a 3-stage plan for “Completing Europe’s Economic and Monetary Union” (Juncker et al, 2014). The plan calls for establishing benchmarks for integration and a tiered approach on how to reach them. Overall, the call for structural reform and economic integration within the Eurozone is widespread, and being readily enacted by Eurozone leaders.
Much of the literature surrounding the future of the Eurozone revolves around a
METHODOLOGY
In order to approach the question of whether or not the Euro has had a positive impact on the original Eurozone countries, I have structured my research into two categories. The first category is comprised of primary raw data analysis. The second category is comprised of secondary research, both qualitative and quantitative.
I have decided to separate my research into these two buckets in order to gain a more holistic understanding of my research question. The secondary research allows me to utilize economic data analysis that has already been performed, as well as find qualitative historical data that will help contextualize the economic analysis. On the other hand, the primary research serves to illustrate several key economic trends and will supplement the secondary analysis that I find.
Primary Research and Data Analysis
GDP is one of the most commonly used indicators when looking at a nation’s economic health. Therefore, GDP trends are an important consideration to make when analyzing the impact of a monetary union such as the EMU.
Current Account Balances, simply, are the net sum of a country’s exports and imports. Since one of the main goals of the Euro’s implementation was to boost trade among the EMU, the analysis of Current Account Balances of Eurozone nations is critical in researching the effects of the Euro. Furthermore, analyzing the historical trends of the Current Account
Balances will serve to illustrate whether or not the Euro’s impacts (whether positive or negative) have been constant since its implementation.
Finally, the bond yields of a particular country indicate the health and confidence of the government’s credit. Higher bond yields typically indicate a riskier investment, with the
government offering a higher yield in order to compensate for the increased risk. Examining the bond yields of Eurozone nations over time will serve to illustrate how well or poorly individual governments are able to repay their debts and stave off financial instability.
In order to set a historical context, I aim to limit my time horizon to 1992 to the present. My reasoning is that starting the time horizon at 1992 allows for almost a decade of historical context before the Euro’s implementation, and is the point at which most future Eurozone countries became the modern economic versions of themselves (particularly Germany with its 1990 reunification).
Secondary Qualitative and Quantitative research
issue or geographic area, rather than attempting to tackle the question of its overall impact. As a result, tying these sources together in conversation with one another, particularly when their conclusions conflict provides a more holistic view of the Euro’s impact.
Similar to my primary research goals, when researching secondary economic analysis focus on macro-economic indicators and broad historical trends. My reasoning is two-fold. First, since my research question is targeted at analyzing the impacts of the Euro on the entirety of the Eurozone, I believe looking at broader economic indicators are more effective in illustrating the progression of the Eurozone as a whole throughout the period since the Euro’s implementation. Secondly, I believe incorporating analysis that factors in historical trends is important because it contextualizes the analysis over the given time period and could explain certain patterns (or lack thereof) in the Eurozone’s economic trends.
Since these secondary sources come from top economists, they are generally very detailed in their analysis of their particular topic. For example, an economic paper covering the GDP growth of a particular Eurozone nation over time can dissect the actual GDP numbers down into their root causes, whether it be a lowering level of unemployment or increased trade flows with surrounding nations. This analysis supplements my primary research and provide a deeper understanding of the economic trends that I have found.
argument could be made that economic instability – given the frequent change of governments – was inevitable, regardless of whether Italy implemented the Euro or retained the Lira.
Overall, I aim to tie my own economic analysis and historical and cultural context with that of top economists in order to present a holistic view of the impact of the Euro on the
NORTHERN EUROZONE AREA (NEA)
Northern Eurozone Area economies are centered around tight fiscal policy, high levels of wage coordination and restraint, and an export-led economic growth model (Hall, 2014; Hope, 2016; Lane, 2012). As the eleven nations that signed the Maastricht Treaty prepared to enter the European Monetary Union, Hall (2014) argues that NEA countries were particularly
well-positioned to benefit from the Euro because, “They could continue to pursue export-led growth strategies in a more favourable context in which their principal trading partners could no longer devalue in order to increase the competitiveness of their own products against those exports.”
As will be discussed, after the Euro was implemented, the NEA countries saw a Current Account Balance increase, and began to run a continued surplus. In particular, NEA countries benefited from the SEA’s lack of ability to devalue currency. Additionally, tight wage
coordination and restrained led to relatively lower labor costs, resulting in increased
competitiveness with the SEA (Hall, 2014). This led to a large flow of credit from the NEA countries to the SEA, allowing for constant budgetary surpluses and relatively low levels of debt within the NEA (Gros, 2012).
The NEA Pre-Euro Implementation (1992-1999)
After the signing of the Maastricht Treaty, the NEA countries, as a whole, had relatively balanced Current Accounts. In fact, only two of the NEA countries (Belgium and Netherlands) ran Current Account Surpluses in the 1990s. This trend would later reverse, as the entire NEA would run a Current Account Surplus for a number of years in the 2000s. However, before the implementation of the single currency, NEA Current Account Balances remained relatively balanced throughout the NEA. Figure 4.1 shows the Current Account Balances of NEA countries from 1992-1999.
Figure 4.1. NEA Current Account Balances as Percent of GDP 1992-1999*
Source: Knoema
*Luxembourg not included because of a lack of available data
-5.00 -3.00 -1.00 1.00 3.00 5.00 7.00 9.00
1992 1993 1994 1995 1996 1997 1998 1999
Pe
rc
ent
of
G
D
P
Year
Austria
Germany
Finland
Netherlands
Apart from Finland, no NEA country experienced a significant amount of fluctuation in its Current Account Balance, indicating that, for the most part, the period between the signing of the Maastricht Treaty and the Euro’s implementation was business as usual.
In addition to stable trends in Current Accounts, the NEA also went through a period of fiscal tightening in the 1990s in preparation for the Euro’s launch. Several NEA countries were well below the Maastricht Criterion of 3% government deficit in 1992, and began to implement stricter fiscal policies. Figure 4.2 shows the government surpluses/deficits of NEA countries from 1992-1999.
Figure 4.2. NEA Government Surplus/Deficit as Percent of GDP 1992-1999
Source: Federal Reserve Bank of St. Louis
As seen in Figure 4.2, all six NEA nations were within the 3% deficit mark by 1997. Unlike the SEA, the Northern Eurozone Area’s fiscal tightening was complimented by increasing or stable Current Account Balances. This correlation between increased fiscal discipline and stable Current Account Balances meant that the NEA was more prepared for the Euro’s implementation. By 1999, all NEA countries had either met all five Maastricht criteria, or were judged as being on a reasonable path to attain them.
-12 -10 -8 -6 -4 -2 0 2 4 6
1992 1993 1994 1995 1996 1997 1998 1999
NEA Post-Euro implementation (1999-2009)
Once the Euro was launched in 1999, the NEA began to see the benefits of its entrance into the EMU. Specifically, the lowered foreign exchange risk, focus on exports and restrained wage growth led the NEA to experience steady economic growth (Hall 2014; Hope 2016). Furthermore, the NEA, as a whole began to run substantial Current Account surpluses, along with increased credit flow to the Southern Eurozone nations (Gros, 2013). These two factors set the stage for the economic divergence that would ultimately call the Eurozone’s existence into question in the late 2000s.
Figure 4.3. NEA Current Account Balance as Percent of GDP 1999-2009
Source: Federal Reserve Bank of St. Louis
As shown in Figure 4.3, each of the NEA countries was running a Current Account Surplus by 2002, indicating that the NEA’s export-led economic model came into full fruition in the early 2000s. When considered individually, a nation’s Current Account surplus can point to stable and sustainable economic growth. Additionally, a continued Current Account surplus indicates a level of fiscal and economic discipline that can facilitate long-term economic and financial sustainability.
However, as Stiglitz (2016) points out, when a nation in a currency union runs a Current Account surplus, another nation must run a corresponding Current Account deficit. In the case of the Eurozone, the entirety of the NEA was running Current Account surpluses, meaning that the SEA was left with little choice but to run corresponding deficits. Additionally, the NEA’s (particularly Germany’s) emphasis on high export levels and fiscal discipline allowed for little downward flexibility when it came to Current Account and budgetary surpluses. As a result, the NEA systematically forced the SEA to run continued Current Account and budgetary deficits
-4.00 -2.00 0.00 2.00 4.00 6.00 8.00 10.00 12.00 14.00
1999 2000 2001 2002 2003 2004 2005 2006 2007 2008 2009
(De Grauwe, 2013; Hall, 2014; Jaumotte & Sodsriwiboon, 2013; Stiglitz, 2016). For a more detailed discussion of Current Account Balance divergence, see Chapter 7.
Unlike the booming SEA, the NEA experienced slower but steadier growth during the period after the Euro’s implementation. Figure 4.4 displays the annual percentage GDP growth of the NEA from 1999-2008
Figure 4.4. NEA Yearly Percentage GDP Growth 1999-2008
Source: Federal Reserve Bank of St. Louis
As evident in Figure 4.4, apart from Luxembourg, no NEA country experienced explosive GDP growth during the period following the Euro’s implementation. Hall (2014) argues that a lack of explosive growth in the NEA can be attributed to the tight fiscal policies implemented in the region. By running budgetary and Current Account surpluses, NEA nations kept internal demand restrained. Particularly in Germany, the emphasis on Stability Culture played a large role in keeping demand growth relatively low and exports relatively high. For a more detailed discussion of Stability Culture, see Chapter 5. Again, the Euro played a beneficial
-2 0 2 4 6 8 10
1999 2000 2001 2002 2003 2004 2005 2006 2007 2008
Pe
rc
ent
G
row
th
Year
Austria
Germany
Finland
Belgium
Luxembourg
role in the development of the NEA economies during this time period because it allowed the NEA to supply the demand growth of the SEA with its own credit and exports.
However, as discussed in Chapter 7, the divergence caused by the heterogeneity of the EMU economies and distinctly contrasting styles of the NEA and SEA culminated in the Eurozone debt crisis.
NEA during the Eurozone Debt Crisis (2009-2014)
Once the Eurozone debt crisis set in, the NEA was the only region of the two financially capable of putting forth the resources needed to save the whole Eurozone. In particular,
Germany led the charge from a resource and policy perspective. In general, the rest of the NEA followed Germany’s lead in terms of backing policy proposals (Bulmer, 2014). As a result, I discuss Germany’s approach toward the debt crisis in the Germany section, which can apply to the NEA policy approach as well.
NEA Since the Eurozone Debt Crisis
A more detailed analysis of the NEA’s economic developments within the context of the Eurozone can be found in Chapter 7. This section will focus on general economic development in the NEA since the debt crisis, as well as the level of public support for the Euro from the crisis up to the present time.
Figure 4.5. NEA Annual Percentage GDP Growth 2008-2015
Source: World Bank
As seen in Figure 4.5, the global financial crisis and ensuing Eurozone crisis led to negative growth in the entirety of the NEA area from 2009-2010. After that, unlike the SEA, the NEA was able to return to positive GDP growth because NEA nations did not require major economic policy changes like the SEA that caused short-term economic pain. As a result, the NEA was able to pull out of the debt crisis and begin to trend toward positive yearly economic growth.
Overall, the NEA was well-positioned to take advantage of the Euro’s implementation and did so. The NEA saw steady growth during the first decade after the Euro was implemented, and was able to expand on its export-led growth model by allowing it to compliment the SEA’s willingness to increase demand. However, the sustained Current Account Balance surpluses and willingness to provide credit to the SEA was a major factor in the Eurozone Debt Crisis. Once
-10.0 -8.0 -6.0 -4.0 -2.0 0.0 2.0 4.0 6.0 8.0
2008 2009 2010 2011 2012 2013 2014 2015
GERMANY
A founding member state of the Eurozone, Germany has emerged as the EMU’s strongest economy, and, therefore, maintains the most policy influence regarding the single currency. Overall, the Euro has benefited the German economically, and, arguably, politically. The German economy has steadily grown since the Euro’s implementation due to increased trade flow and disciplined fiscal policy. Additionally, Germany has become a European political powerhouse as a result of its economic standing. As a result, Germany currently wields the most political and economic influence in the Eurozone (Bulmer, 2014; Howarth & Rommerskirchen, 2013).
However, Germany’s economic success has come at the expense of other Eurozone countries that have been unable to maintain the same level of steady growth or fiscal discipline. Moreover, the seemingly unwavering German insistence on the consistent monetary policy of low inflation leaves little flexibility for other Eurozone countries. Germany’s considerable economic and political power within the Eurozone suggest that this preferred policy will not change any time soon, which I argue will lead to a perpetual economic tension between Germany and SEA countries.
Despite Germany benefiting from the Euro, and the current majority of German citizens supporting the continued use of the currency (Eurobarometer, 2016), there was initial public opposition to the implementation of the currency. This opposition stemmed from a concept central to understanding German political and economic policy – the Stability Culture (Howarth & Rommerskirchen, 2013).
levels of debt and focus on fiscal responsibility. Among the German public, low inflation was among the most important of policy goals, regardless of political party. The term emerged in the early 1990s in reference to public opposition of the Euro. Germans saw the move away from the Deutschmark as a potential inflation-inducing risk because of the integration with other
European economies that were seen as less disciplined. Moreover, the move toward the Euro meant the German government would relinquish control of the country’s monetary policy, and link its economy permanently to other European nations (Howarth & Rommerskirchen, 2013). Ultimately, as discussed in Chapter 3, the Maastricht Treaty was ratified despite the German public’s opposition.
After the Euro was introduced, the term Stability Culture was politically pivoted to describe the Euro and the low inflation rates brought about by European economic integration. German politicians were able to successfully integrate the idea of the Euro with the continuation of the Stability Culture, and Germans began to believe that, “Germany was not surrendering its currency culture, but rather exporting it throughout the Eurozone” (Howarth & Rommerskirchen, 2013). Howarth and Rommerskirchen conclude that, presently, inflation aversion (Stability Culture) remains a top priority for German voters, regardless of political party or demographic. Because of this insistence of stability, it is safe to assume that regardless of which political party is in power in Germany, the insistence of Stability Culture will remain strong as ever. Voters’ preference for this economic tendency will ensure that Germany’s economic policy will reflect its desire to maintain the Stability Culture.
support for the Euro has increased in the last decade. Currently, 61% of the German population believes the Euro is beneficial to Germany (Eurobarometer, 2016).
Germany’s Role in Establishing the Euro (1992-1999)
As one of Europe’s strongest economies at the time, Germany played an integral role in the foundation and implementation of the Euro. Helmut Kohl, Germany’s chancellor at the time, was one of the primary champions of the Euro. The motivation for establishing the EMU, however, was not purely economic. De Grauwe (2013) argues that, “the ultimate objective was to permanently link the fates of Germany and France and thereby make future wars in Europe impossible.” If the ultimate objective was, in fact, political, it is not unreasonable to assume that economic shortcomings were overlooked in order to push the Maastricht Treaty through.
Moreover, Kohl faced significant opposition from the German population, who were reluctant to trade in the stability and independence of the Deutschmark for the untested Euro (De Grauwe, 2013).
European economic integration was a longstanding goal before the introduction of the Euro through the European Monetary System (EMS), in which European currencies were linked in a system of currency pegging. In the EMS, Germans viewed Stability Culture as a political, economic, and culture fixture. The fate of Germany’s economy was in the hands of Germans, even though the EMS pushed for continuing integration.
facto economic leader of Europe leading up to the Maastricht treaty (De Grauwe 2013). Because the German economy was at the forefront of European economic policy and maintained
monetary and fiscal autonomy, “with the [Deutschmark] as the anchor of the system, the
asymmetrical nature of the EMS therefore did not challenge German stability culture” (Bulmer, 2014). The move toward the Euro meant giving up the leading role in the European economic system in exchange for an equal seat at the table with other European nations that were not as economically disciplined as Germany. As a result, the Germans heavily influenced conditions for the founding of the EMU.
In particular, the central values of the Stability Culture were implemented in the EMU. This entailed keeping inflation levels low and maintaining price stability – a policy identical to the traditional monetary policy of the Bundesbank (Bulmer, 2014). Furthermore, Germans sought to depoliticize the common monetary policy in order to ensure an objective structure that would be better suited to achieve its Stability Culture goals (Enderlein, Gnath & Haas, 2016).
After the Euro’s Implementation (1999-2009)
As the Euro came into circulation in the Eurozone, Germany continued its economic and monetary policy trends of low inflation and price stability. Politicians such as Angela Merkel and her CDU party began to use the term Stability Culture in reference to the Euro and the pan-European stability it facilitated (Howarth & Rommerskirchen 2011). As a result, German public support for the Euro steadily increased, and Merkel, a champion of the Euro, has remained in power since 2005.
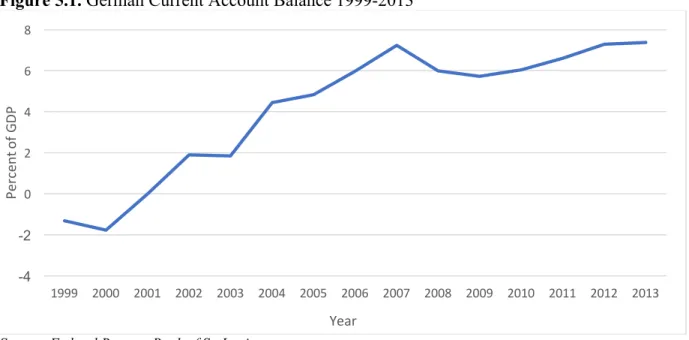
Furthermore, Germany began to run a Current Account Balance surplus, with the first net positive Current Account Balance coming in 2002 (Federal Reserve Bank St. Louis). As fiscal and budgetary conservatism continued to dominate German policy, the nation began running Current Account Balance surpluses every year since. Figure 5.1 shows Germany’s Current Account Balance since 1999.
Figure 5.1. German Current Account Balance 1999-2013
Source: Federal Reserve Bank of St. Louis -4
-2
0 2 4 6 8
1999 2000 2001 2002 2003 2004 2005 2006 2007 2008 2009 2010 2011 2012 2013
Pe
rc
en
t o
f G
D
P
Account Balance surpluses by being in a better economic position than other Eurozone countries. For example, the population in Germany is the highest among the Eurozone nations, and its unit labor cost the lowest in the Eurozone (Bulmer, 2014).
Economic advantages such as low unit labor cost and a large labor force coupled with the Euro’s removal of foreign exchange risk and trade barriers served to significantly benefit
Germany’s economic growth since the introduction of the Euro. Additionally, institutionalized strategies and economic mindsets have proved imperative in Germany’s ability to significantly boost exports (and, therefore, Current Account Balances). Such strategies include: “central bank independence and monetary policy, universal banking with long-term engagement in industries, and openness to international trade” (Trautwein & Korner, 2014).
Central bank independence and monetary policy ensure that, barring a major shift in economic mindset or circumstance, monetary policy would remain fairly consistent.
Additionally, the German economic model is centered around minimal government interference (Bulmer, 2014). Coupled with Germans’ emphasis on low inflation and price stability, the
German central bank has maintained a steady policy in line with the idea of the Stability Culture. The policy of low inflation rates and price stability also contributed heavily to Germany’s increasing net Current Account Balance. Analysis done by Björksten and Syrjänen (2000) shows that the ideal rise in interest rates for Germany would be significantly less than that of other Eurozone countries such as Portugal and Ireland, and less than the weighted average of the entire Eurozone’s output. The analysis is based on the Taylor rule, a reduced-form equation used to determine the ideal percentage interest rate increase for every percent increase in inflation.
as Portugal (4.9) and Spain (4.6). Factoring in weighted averages of GDP, the optimal Taylor Rule interest rate for the Eurozone in 2000 would have been 2.4.
This difference optimal interest rate hikes illustrates a clear divergence in optimal monetary policy. In other words, a one-size-fits-all approach would be detrimental to several Eurozone economies’ long-term growth. For example, a higher optimal interest rate indicates that taking on debt should become more expensive, thus disincentivizing a nation from doing so.
However, in the Eurozone, there is a singular monetary policy, and therefore a singular interest rate that was lower than optimal for several Eurozone nations. As a result, nations such as Spain and Portugal were incentivized to take on relatively cheap debt (that they otherwise probably would not have) in order to spur short-term economic growth. Conversely, Germany’s optimal interest rate fell below the Eurozone’s, therefore making excessive borrowing
unattractive, leading to budgetary and Current Account surpluses.
Germany’s Policies Set Path to Divergence
However, there are many who argue that Germany’s insistence on this particular economic model was a key factor in the development of the Euro crisis. For example, Dulien and Guerot (2012) argue that German economic and political policies in the years leading up to the Eurozone crisis were almost exclusively focused inward, resulting in a lack of timely economic integration; “from a German point of view, no co-ordination [was] needed as long as everyone has the correct policies.” In other words, German policy in the 2000s largely ignored the increasing divergence in the Eurozone, and believed that institutional safeguards such as the Stability and Growth Pact would ensure that divergence would be restrained to a manageable level. Increasing divergence would therefore be seen as a nation’s lack of discipline in following the Stability and Growth Pact (Hall, 2014).
Furthermore, Enderlein et al. (2016) argue that, “Germany’s original idea of stability was too narrow for the monetary union.” The one-size-fits-all monetary policy of the ECB benefited Germany in particular, but ended up hindering competitiveness of other Eurozone countries. The original German effort to de-politicize the ECB and its policies ensured that the Eurozone’s monetary policy remained fairly constant, and immune to the pressures of struggling economies’ political and economic leaders.
Figure 5.2. Current Account Balances in Germany, Italy, Portugal and Spain 1999-2008
Source: Federal Reserve Bank of St. Louis
As seen in Figure 5.2, Germany’s consistent Current Account surplus (and corresponding budgetary surplus) meant that other Eurozone countries had to run corresponding Current
Account (and budgetary) deficits. Over time, these deficits added on growing debt levels and reduced competitiveness for Southern Euro Areas. Coupled with Germany’s insistence on an export-led economic system, the divergence in Current Account Balances was essentially inevitable.
Throughout the early 2000s, Germany experienced steady economic growth due to the Euro’s implementation because of its emphasis on Stability Culture, export-minded economic system, and fiscal discipline. However, these strategies also began to set Germany on a course of divergence with other Eurozone countries that were conversely taking on relatively cheap debt
-15 -10 -5 0 5 10
1999 2000 2001 2002 2003 2004 2005 2006 2007 2008
Pe
ce
nt
of
G
D
P
Year
Italy
Eurozone debt crises, this divergence played a key role in establishing Germany’s current position among Eurozone economies.
Germany in the Eurozone Debt Crisis (2009-2014)
Because of Germany’s economic strength and influence on the ECB, it emerged as the de facto head of the effort to save the Euro, and dictated many of the resulting conditions (Bulmer, 2014). This ascension to the lead role was the result of the strength of Germany’s economic model, as well as the large amount of credit German banks had issued other Eurozone
institutions in the years leading up to the Euro crisis (Morisse-Schilbach, 2011). Furthermore, German shares of the ECB total 27%, more than any other Eurozone nation (Schild, 2013).
This economic leadership did not always result in proactivity, or even immediate reaction. Additionally, as an equal member of the Eurozone, Germany did not have unilateral authority to enact its proposed remedies to the Euro crisis. Other EMU nations such as France pushed their economic agenda as well, leading to both political and economic standoffs between Germany and other Eurozone nations. German culture places emphasis on careful dialogue preceding policy decisions and a relatively even balance of power (Bohn & de Jong, 2011). As a result, Germany’s longtime Chancellor, Angela Merkel, avoided rash action during the crisis in favor of a more cautious approach.
Regardless, as the leader of the decision-making process, Germany maintained its traditional economic view and the Germans applied it to their view of the crisis. Furthermore, “…the German mainstream [saw] current account imbalances in the [E]urozone as a
undisciplined fiscal policy in Southern Eurozone countries, and the only remedy was to impose a system of fiscal discipline analogous to the German system of Stability Culture (Bulmer, 2014).
Consequently, Germany pushed for a solution to the crisis that involved the necessary bailouts of nations about to crack under the weight of their debt in exchange for strict austerity measures. The austerity measures would, theoretically, ensure that the countries receiving the financial aid would be set on a path toward fiscal discipline, and thus be less likely to find themselves in the same position in the future (Truger, 2013). The German push for austerity measures (the effects of which are hotly debated among economists and politicians) is
unsurprising given the Germans’ historic emphasis on financial discipline. Although Germany did not have unilateral decision making power, it carried a lot of weight, and was able to enact a lot of its desired policy points.
Given Germany’s superior economic position, it, along with France, often reached compromises in the nick of time, and pulled other nations into a sort of coalition in order to approve the agreed-upon deal (JovAnovic & Damnjanovic, 2013). This manner of political leadership often frustrated other Eurozone leaders. For example, in 2010, Italy’s Foreign Minister, Franco Frattini, referred to these kinds of deals as “pre-cooked decisions” (Dinmore, 2010).
Unsurprisingly, the German desired economic remedy to the crisis contrasted
the policy process during the debt crisis, however, the bailout of struggling Eurozone nations showed a German willingness and determination to keep the Euro alive.
Additionally, Germany further ingrained its fiscal responsibility on a domestic level by instituting a constitutional Schuldenbremse, or Debt Brake in 2009. This constitutional
amendment stipulates that, starting in 2016, there would be a federal borrowing cap of 0.35% of GDP (Howarth and Rommerskirchen 2013). The Debt Brake serves as a sort of doubling-down on fiscal discipline, and, since it is a constitutional amendment, will likely remain in place for the foreseeable future.
Germany Since the Debt (2014-present)
The German economic mindset has changed little since the implementation of the Euro. Given how ingrained this mindset is in the German public, it is unlikely that future German economic policy will differ greatly from its historical trend. Unfortunately for some of the other Eurozone countries, particularly those in the south, this consistent policy will likely mean continuing economic hardship. Because of German insistence on running Current Account and budgetary surpluses, and the self-imposed Debt Brake, Southern European countries will
continue to be externally pushed toward running Current Account deficits. Without the ability to devalue the local currency, Southern Eurozone Area nations will continue to lack price
competitiveness, meaning almost certain short-term economic hardship.
to prevent the Euro from failing, Germany will likely continue to pursue a path of steady
European integration. However, the Germans will continue to insist that this path of integration remain in line with the staple German economic tenants of fiscal responsibility, as evidenced by the push for austerity.
As a result, the Euro will continue to survive, but will most likely continue to experience a wide range of diversion between the Eurozone economies. Since all signs point to Germany being set in its ways economically, struggling Eurozone countries will find it difficult to close the gap without traditional strategies such as currency devaluation. Germany’s continued Current Account surpluses, Debt Brake and cultural insistence on a tight fiscal policy will mean other Eurozone nations will continue to endure the same relative economic disadvantages as they have since the Euro’s implementation.
Finally, Germany’s continued position at the forefront of European policy making and its role as the Eurozone’s chief creditor will mean that Eurozone policy will also likely change very little in the short-term. The only instance in which Germany would lose its leadership in
SOUTHERN EUROZONE AREA
As previously mentioned, I have defined the Southern Eurozone Area (SEA) as: Italy, Spain and Portugal. In general, SEA countries have relatively limited power in coordinating wage growth, have a low emphasis on training the workforce (and therefore rely heavily on unskilled labor), and have generally loose fiscal policies (Hall 2014). The reliance on unskilled labor and low coordination of wage growth has led to a lack of competitiveness with the Northern Eurozone Area (Hall, 2014; Hassel, 2014). As will be discussed, the low levels of wage restraint led to a decreasing level of competitiveness (Hassel, 2014). Because of a lack of sustainable competitiveness with the NEA, the SEA economies are centered around demand-driven growth (i.e. high levels of imports) (Hall, 2014).
In the years before the Euro’s implementation, SEA countries made an economic push to satisfy the Maastricht Criteria. By 1999, the three SEA nations had satisfied 4 of 5 criteria, and were deemed to be sufficiently on the way to satisfying the fifth. However, the satisfaction of the majority of the Maastricht Criteria did not necessarily mean that the SEA was prepared to enter the EMU. In particular, the national debt levels of the SEA nations were substantially higher than the 60% requirement, and would continue to grow after the Euro’s implementation, eventually leading to the Eurozone debt crisis.
As a result, SEA Current Account Balances (and budgets) began to deteriorate and diverge significantly from the NEA (Hope, 2016). In the long-term, this meant an unsustainable level of debt in the SEA and culminated in the Eurozone debt crisis. Because of the
economically weak position of Southern Eurozone nations, they had little opportunity to
influence the Eurozone policy decisions that sought to pull the EMU out of the crisis. In order to receive the necessary financial assistance from the rest of the EMU, the SEA was forced to implement austerity measures that pushed their economies into a recession.
The result has been declining public support for the Euro in the SEA countries and sluggish economic growth because of the austerity measures. In the short-term, the SEA will likely continue to experience sluggish growth, in addition to a growing debate within nations about continued membership in the EMU.
The SEA Pre-Euro Implementation (1992-1999)
Before the Euro’s implementation, the SEA countries experienced two economic trends that began to trend in the opposite direction after the signing of the Maastricht Treaty and before the Euro went into effect in 1999 – Current Account balances relatively close to zero and high budgetary deficits.
Once the Maastricht Criteria was implemented, the SEA economies began to reduce their budgetary deficits in preparation for the Euro’s implementation. Theoretically, lower fiscal deficits should serve to improve Current Account Balances. Additionally, interest rates in the SEA began to decline, giving SEA governments access to cheaper debt than they had before (Jaumotte & Sodsriwiboon, 2010).
Euro was implemented. Theoretically, this fiscal tightening signaled that the SEA countries were able to get their financial houses in order, and would be able to maintain an acceptable fiscal budget.
However, the fiscal budgetary improvements in the SEA in the lead up to the Euro’s implementation were not necessarily beneficial to the SEA’s long-term economic health. As confidence in the EMU began to drive down interest rates, SEA countries gained access to cheaper credit, and were able to fuel their demand-driven growth. As a result, prices and unit labor costs in the SEA countries began to increase significantly. As unit labor costs increase across the board, a nation begins to lose its competitiveness with its trading partners, because its products cost more to make. Because the competitiveness of SEA economies was driven
significantly by low-cost labor, the rising unit labor costs began to take a toll on SEA competitiveness. The area most affected by the decreased competitiveness was the Current Account Balance of SEA nations (Hall, 2014).
Figure 6.1. SEA Current Account Balances as Percent of GDP 1990-1999
Source: World Bank
As seen in Figure 6.1, SEA Current Account Balances began to rapidly deteriorate in the mid 1990s in the lead up to the Euro’s implementation. This trend would remain constant throughout the Euro’s lifetime, as SEA countries ran Current Account Balance deficits that corresponded with the NEA’s Current Account surpluses. Although the SEA’s fiscal deficits were moving toward zero, the Current Accounts were decreasing, signaling that the SEA was not as well-prepared for the Euro as it might have seemed.
As mentioned, once the Maastricht was signed, interest rates in the SEA began to fall. Figure 6.2. depicts the long-term government bond yields of the SEA nations.
-10.00 -8.00 -6.00 -4.00 -2.00 0.00 2.00 4.00
1990 1991 1992 1993 1994 1995 1996 1997 1998 1999
Pe
rc
ent
of
G
D
P
Year
Spain
Italy
Figure 6.2. Italy, Spain and Portugal 1992-1999 Long-Term Bond Yields 1992-1999
Source: Federal Reserve Bank of St. Louis
As seen in Figure 6.2, bond rates in the SEA dropped significantly in the mid-1990s, allowing for the governments in those nations to issue cheaper debt. The issuance of cheaper debt by SEA countries further contributed to the increasing Current Account deficit. Kosteletou (2012) finds that a sudden increase or decrease in interest rates will have a deteriorating effect on Current Account Balances. As shown in Figure 6.2, interest rates in the SEA quickly dropped after 1995, leading to a negative effect on SEA Current Account Balances. Intuitively, as credit becomes cheaper, a nation is incentivized to borrow more. In the demand-led growth model of the SEA, this increased credit was spent to drive demand up, resulting in a higher level of imports, and thus a deteriorating Current Account Balance.
Furthermore, Jaumotte and Sodsriwiboon (2010) point out that SEA countries began to finance their Current Accounts with debt instead of Foreign Direct Investment (FDI). In other words, SEA economic growth in the lead up to the Euro’s implementation was fueled
significantly by increased leverage instead of sustainable economic and financial practice.
0.00 2.00 4.00 6.00 8.00 10.00 12.00 14.00
1992 1993 1994 1995 1996 1997 1998 1999
SEA After the Euro’s Implementation (1999-2009)
Once the Euro was implemented, the economic trends from the mid-1990s continued. SEA Current Account Balances continued to diverge from the NEA, and SEA national debt continued to increase. However, the GDP of SEA nations began to increase as the result of the increased trade flow and removal of foreign exchange risk within the Eurozone. Figure 6.3 shows the GDP percentage growth from 1999-2008.
Figure 6.3. Italy, Spain and Portugal Percent Change in GDP 1999-2008
Source: Federal Reserve Bank of St. Louis
As shown in Figure 6.3, SEA countries’ GDPs increased significantly after the Euro was implemented in 1999 (with the exception of an economic contraction in Spain and Portugal in 2000). Key advantages of the Euro such as: removal of foreign exchange risk, the European single market, and stable interest rates led to short-term economic growth (Regling et al., 2010).
Thus, in terms of short-term economic growth, the Euro was beneficial to the SEA countries once it was originally implemented. As will be discussed, the increased trade flow the
-10.0 -5.0 0.0 5.0 10.0 15.0 20.0 25.0 30.0 35.0
1999 2000 2001 2002 2003 2004 2005 2006 2007 2008
Pe
rc
ent
C
ha
nge
Year
Italy
Spain
Euro brought about benefited SEA economies. Had the Euro not been implemented, it is doubtful that SEA economies would have seen such an increase in growth (Baldwin, 2006).
However, amid the economic growth, underlying economic problems in the SEA began to grow. In particular, SEA countries’ competitiveness relative to their northern neighbors did not increase (Hall, 2014). As Hassel points out, loss of competitiveness in SEA countries put pressure to increase compensation for labor. Increased compensation would, in turn, lower competitiveness because of a higher unit labor cost. In a single currency union, lowered
competiveness is an acute problem because of the lack of the most effective tool to combat a loss in competitiveness – the ability to devalue currency (Regling et al., 2010).
Thus, after the Euro’s implementation, the SEA’s lack of competitiveness in relation to the NEA began to grow (Hassel, 2014). Without the ability to devalue the currency, and with the NEA’s trend of running Current Account Surpluses, it is no surprise that the SEA’s Current Account Balance began to deteriorate at an increasing rate once the Euro was implemented.
Deteriorating Current Account Balances and a widening gap in competitiveness with the NEA set the stage for economic hardship in the SEA once the global financial and Eurozone crises set in. As Hope (2016) concludes, the EMU played an integral role in the SEA’s Current Account Balance deterioration, and SEA Current Accounts would not have decreased at such a pace if the Euro had not been implemented. Furthermore, without the ability to devalue
The SEA During the Eurozone Debt Crisis (2009-2014)
After the global financial crisis of 2008, the Eurozone (particularly the SEA) endured an ensuing financial shock as investors lost confidence in the SEA countries’ ability to repay their debts. Apart from economic downturn, the SEA also experienced political turmoil, as sudden shifts in government took place (Hassel, 2014). In Italy, then-Prime Minister, Silvio Berlusconi resigned. In Portugal and Spain, both incumbent Prime Ministers were defeated in elections. The ousting of incumbent governments indicated that the SEA public lost faith in their
governments’ ability to deal with the crisis, and incumbents were replaced with new coalitions tasked with pulling their nations out of the Eurozone crisis.
As Bosco and Verney (2012) point out, SEA politicians were put in a particularly difficult situation in having to deal with both Eurozone leaders (many of whom saw the SEA as primarily responsible for the debt crisis), and their respective electorates that wanted a solution that would be least painful for their own countries. Consequently, SEA leaders were caught between working with other Eurozone leaders in a lopsided power dynamic (which would be unpopular with their electorate) or making a more unrealistic push to get a better deal for their country (which would make them seem less credible to other Eurozone leaders). Ultimately, SEA governments turned toward the latter option, and began to implement austerity measures in an effort to mitigate the effects of the debt crisis.
In Portugal, these austerity measures were particularly difficult because they
the time the Portuguese government received a bailout in 2011, the budgetary deficit stood at -11.2 percent of GDP (Eurostat, 2016). In exchange for the 2011 bailout package, Portugal was forced to implement austerity measures, which further slowed down economic growth. Bosco and Verney (2012) point out that, unlike Portugal, Italy and Spain did not require a bailout packages, but were nonetheless hit hard by the Eurozone debt crisis. In Italy, a decade of loose fiscal policy and relatively slow growth resulted in speculative attacks on Italian bonds after an overall loss of investor confidence in the Southern Euro Area. High levels of existing
government debt and low growth patterns made Italy a prime target for a lack of investor confidence. Furthermore, as the increase in bond spreads rose along with the government debt and deficit, increased government spending to pull the economy out of the Eurozone crisis was rendered a non-option. In Spain, a 2008 housing bubble burst and the effects of a global
financial crisis sent the economy into a downward spiral. GDP growth and budgetary surpluses were replaced with negative growth and budgetary deficits. Notably, the unemployment rate among Spanish workers under 25 years old reached almost 50% in 2011.
Table 6.1.
SEA Real GDP Growth, Government Surplus (Deficit) and Government Debt 2008-2012
Portugal
2008 2009 2010 2011 2012
Real GDP Growth (Decline) as
a %
0.2 (3.0) 1.9 (1.8) (4.0)
Government Surplus (Deficit) as % of GDP
(3.8) (9.8) (11.2) (7.4) (5.7)
Government Debt as % of
Italy
2008 2009 2010 2011 2012
Real GDP Growth (Decline) as
a %
(1.1) (5.5) 1.7 0.6 (2.8)
Government Surplus (Deficit) as % of GDP
(2.7) (5.3) (4.2) (3.7) (2.9)
Government Debt as % of
GDP
102.4 112.5 115.4 116.5 123.3
Spain
2008 2009 2010 2011 2012
Real GDP Growth (Decline) as
a %
1.1 (3.6) 0.0 (1.0) (2.9)
Government Surplus (Deficit) as % of GDP
(3.8) (9.8) (11.2) (7.4) (5.7)
Government Debt as % of
GDP
39.4 52.7 60.1 69.5 85.7
Source: Eurostat
The SEA Since the Debt Crisis (2014-Present)
As discussed in Chapter 7, several policy decisions were implemented by the Eurozone in order to pull the EMU out of the debt crisis. The majority of these policies were aimed at
providing immediate financial aid to SEA countries under the condition that the SEA countries repay their debt and implement programs geared toward swift fiscal consolidation. As a result, public support for the Euro in the SEA has fallen considerably after the debt crisis. Not
surprisingly, austerity programs implemented in the SEA led to economic downturn, much to the frustration of the populations living in SEA nations. Table 5.2 shows key economic indicators for the SEA during and after the debt crisis
Table 6.2.
SEA Real GDP Growth, Government Surplus (Deficit) and Government Debt 2012-2015
Portugal
2012 2013 2014 2015
Real GDP Growth (Decline) as
a %
(4.0) (1.1) 0.9 1.6
Government Surplus (Deficit) as % of GDP
(7.4) (5.7) (4.8) (7.2)
Government Debt as % of
GDP
Italy
2012 2013 2014 2015
Real GDP Growth (Decline) as
a %
(2.8) (1.7) 0.1 0.7
Government Surplus (Deficit) as % of GDP
(2.9) (2.7) (3.0) (2.6)
Government Debt as % of
GDP
123.3 129.0 131.9 132.3
Spain
2012 2013 2014 2015
Real GDP Growth (Decline) as
a %
(2.9) (1.7) 1.4 3.2
Government Surplus (Deficit) as % of GDP
(10.5) (7.0) (6.0) (5.1)
Government Debt as % of
GDP
85.7 95.4 100.4 99.8
Source: Eurostat
As seen in table 6.2, sluggish (at times negative) GDP growth, high deficits and increasing debt levels continued in Southern Europe after the debt crisis was over. After austerity measures were implemented in the SEA, Lane (2012) and De Grauwe (2013) argued that austerity measures would only add to the government debt, while keeping economic growth to a minimal level. Table 6.2 provides affirmative evidence of their predictions. All three SEA countries have seen their government debt levels increase far above the mandated level of 60%.
increased significantly as the result of austerity measures and continued lack of competitiveness with the rest of the Eurozone.
Moreover, the economic turmoil during the debt crisis has facilitated a political shift in Southern Europe toward parties that oppose austerity reforms (Hall, 2014). Frequent
government turnover (particularly in Italy) has led to growing instability within the SEA as individual countries have yet to form a definitive political and economic long-term plan to deal with sluggish growth. Thus, the SEA is caught between an increasing number of voters who are Eurosceptic, and the political elite of the Eurozone calling for increased financial and political integration.
THE EUROZONE Before the Euro’s Implementation (1992-1999)
The European Monetary Union, established in 1992 by the Maastricht Treaty to be implemented in 1999, was, at the time, the next step toward greater European integration. Many European politicians believed that it would not only bring about increased integration, but also ensure political peace and cooperation throughout the Eurozone (Stiglitz, 2016). Thus, the motivation for establishing the EMU was not purely economical – the process also had important political implications.