Cabarrus County, North Carolina
By
Meghan Lewis
A Master’s Paper submitted to the faculty of the University of North Carolina at Chapel Hill
in partial fulfillment of the requirements for the degree of Master of Public Health in
the Public Health Leadership Program
Chapel Hill
2011
_________________________ Advisor Signature & Date
_________________________
_________________________ Second Reader & Date
List of Figures ... iii
Abstract ... 1
Introdu cti on ... 3
Background ... 4
National Community Health Assessment ... 5
North Carolina Community Health Assessment ... 7
Cabarrus County ... 8
Research Goal ... 10
Research Meth ods ... 11
IRB Review ... 12
Recruitment of Survey Population ... 13
Survey Instrument... 14
Results - Survey Fi ndings ... 16
Research Li mi tations ... 22
Dis cussi on ... 24
Recommend ati ons and Con c lusi ons ... 25
Ref eren ces ... 27
Appendi x A ... 30
Table 2 - Population Distribution ... 16
Table 3 - Percentage Distributions... 16
Table 4- Self Reported Industry Representation ... 17
Table 5- Utilization and Usage of CNA ... 17
Table 6- How Many Times was the CNA utilized? ... 18
Table 7- Likelihood of Using the 2012 CNA ... 18
Table 8 - Accessibility and Reliability ... 21
Table 9 - Options to Increase Utilization Among Cabarrus County Residents ... 21
L i s t o f F i g u r e s
Figure 1: States Participating in the Assessment Initiative by Funding Cycle, 1992–2012 (CDC, 2011) ... 3Figure 2 - Cabarrus County ... 8
Figure 3- Options to Increase Usability ... 19
Abstract
There are 100 counties in North Carolina and 85 local health departments. As of July 2011, roughly 72 percent of North Carolina health departments were accredited. This includes Cabarrus Health Alliance, located in Kannapolis, NC. One of many measures and standards used to award accreditation by the North Carolina Division of Public Health is a completed community health assessment. Currently, there is plethora of literature about how a community assessment can be beneficial to a community, but more documentation is needed to explain how North Carolina’s local health departments can use the data collected to maximize benefits to the community.
This research evaluates utilization of a community assessment, specifically among the individuals (Community Planning Council) involved in completing the assessment. The methods used for this research included data collection through an online survey to assess the level and patterns of utilization of the Cabarrus Community Needs Assessment (CNA). The online survey contained 25 questions; 16 questions were quantitative, and nine questions were qualitative.
A total of 65 prospective participants were contacted, who were members of the Community Planning Council spanning three separate assessment periods from 2004 through the presently convening 2012 Community Planning Council. Based on an emailed recruitment letter, with two follow-up requests, 38 participants responded to the survey, for a 58 percent response rate.
Results of this evaluation show that among the survey respondents 51 percent utilized the CNA to supplement a work related project and 16 percent utilized it to supplement a community project; 100 percent of respondents felt that the CNA was a valuable resource for Cabarrus County and 95 percent of respondents felt the CNA reported accurate statistics. Only 63 percent of respondents knew how to access the CNA online, which could suggest either low accessibility or respondents chose to utilize a hard copy version in lieu of being unable to access the CNA online. It also could indicate a low likelihood of future council members of using the new CNA, if the distribution and accessibility remain the same.
The three primary recommendations derived from this research center on themes of accessibility and education. The first recommendation is to improve accessibility by educating present and past council members on how to access the CNA online. The second recommendation is that Cabarrus Health Alliance increase the knowledge among stake holders in specific industries (healthcare, nonprofit and government) regarding the data included in the CNA and how it can be useful. Finally, the third recommendation is to modify and improve the distribution process of the final CNA document using specific methods recommended by survey respondents.
This research provided Cabarrus County an exciting opportunity to pilot a utilization evaluation based on the unique perspectives of members of the Cabarrus County Planning Council from three separate assessment periods. Finally, the success of this study shows that evaluating the CNA through a survey of key stakeholders, the planning council, is useful, feasible and can serve as a model for other counties in North Carolina.
Figure 1: States Participating in the Assessment Initiative by Funding Cycle, 1992–2012 (CDC, 2011)
Introduction
Twenty three years ago, the Institute of Medicine (IOM) published The Future of Public
Health. In this publication they defined the mission and the governmental role of public health.
The mission states that the role of public health is “fulfilling society's interest in assuring
conditions in which people can be healthy. Its aim is to generate organized community effort to
address the public interest in health by applying scientific and technical knowledge to prevent
disease and promote health” (1988, p.7). The mission of public health should be addressed by
multiple entities including: private organizations, individuals and public agencies. The IOM
emphasizes though that “the governmental public health agency has a unique function: to see to
it that vital elements are in place and that the mission is adequately addressed” (1998, p. 7). This
occurs at all levels, including federal, state, county and local and that each plays a unique role in
three core functions: assessment, policy development, and assurance.
This research focuses primarily
on the assessment role that the local
level of government plays in the overall
utilization and effectiveness of the
community health assessment. The
IOM committee responsible for the
publication of the Future of Public
Health recommends that every public
systematically collect, assemble, analyze, and make available information on the health of the
community” this assessment should include “statistics on health status, community health needs,
and epidemiologic and other studies of health problems” (1988, p.7).
In order to implement the IOM recommendations related to assessment, the Centers for
Disease Control and Prevention (CDC) initiated its first cycle of a five year cooperative
agreement in 1992 referred to as the Assessment Initiative (AI). The AI partners with state
health departments and since the inception of the project has partnered with 19 different states
during multiple five-year funding cycles. North Carolina is one of only two states that have been
funded in all three cycles for the AI. Figure 1 details the states which have participated in the AI
and their corresponding funding cycles.
Background
Local governments across the United States and the world are faced with rising demands
for health care, limited resources and increasing health disparities. Numerous national health
agencies, including the Centers for Disease Control and Prevention (1995), the Institutes of
Medicine (1988), and the Department of Health and Human Services, through their Compassion
Capital Fund (2003) emphasize that community assessments have a central part to play in
examining and indentifying areas of need. By completing an assessment a community enables
local health departments, practitioners, managers and policy makers to identify populations in
greatest need and to ensure that health care resources are used most efficiently to improve the
health status of those populations. A community health assessment (CHA) is a vital health care
planning tool to be used at the level of families, communities and populations (Stoto, 2009).
(2009), because the process and ultimate outcome, enables community decision makers to plan
and deliver the most effective care to those in greatest need. Although community assessments do not directly impact health, they are used as a tool to identify resources and barriers to population health and they should be evaluated on “on its own terms…both on the quality of the information that it produces and on its usefulness to the larger community process” (Friedman, 2009, pg. 5). The
National Association of County and City Health Officials (NACCHO), in their Accreditation
Preparation and Quality Improvement program emphasizes applying the principles of equity and
social justice in practice through assessing and completing health assessments.
The Assessment Initiative, a program funded through the CDC, states that a community
health assessment can assist in ensuring that scarce resources are allocated where they will yield
maximum health benefit and facilitate collaboration among community stakeholders in order to
determine which health issues cause greatest concern which leads to innovative interventions to
address those issues.
National Community Health Assessment
In 1992 the Centers for Disease Control and Prevention provided support and guidance to
state health departments in assessing their progress toward goals established in the Healthy
People 2000 objectives (Martin, 2009). Developing the Assessment Initiative (AI) program in
1992, the CDC “provided funds to six states to promote the development of innovative
partnerships between traditional public health agencies and other public and private
partnerships” (Dhara, 2002, p. 1). The AI began with eight states and a five year cooperative
Currently, the AI program is in its fourth 5-year cycle which ends in 2011. Program emphasis for
each 5-year funding cycle was tailored based on national public health needs.
With the support of the AI program, different tools and approaches have been developed
with to assist state and local health departments in working with communities to assess health
needs and develop plans to address them. North Carolina developed a model that is promoted
through the CDC Assessment Initiative Program website, “North Carolina: Eight-Step Approach
to Community Health Assessment” (CDC, 2011). This tool is in the form of a thorough Guide
Book which has been regularly updated (Healthy Carolinians, 2011). This guidebook offers a
national model for completing a community health assessment in eight phases.
Phase one of the guide book (Healthy Carolinians, 2011), establishes a Community
Health Assessment team, referred to in Cabarrus County and this research as the Community
Planning Council. The second phase is collecting community data, known as secondary data
from various reliable sources (i.e. US Census, North Carolina Health Data book, American
Community Survey, etc.). Phase three, is to collect primary data through a community wide
survey or key informant interviews. Phase four describes how to interpret and analyze the
primary and secondary data using a variety of methods, specifically citing scientific analysis.
The fifth phase has the community health assessment team select community priorities. The
methods for selecting these priorities include community presentations and meetings and
facilitated discussion sessions. The final three phases, six, seven and eight incorporate the final
indentified priorities and the collected data in order to develop a final CHA document,
disseminate the document and information to the community (through county determined
North Carolina Community Health Assessment
There are 100 counties in North Carolina and 85 local health departments. As of July
2011, 61 of those, roughly 72 percent of all health departments, were accredited. Although there
are many measures and standard used to award accreditation by the North Carolina Division of
Public Health one of those specific measures is a completed community health assessment.
The accreditation process, in North Carolina has been credited for promoting and
expediting the sharing of best practices throughout the state (Menkens, Stone, Wood & Reed,
2009). The accreditation process began in 2002 when the North Carolina Division of Public
Health and the North Carolina Association of Local Health Directors undertook an initiative to
develop a mandatory, standards-based system for accrediting local public health departments
throughout the state. Senate Bill 804 was signed in the fall of 2005, funding North Carolina
Local Health Department Accreditation, which was established to improve the public health
infrastructure by establishing an accreditation system for local health departments, as
recommended by the public health task force in 2004. As stated in the North Carolina Public
Health Task Force in the 2004 Report states that:
Community Health Assessment is also a critical part of the
accreditation of public health agencies. Local public health
agencies are mandated to conduct a collaborative, comprehensive
CHA every four years that must include a review and analysis of
secondary data, collection of primary data, and development of
community action plans. Primary data collection is key in engaging
Figure 2 - Cabarrus County community health improvement. (2005, p. 16).
The purpose of the North Carolina mandated community health assessment is to involve
community members in examining important health issues and in selecting areas that community
members identify as high priority (North Carolina State Center for Health Statistics, 2011).
In order for the 61 local health departments in the state of North Carolina to continue
being accredited every four years, they will be required to regularly submit a community health
assessment every four years and submit a narrative final report which includes indentified
priorities for the county (or multiple county districts). According to Healthy Carolinians, during
the three interim years between Community Health Assessments, the local health departments
are required to do a State-of-the-County's Health (SOTCH) Report. These SOTCH reports are
used to “track priority issues identified in the Community Health Assessment, identify emerging
issues; and highlight new initiatives” (Healthy Carolinians, 2011).
Cabarrus County
Cabarrus County is located just north of Mecklenburg County in the south-central region
of the state (Figure 2). Cabarrus County is uniquely situated in the state with both a very rural
population and also an urbanized center of
Kannapolis and Concord. The Cabarrus Health
Alliance, Cabarrus County’s local health
department, leads the county’s mandated public
health efforts. Cabarrus Health Alliance was organized in April of 1911 and is considered a
national health pioneer as one of the first comprehensive rural – urban public health departments
created by the Cabarrus County Board of Commissioners in 1997, and is governed by a
seven-member board. Healthy Cabarrus, a Certified Healthy Carolinians partnership, by the North
Carolina Governor’s Task Force for Healthy Carolinians, is led and facilitated by the Cabarrus
Health Alliance. Among other roles, Healthy Cabarrus leads the development and completion of
the community health assessment in Cabarrus County. The last Cabarrus community health
assessment was completed in 2008 and the 2012 assessment process commenced in the summer
of 2011.
In 2005, Cabarrus Health Alliance was one of the first local health departments in North
Carolina to achieve accreditation. Cabarrus Health Alliance had completed a needs assessment
every four years, beginning in 1997 (Healthy Cabarrus, 2007). As noted earlier, Cabarrus County
completes a “needs assessment” which differs from the tradiontional community health
assessment, but is intended to serve the same purpose. Cabarrus County completes the
Community Needs Assessment (CNA) which differs from the North Carolina mandated
Community Health Assessment slightly, as Cabarrus County includes additional indicators such
as: public transportation, behavioral health, dental, and a more in depth environmental review.
They analyze all the indicators (mandated and non-required) in order to select priorities. Their
final priorities often include a few health related priorities and a few priorities effecting a broader
industry or issue. They complete this CNA process by facilitating a collaborative partnership
between Cabarrus Health Alliance, Healthy Cabarrus, and a variety of public and private
representatives in the county. The private representatives are stakeholders and leaders within the
county from various industries including: healthcare, government, business, community service
this process. The first health assessment was completed in 1997 (before being state mandated for
accreditation) and has continued every four years (Healthy Cabarrus, 2007). Invited partners
convened a Community Planning Council which included representatives from health and human
services, the faith community, education, city and county government, foundations, businesses,
and community volunteers. The Council designed and conducted a research process with a
primary focus of identifying current and emerging community needs. The goals of the
Community Needs Assessment (CNA) include determining if the priority needs identified in
previous assessments have changed, identifying and documenting progress made since
publication of the previous assessment report, identifying new and emerging needs and issues,
and identifying community assets relative to the identified needs (Healthy Cabarrus, 2011).
Research Goal
Although there is plethora of literature about how a community assessment can be
beneficial to a community (Dhara, 2002; Curtis, 2002; Stafford-Alewine and Land, 2002;
Oswald and Collins, 2002; Spice and Snyder, 2009) more documentation is needed explaining
how North Carolina’s local health departments use the data collected in the health assessment.
More research is also needed to assess the usefulness of the process for the people involved in
completing the assessment.
The overall goal of the research presented in this paper is to add to the current body of
knowledge about how one local health department and the community it represents uses the
community health assessment after the report is submitted to the state; specifically this issue is
addressed from the perspective of Cabarrus County’s Community Planning Council. Knowledge
improve accessibility and increase utilization of the state mandated community health
assessments. This research will provide Cabarrus County an opportunity to pilot an evaluation of
the utilization based on the unique perspectives of members of the Cabarrus County Planning
Council from 3 separate assessment periods. Additionally, this research will present detailed
steps and methods used to perform the evaluation, should other local health departments embark
on evaluating their own community’s utilization of the Community Health Assessment. This
research will attempt to provide insight about how the Community Needs Assessment is being
used by the Cabarrus County stakeholders and will offer additional suggestions how the 2012
Community Planning Council in Cabarrus County could increase the accessibility and utilization
by community residents and planning council members alike.
Research Methods
In order to address the research goals described above I collected data from the members
of the Cabarrus County Planning Council who served from 2004 to the present. The primary
method I used for data collection was an online survey managed through the Qualtrics software
and University of North Carolina (UNC) at Chapel Hill Odum Institute (Qualtrics Labs Inc.,
2009). In spring 2011, prior to building the survey tool, I obtained training in survey
methodology and the Qualtrics software system through the Odum Institute as a component of a
graduate level public health course in program assessment. Training on the Qualtrics software
system was completed during an eight hour course which included a brief overview of: survey
sampling, survey computing and data analysis, questionnaire design, data collection methods,
individual password protected account in Qualtrics. All statistics were derived using standard
descriptive methods as described in Gerstman (2008) which are produced directly by the
Qualtrics software system or by the Microsoft Excel software.
IRB Review
Prior to commencing data collection, the UNC-Chapel Hill Institutional Review Board
reviewed the study methodology which included a review of the survey tool and a recruitment
email. The Institutional Review Board (IRB) is a committee established to review and approve
research involving human subjects, in order to protect the rights and welfare of the human
subjects. Because this research involved surveying human subjects, i.e., the Planning Council
Members, IRB approval was sought. On October 5, 2011 the initial application for IRB
approval was submitted by me, as primary investigator, and on October 10, 2011 IRB approval
was given. The formal IRB status was “exempt” but included mandated consent language to be
part of the contact information sent to survey participants. Data collection processes began the
following day, October 11, 2011.
The survey tool and IRB application were reviewed by faculty members at UNC-Chapel
Hill and stakeholders at the Cabarrus Health Alliance in Kannapolis before they were submitted
for approval. UNC-Chapel Hill faculty reviewed the survey tool and suggested grammatical
changes which improved the readability and response rate. Cabarrus Health Alliance staff
members reviewed the survey tool to assure that practical questions were being asked verifying
that the results would be usable and lead to an increase in knowledge among the Cabarrus
County Planning Council. Cabarrus County Planning Council members represent a variety of
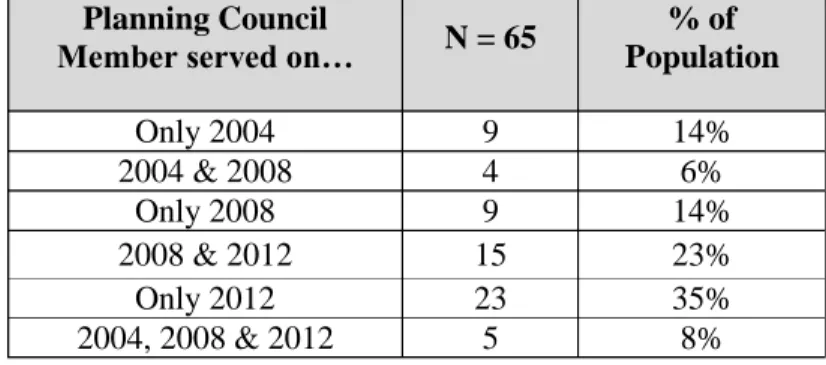
Table 1 - Population of Potential Survey Respondents
Planning Council
Member served on… N = 65
% of Population
Only 2004 9 14%
2004 & 2008 4 6%
Only 2008 9 14%
2008 & 2012 15 23%
Only 2012 23 35%
2004, 2008 & 2012 5 8%
the county. Industries represented include, health care, government, education, nonprofits,
transportation, the faith community and more. Gaining insight from current and past council
members is the first step in improving accessibility and utilization. Council members are more
likely than other community stakeholders to use the completed needs assessment because they
participated in the data gathering, narration and distribution of the document. It is logical to
assume that if council members are not accessing the document or utilizing the data other
community stakeholders, who were not council members, are not using it either. Therefore, an
important first step in evaluating the effective use of a CNA is to analyze the utilization of
Council members.
Recruitment of Survey Population
The first step in data collection after the research methodology was approved by the IRB,
was to send a recruitment email, which can be reviewed in its entirety in Appendix A, to
Cabarrus County Planning Council members from the 2004, 2008, and 2012 assessment periods.
A total of 65 prospective participants were contacted. Table 1 details the distribution of
prospective participants according to the respective year/s they were an active Cabarrus County
Planning Council Member. The target
population included members who
served only in 2004 (N=9), and some
that served in all three periods (N=5).
The largest component of the targeted
population were those who are
Each potential participant was emailed a letter describing the survey, the purpose of the
research which included consent language mandated by the IRB. In addition to this letter, a link
to an online survey was embedded. One week following the initial recruitment email a reminder
email was sent, encouraging prospective participants who had not yet completed the survey, to
do so. One final reminder was sent thirteen days after the first email was sent, repeating the
reminder and encouraging a response. The reminder emails were not automatically generated by
the Qualtrics software. The reminder emails were instead sent to the entire list of 65 prospective
participants, using the blind carbon copy (bcc) email function. This function hides recipient’s
emails from one another. Sending this reminder email to all prospective participants maintained
confidentiality among those who had already completed the survey, those who had chosen to opt
out and those who still wished to take the survey but had simply forgot between the reminder
email and the original recruitment email. All communication between me and the prospective
participants ceased following the closing of the survey instrument on October 28, 2011.
Survey Instrument
The online survey contained 25 questions, sixteen questions were quantitative, and nine
questions were qualitative. After data collection ended, the qualitative answered were reviewed
and coded into discrete categories to facilitate summarization. On average respondents reported
that they took nine minutes to complete the survey.
A copy of the survey tool completed by participants can be reviewed in its entirety in
Appendix B. The questions asked in the survey included questions about how often and for
survey instrument also included questions pertaining to the likelihood of using the 2012 Needs
Assessment and questions related to how likely they are to recommend this survey to other
professionals in the county. Questions also related to the reliability and accessibility of the 2004
and 2008 Community Needs Assessment documents. As noted in Table 1, 23 Council members
have never served prior to the 2012 process. Although this may affect the utilization rate of the
2004 and 2008 documents, it was expected that because the Council process began in June 2011
and the survey was disseminated in October of 2011, new council members had had the
opportunity to access the 2004 and 2008 documents during those four month, so utilization
rates could be measured.
Recommendations derived from the answers provided by respondents will allow
Cabarrus County stakeholders, including the current 2012 Planning Council and Cabarrus
Health Alliance, to make adjustments and improvements to the way the Community Needs
Assessment is publicized, distributed and utilized in the county in order to make a larger impact
in the county.
Cabarrus Health Alliance has facilitated the community needs assessment process in the
county for over 14 years. Because of this, a comprehensive list of Community Planning Council
members was easily attainable. After the comprehensive list was obtained, contact information
was updated where needed and when it was possible to locate new contact information. Emails
were the only contact information collected and used to contact prospective participants. If an
email was not obtained, the prospective participant was removed from the population list. Sixty
five prospective participants were contacted with the recruitment email and 38 responded to the
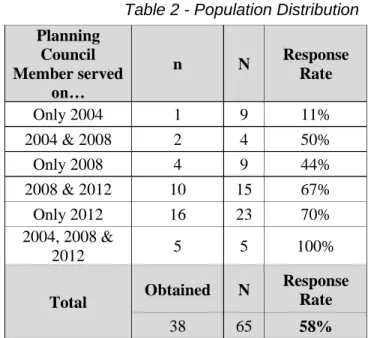
Table 2 - Population Distribution
Planning Council Member served
on…
n N Response
Rate
Only 2004 1 9 11%
2004 & 2008 2 4 50%
Only 2008 4 9 44%
2008 & 2012 10 15 67%
Only 2012 16 23 70%
2004, 2008 &
2012 5 5 100%
Total Obtained N
Response Rate
38 65 58%
Table 3 - Percentage Distributions Planning Council Member served on… % of Respondents n=38
% of Potential Respondents
N=65
Only 2004 3% 14%
2004 & 2008 5% 6%
Only 2008 11% 14%
2008 & 2012 26% 23%
Only 2012 42% 35%
2004, 2008 &
2012 13% 8%
Results - Survey Findings
The following section and Appendix
B present the distribution of survey
respondents and describe how survey
participants responded to the survey and an
analysis of the implications that the answers
potentially create. The insights chronicled
here are distilled from 38 respondents who
completed the survey between October 11th
and October 28th, 2011. This research had a
relatively good response rate of 58 percent.
Tables 2 and 3 compare the distribution of
the responders to the total population. These
summaries indicate that the distribution of
respondents is similar to the overall
population, although those who served
“Only in 2004” are somewhat underrepresented; only 1 (11 %) of that subgroup (N=9) responded
to the survey and the more recent members are overrepresented to some degree. Therefore these
results may have some bias in favor of the more recent members of the Council.
The survey respondents represented a variety of industries as seen in Table 4, but
primarily self indentified as being a professional in the healthcare, 26 percent and government
Table 4- Self Reported Industry Representation
Healthcare/ Public Health
Nonprofit Gov’t Education/
Transit Business Other
10 4 9 5 3 5
26% 11% 24% 13% 8% 13%
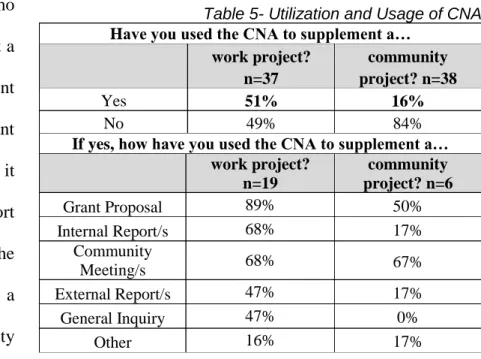
Table 5- Utilization and Usage of CNA Have you used the CNA to supplement a…
work project? n=37
community project? n=38
Yes 51% 16%
No 49% 84%
If yes, how have you used the CNA to supplement a… work project?
n=19
community project? n=6
Grant Proposal 89% 50%
Internal Report/s 68% 17%
Community
Meeting/s 68% 67%
External Report/s 47% 17%
General Inquiry 47% 0%
Other 16% 17%
As illustrated in Table 5, thirty seven respondents answered a question relating to their
past use of the community need assessment (CNA); 51 percent had used the CNA to supplement
a work related project and only 16 percent (6 people) had used the CNA to supplement a
community related project unrelated to their professional position. Table 5 also illustrates the
types of projects/ or assignments that respondents had used a CNA for.
Of the 19 respondents who
had used the CNA to supplement a
work related project, 89 percent
had used it to supplement a grant
application, 68 percent had used it
to supplement an internal report
and/or community meeting. Of the
16 percent (n=6) that had used a
CNA to supplement a community
project 50 percent (n=3) used it for a grant proposal but the majority (67 percent, n=4) used it for
community meetings.
Fifty percent (n=19) of respondents indicated that they have used the CNA to supplement
Table 6- How Many Times was the CNA utilized?
How many times have you utilized the (2004 and 2008) CNA as part of your career?
2004 n=38
2008
n=38
None 59% 39%
1-2 times 19% 5%
3-7 times 16% 26%
8-10 times 5% 13%
More than 10 times 3% 16%
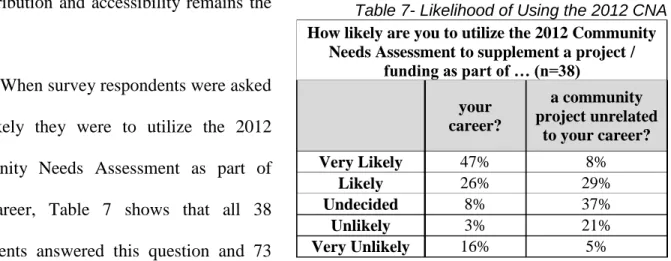
Table 7- Likelihood of Using the 2012 CNA How likely are you to utilize the 2012 Community
Needs Assessment to supplement a project / funding as part of … (n=38)
your career?
a community project unrelated
to your career?
Very Likely 47% 8%
Likely 26% 29%
Undecided 8% 37%
Unlikely 3% 21%
Very Unlikely 16% 5%
used the CNA to supplement a work related project had used the 2008 CNA and only 55 percent
had indicated using the 2004 CNA (see
Appendix B question 4). As presented
in Table 6, the survey asked
respondents to recall how many times
they had utilized the 2004 and 2008
CNA as part of their career, 59 percent
(n=22) and 39 percent (n=15) respectively, answered “none” indicating that they had never once
accessed the 2004 and/or 2008 CNA to supplement a funding proposal, or policy implementation
project, etc. Twenty six percent (n=10) selected “3-7 times” and five percent (n= 2) selected “1-2
times”. This may indicate a low likelihood of future council members of using the new CNA, if
the distribution and accessibility remains the
same.
When survey respondents were asked
how likely they were to utilize the 2012
Community Needs Assessment as part of
their career, Table 7 shows that all 38
respondents answered this question and 73
percent indicated a “likely” or “very likely” response. When asked if they were “likely to utilize
the 2012 Community Needs Assessment as part of a community project?” only 37 percent had a
Figure 3- Options to Increase Usability While it is beneficial to measure the respondent’s likelihood to utilize the CNA, it may be
even more beneficial to Cabarrus County to identify what actions would increase the likelihood
of respondents to access and use the CNA. Figure 3 illustrates the results from the question that
asked survey respondents
to mark which options (of
those given) they believed
would increase their
personal utilization of the
CNA. Seventy two
percent felt that having
the CNA accessible in
digital format (online)
would increase their likelihood of using the CNA. In addition, 67 percent of respondents would
like to have one online location more multiple years of the CNA and 39 percent would like to
have statistics accessible digitally. This question intended to gather information on how Council
members would prefer to use the secondary data collected and whether they preferred the data to
be downloadable in Excel format.
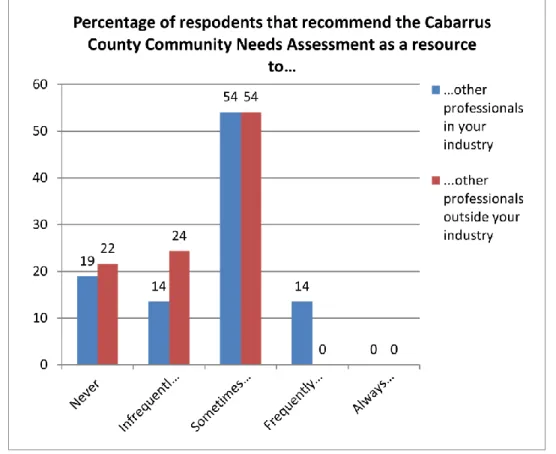
Figure 4 presents results from 37 council members who responded to both parts of a two
part question (see Appendix B, question 12) on patterns of recommendation of the CNA. It
compares how often respondents recommended the CNA to professionals “in their industry” vs.
professionals “outside of their industry”. Nineteen percent of respondents had “never”
Figure 4- Professional Recommendations
“never” recommended the CNA to professionals “outside of their industry”. Fifty four percent of
respondents recommended the CNA “sometimes – i.e. a few times a year” to both professionals
“in their industry” and “outside their industry”. None indicated that they always recommended
the CNA as a resource to others.
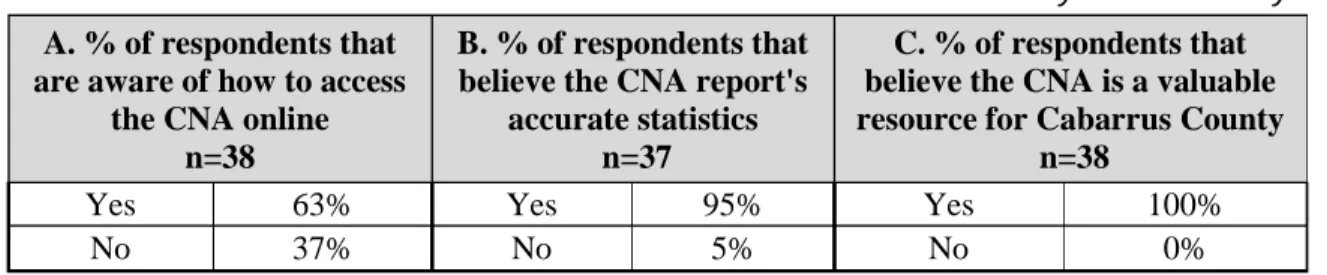
Table 8 presents the results of three questions in the survey. Thirty seven percent of
respondents were not aware of how to access the CNA online. Almost all (95 percent) all
respondents believed that the CNA reported accurate statistics and 100 percent of all respondents
Table 8 - Accessibility and Reliability
A. % of respondents that are aware of how to access
the CNA online n=38
B. % of respondents that believe the CNA report's
accurate statistics n=37
C. % of respondents that believe the CNA is a valuable resource for Cabarrus County
n=38
Yes 63% Yes 95% Yes 100%
No 37% No 5% No 0%
Table 9 - Options to Increase Utilization Among Cabarrus County Residents
Answer Mean
Ranking
Informational presentations at the
large employers in the county 2.96 A social media site (e.g. Facebook,
MySpace, etc.) 3.30
Informational presentations at back
to school nights or open houses 3.74 A newspaper announcement 4.13
A public service announcement on
local radio or television 4.35 Informational brochures in both
Spanish and English 5.13 Low literacy informational
brochures 5.78
Informational presentations at the
Cabarrus County Fair 6.61 The final question in the survey, asked respondents to rank in order from one through
eight (1 = most likely; 8 = least likely) which options they felt would increase the likelihood of
Cabarrus County residents viewing the Cabarrus Community Needs Assessment? There were 23
respondents who answered this question completely, ranking all eight options. There were 14
respondents with partial completion and
were excluded from the analysis presented
in Table 9. Appendix B, question 17A
includes the data from all 38 respondents
(23 complete responses and 14 partial
responses). Question 17B includes only the
data from the complete responses (n=23).
In order to analyze this question, I used the
Rank function in Excel (2010), which
calculates the weighted rank and the
calculations are shown in Table 9 which
illustrates the results using the 23
illustrate the order in which respondents ranked the options. Using mean ranking to sort options,
the option which respondents felt would have the best chance (the one with the lowest mean
score) to increase the likelihood that Cabarrus County residents would view the CNA was
“informational presentations at the large employers in the county” with a mean ranking of 2.96;
second with a mean ranking of 3.3 was “a social media site”. The least likely option, with the
highest mean ranking (6.61), was “informational presentations at the Cabarrus County Fair”. In
addition to ranking the options given, respondents were asked to write-in other options that they
felt would increase the likelihood the residents would use the CNA. Written in responses (n=20)
included: highlights on channel 22 (a local channel), continuing the civic meetings at clubs,
advertisements or notices in other community brochures (churches, arts events, concerts, races),
a one-page compilation in bus shelters, having business executives endorse the CNA and suggest
employees read the executive summary, references to online sources and social media pages in
print versions of executive summaries.
Research Limitations
The results of this research depict one county and the members directly associated with
working on the completion of the assessment, the Planning Council. The response rate (58
percent) is moderately high and seems to compare well with the target population proportions
relative to an important characteristic, number of years on the planning council – although the
respondents exhibits some bias toward more recent years. Thus although this may be a good
representation of Cabarrus County Planning Council members, especially those who served most
recently, it does not necessarily imply that this is a representative sample for the state and other
compared to a “County Health Assessment”. This also means that a large variety of represented
industries sit on the planning council, thus the results may reflect that varied representation and
may not be generalizable to other counties. Furthermore the composition of the council may
affect the utilization rates. For example, the utilization in other counties might be higher,
because only healthcare and public health entities would serve on the planning council and thus
increase the utilization. This could not be determined in this research, but may be a question for
future research which includes comparisons to other counties that don’t have industry
representatives on their planning council.
In addition, in order to protect the confidentiality of individuals, the data is presented in
this report at the summary level, but was analyzed at both the individual and summary levels
available in Qualtrics (2005). Although it would be interesting to see the difference in utilization
rates among respondents by year served, e.g., only since 2008, in order to maintain anonymity
this was not done. If a larger sample was used, and stratifying the results, might not risk
revealing respondents, I would be able to test the hypothesis that the more recently a respondent
participated in the planning council, the more likely they are to utilize the CNA.
The survey responses were primarily ordinal, quantitative and categorical variables,
which limits the responses and possible analysis. If more time and resources were available to
complete the evaluation, interviews may have been conducted in order to include a variety of
qualitative, open ended questions. These qualitative questions might have lead to further insights
and the results may have presented recommendations that were not available using solely the
Discussion
The results of this research showed a 51 percent utilization rate (see Table 5 and
Appendix B, question 4) among respondents that had used the CNA to supplement a work
related project. Since no hypothesis was made prior to the research about what the expected
utilization rate would be, it is difficult to determine if this utilization meets some minimum
standard or whether it should be higher. To answer this question this utilization rate can only be
compared to future research that captures utilization rates among other counties. These additional
results will be useful to the 2012 Cabarrus County Planning Council. In addition there are other
factors that can be assumed to be related to increasing the utilization rate that were captured in
this study. Based on the analysis, I know with certainty that only 63 percent of respondents know
how to access the CNA online. All of the secondary data gathered for the CNA was found
through online sources. Based on the fact that 37 percent of respondents don’t know how to
access the CNA data, one can infer that the utilization rate (51 percent) would be higher if
accessibility had been higher. In addition, 60 percent of respondents have accessed the 2008
CNA at least once in the past four years and almost 30 percent have accessed it more than eight
times. This suggests that respondents may be utilizing a hard copy version in lieu of being unable
to access the CNA online. It also could indicate a low likelihood of future council members of
using the new CNA, if the distribution and accessibility remains status quo.
Although only 51 percent of respondents had used the CNA to supplement a work related
project, 73 percent of respondents indicated a “likely” or “very likely” response when asked how
likely they were “to utilize the 2012 Community Needs Assessment as part of a work related
planning council previous to the 2012 assessment period and the opportunity to access previous
CNAs had not been presented.
There was a high response rate among Council members who served during 2008 and
2012 (67 percent), only 2012 (70 percent) and a 100 percent response rate among Council
members who’ve served during three assessment periods (2004, 2008 and 2012). In comparison,
the response rate among Council members who only served on the 2004 was very low (11
percent). This response rate may infer a potential response bias. It is possible that this response
bias is positive as current members may be more engaged. But, because results were analyzed at
the summary level, there is a possibility that current members indicated a low utilization. Given
more time and with a larger population this could be explored further.
The respondents also indicated some very positive experiences including the responses
detailed in Appendix B questions 14 and 15. One hundred percent of respondents indicated that
they felt the CNA was a resource for Cabarrus County and 95 percent of respondents felt that the
CNA reported accurate statistics. I feel this validates, for both the state of North Carolina and
Cabarrus Health Alliance, that the resources being obligated for this activity are being viewed as
a positive and time worthy experience for the people involved in the process.
Finally, the success of this study shows that evaluating the key stakeholders, the planning
council, is useful, feasible and can serve as a model for other counties in North Carolina.
Recommendations and Conclusions
To obtain the maximum benefit from the CNA, including increasing its utilization, there
how to access the CNA online. In order to do this, Cabarrus Health Alliance may consider
including multiple years of the CNA in one location online place and have the statistics
downloadable in Excel format. The Health Alliance may also wish to include a web link to the
Healthy Carolinians website, where Planning Council members and county residents can access
and view the health assessments of every county in North Carolina which complete a health
assessment.
The second recommendation would be to increase the knowledge of healthcare, nonprofit
and government representatives about how the data included in the CNA and can be useful to
them. This recommendation stems from the fact 61 percent of respondents self reported being in
those industries, so concentrated efforts towards those industries may result in higher utilization
rates. This education or change in knowledge may be done by utilizing public service
announcements and press releases as well as internal memos.
Finally, the third recommendation would be to modify and improve the distribution
process. When distribution and publication begins, I recommend that Cabarrus Health Alliance
and the 2012 Planning Council, continue outreach as in the past, at community clubs and
churches, but consider creating a social media site (Facebook), look at the largest employers in
the area and complete presentations at staff meetings or get CEO to endorse and recommend the
documents, and finally publicize the CNA by presenting in fall at the local school’s back to
References
Centers for Disease Control and Prevention [CDC]. Assessment Initiative- Grantees by Funding
Cycle. Accessed on October 22, 2011 from http://www.cdc.gov/ai/funding/all.html.
Curtis, D. (2002). Evaluation of community health assessment in Kansas. Journal of Public
Health Management Practice, 8(4):20–25.
Dhara, R. (2002). Advancing public health through the assessment initiative. Journal of
Public Health Management Practice, 8(4), 1-8.
Friedman, D., Parrish, R. G. (2009). Is community health assessment worthwhile? Journal of
Public Health Management Practice, 15(1), 3-9.
Gerstman, B. B. (2008). Basic biostatistics: statistics for public health practice. Sudbury, MA:
Jones and Bartlett Publishers.
Health Carolinians. (2011). Community health assessment, what is a community health
assessment? Retrieved from http://www.healthycarolinians.org/assessment/guidebook.aspx
Healthy Cabarrus. (2007). Healthy Cabarrus – healthy partnerships for life. Retrieved from
http://www.cabarrushealth.org/healthycabarrusold/index.htm. Accessed on November 11, 2011.
Healthy Cabarrus. (2011). Healthy Cabarrus – healthy partnerships for life. Retrieved from
November 11, 2011.
Institute of Medicine. (1988). The Future of Public Health. Washington, DC: National
Academies Press. http://www.nap.edu/catalog.php?record id=1091. Accessed October 22, 2011.
Martin, Robert. (2009). Examining the impact of public health assessments. Journal of Public
Health Management Practice, 15(1)), 1-2.
Menkens, A. J., Stone, D., Wood, B. W., Reed, J. F. (2009). Local public health department
accreditation: thoughts from North Carolina. Journal of Public Health Management Practice, 15(5), 443-445.
National Association of County and City Health Officials. (2011). Programs and
activities: public health infrastructure and systems- accreditation preparation and quality improvement. Accessed on November 6, 2011 from
http://www.naccho.org/topics/infrastructure/accreditation/index.cfm
North Carolina State Center for Health Statistics [SCHS]. (2011) North Carolina community
health assessment initiative. Retrieved from http://www.epi.state.nc.us/SCHS/about/chai.html
North Carolina Public Health Task Force. (2005). Public health improvement plan- final report,
January 15, 2005. Retrieved from
http://publichealth.nc.gov/taskforce/docs/FinalReport1.15.05.pdf
initiatives in Minnesota. Journal of Public Health Management Practice, 8(4):33–37.
Qualtrics Labs, Inc. (2009). Qualtrics Research Survey Suite (Version 2009) [Computer
Software]. Provo, UT. Retrieved September 1, 2011. Available from http://www.qualtrics.com/.
Spice, C., Snyder, K. (2009). Reviewing self-reported impacts of community health assessment
in local health jurisdictions. Journal of Public Health Management Practice, 15(1):18–23.
Stafford-Alewine, S., Land, G. (2002). The Missouri experience in providing tools and resources
to promote community assessment. Journal of Public Health Management Practice, 8(4):14–19.
Stoto MA, Straus SG, Bohn C, Irani P. (2009). A Web-based tool for assessing and improving
the usefulness of community health assessments. Journal of Public Health Management Practice, 15(1):10–17.
United States Department of Health and Human Services: Administration for Children and
Appendix A
Recruitment EmailUtilization of the Cabarrus County Needs Assessment
Subject Line: Research Study for the Cabarrus County Planning Council
Dear __________:
You have been identified as a potential participant in a research study that is being conducted in partial fulfillment of requirements for graduation from the Gillings School of Global Public Health; Masters in Public Health Degree program at the University of North Carolina (UNC) at Chapel Hill. The goal of this research is to assist Cabarrus County and Cabarrus Health Alliance to better understand the utilization of the Community Needs Assessment conducted every four years.
Taking part in this research is completely voluntary. If you volunteer to be in this study, you may withdraw at anytime. You do not have to answer any questions you do not want to answer. The research will be conducted through an online survey that will take approximately 15 minutes to complete.
Please follow this link to the survey (insert link here).
If you have any questions or concerns about this research project, please feel free to contact me any time at (831) 917-0915, or by email at [email protected]. You may also feel free to contact the Faculty Advisor for this project, Dr. William Sollecito, by email at [email protected].
Sincerely,
Meghan Lewis, Principal Investigator Public Health Leadership
Gillings School of Global Public Health University of North Carolina at Chapel Hill (831) 917-0915
Appendix B
Aggregated ResultsUtilization of the Cabarrus County Needs Assessment
1. Have you served on any of the Cabarrus County Planning Council, during the development of the Community Needs Assessment?
38 -Yes
0 - No
2. Which Planning Council/s have you served on for Cabarrus County? (select all that apply)
8 - 2004 Community Needs Assessment
21 - 2008 Community Needs Assessment
31 - 2012 Community Needs Assessment
0 - Do not wish to respond
3. What industry were you employed in while serving on the Planning Council?
Healthcare/ Public Health
Nonprofit Government Education/
Transit Business Other
10 4 9 5 3 5
4. Have you used a Community Needs Assessment to supplement a work related project / funding application / policy adoption / etc?
19 -Yes
18 -No
1– No Response
If yes, which Community Needs Assessment did you use as part of your work related project?
(Check all that apply)
3- 2000
11 - 2004
0 - Other
Note: The one respondent who had “no response” on the first portion of this question was automatically directed (using the skip pattern embedded in the online survey tool) to answer the second portion, thus a response of 20 instead of 19 on the “2008” response.
5. What was the purpose of using the Community Needs Assessment for a work related project?
(Check all that apply)
17 - Grant Proposal
13 - Internal Reports
9 - External Reports
13 - Community Meetings
9 - General Inquiry
3 – Other
18 - Never Used the Community Needs Assessment for a work related project
6. Have you used a Community Needs Assessment to supplement a project / funding application / policy adoption / etc as part of a community project outside of work?
6 - Yes
32 – No
If yes, which Community Needs Assessment did you use as part of a community project unrelated to your career? (Check all that apply)
0 - 2000
1 - 2004
6 - 2008
0 - Other _________
7. What was the purpose of using the Community Needs Assessment for a community project outside of work? (Check all that apply)
3 - Grant Proposal
1 - Internal Reports
1 - External Reports
4 - Community Meetings
0 - General Inquiry
1 - Other
8. How many times have you utilized the 2004 Community Needs Assessment as part of your career?
22 - None
7 - 1-2 times
6 - 3-7 times
2 - 7-10 times
1 - More than 10 times
9. How many times have you utilized the 2008 Community Needs Assessment as part of your career?
15 - None
2 - 1-2 times
10 - 3-7 times
5 - 7-10 times
6 - More than 10 times
10.How likely are you to utilize the 2012 Community Needs Assessment to supplement a project / funding application / policy adoption / etc…?
Very
Unlikely Unlikely Unsure Likely
Very Likely
as part of your career 6 1 3 10 18
as part of a community project
unrelated to your career 2 8 14 11 3
11.Which of these options (if any) would increase your likelihood of using the Cabarrus County Community Needs Assessment? (Check all that apply)
26 - Accessible digitally (online)
14 - Statistics available in Excel
24 - One online location for multiple years of the Community Needs Assessment
12.How often do you recommend the Cabarrus County Community Needs Assessment as a resource to…?
Never Infrequently (yearly)
Sometimes (a few times a
year)
Frequently (a few times a month)
Always (weekly)
…other professionals
in your industry 7 5 20 5 0
…other professionals
outside your industry 8 9 20 0 0
13.Are you aware of how to access the Community Needs Assessment Online? (As presented in Table 8)
24 - Yes
14 – No
14. Do you believe the Community Needs Assessment report's accurate statistics? (As presented in Table 8)
35 - Yes
2 – No
15. Do you believe the Community Needs Assessment is a valuable resource for Cabarrus County?
(As presented in Table 8)
38 - Yes
0 – No
16. What other industries or organizations (if any) should be represented on the Community Planning Council?
17. In order from 1 - 8, please rank which options would increase the likelihood of Cabarrus County residents viewing the Cabarrus Community Needs Assessment? (1 = most likely through 8 = least likely)Each option below gets only one ranking. For example: if you believe that "a newspaper announcement" would be the "most likely" option in increasing the likelihood that a Cabarrus County resident would view the CNA, you would put a mark in the 1 column in that row.
A. All responses (including partial responses)
Answer 1 2 3 4 5 6 7 8
Response s n A social media site (e.g. Facebook,
MySpace, etc.) 12 3 7 4 3 2 2 2 35
A public service announcement on local
radio or television 3 4 8 3 3 3 5 1 30
A newspaper announcement 3 4 4 5 4 3 3 3 29
Informational presentations at the
Cabarrus County Fair 0 2 0 1 4 3 6 13 29
Informational presentations at back to
school nights or open houses 3 6 4 7 2 5 2 0 29
Informational presentations at the large
employers in the county 8 9 5 6 5 1 1 1 36
Low literacy informational brochures 2 1 3 3 4 8 6 7 34 Informational brochures in both Spanish
and English 2 5 3 5 7 6 5 4 37
B. Complete responses (excluding partial responses)
Answer 1 2 3 4 5 6 7 8
Responses n A social media site (e.g. Facebook,
MySpace, etc.) 8 2 4 2 3 1 1 2 23
A public service announcement on local
radio or television 3 2 6 1 2 3 5 1 23
A newspaper announcement 2 4 4 4 3 2 2 2 23
Informational presentations at the
Cabarrus County Fair 0 2 0 1 2 2 6 10 23
Informational presentations at back to
school nights or open houses 3 4 3 6 2 3 2 0 23
Informational presentations at the large
employers in the county 5 6 3 4 4 1 0 0 23
Low literacy informational brochures 1 1 1 2 3 6 4 5 23 Informational brochures in both Spanish
and English 1 2 2 3 4 5 3 3 23
Total 23 23 23 23 23 23 23 23 184
18.What other options in addition to those listed above would increase the likelihood of community residents viewing the Cabarrus County Needs assessment?
n=20 Comments Included: Highlights on Channel 22 (a local channel), continuing the civic meetings at clubs, advertisements or notices in other community brochures
(churches, arts events, concerts, races), a one-page compilation in bus shelters, have business executives endorse the CNA and suggest employees read the executive summary, references to online sources and social media pages in print versions of executive summaries.
19.If you have any other comments or suggestions about how to make most efficient use of the Cabarrus County Needs Assessment please write them here?