ABSTRACT
ELIZABETH A. JAY. Effect of Snails (Elimia clavaeformis) on
Phosphorus Cycling in Stream Periphyton and Leaf Detritus
Communities (Under the Directions of Dr. DONALD E. FRANCISCO
and Dr. PATRICK J. MULHOLLAND)
In this study, I examined the effect of grazing on
phosphorus cycling in stream periphyton and leaf detritus
communities using the snail Elimia clavaeformis. Phosphorus
cycling fluxes and turnover rates were measured in alaboratory and in a natural stream, respectively, using
radioactive tracer techniques.Snails increased phosphorus fluxes and turnover rates
from the communities. However, this effect was only
significant for turnover rates from detritus, perhaps
because higher fecal production rates occurred when snails
grazed on detritus compared with periphyton. When thephosphorus concentration in water was increased in algal
studies, cycling fluxes were not significantly affected when
snails were present, but were significantly reduced when
snails were absent.
My results indicate that although snails may not strongly affect phosphorus cycling, snails can enhance
phosphorus turnover from certain substrates such as leaf
detritus. In addition, the effect of snails on phosphorus
cycling from leaf detritus depends on the fate of the large
flux of phosphorus into fecal matter. Because the
experimental design of my studies involved substrates
commonly grazed by snails, I have been able to observe how
#
TABLE OF CONTENTS
SECTION PAGE
LIST OF FIGURES i
ACKNOWLEDGEMENTS iii
INTRODUCTION 1
LITERATURE REVIEW 4
1. Bacteria and algae 5
2. Consumers 7
2.1. Alteration of bacterial and algal
uptake rates by consumers 8 2.1.1. Effects on biomass 8 2.1.2. Effects on metabolic rates 8 2.1.3. Effects on species
composition 9 2.2. Storage / Retention 10
2.3. Regeneration 10 2.4. Feces 12
2.5. Snails 12 2.6. Food chain effects (predators) 13 3. Research objectives 13 METHODS 15
1. General Approach 15 2. Description of research areas 17
2.1. Field site 17
2.2. Laboratory 18
3. Focus and hypothesis of each experiment 19
3.1. Experiment 1 19 3.2. Experiment 2 19 3.3. Experiment 3 20 3.4. Experiment 4 20
4. Specific experimental methods 20
4.1. Experiment 1 20
4.1.1. Preparation of substrate
before labelling 20
4.1.2. '^P labelling and uptake 21
4.1.3. Phosphorus cycling fluxes 22 4.1.4. TP and ^^P analysis ofperiphyton, snail, and
4.2. Experiment 2 26 4.2.1. Preparation of substrate
before labelling 26
4.2.2. ^^P labelling and uptake 26
4.2.3. Phosphorus turnover 28
4.3. Experiment 3 29 4.3.1. Preparation of substrate
before labelling 29
4.3.2. ^^P labelling and uptake 29
4.3.3. Phosphorus cycling fluxes 31 4.4. Experiment 4 32
4.4.1. Preparation of substrate
before labelling 32
4.4.2. ^^P labelling and uptake 32
4.4.3. Phosphorus turnover 32 4.5. Statistical Analysis 33
RESULTS 34
1. Experiments 1 and 3 34
1.1. Phosphorus uptake 34
1.2. Phosphorus regeneration 34
1.3. Phosphorus incorporation into snail
biomass and feces production 39
1.4. Phosphorus content of substrate,
snail, and feces 42
2. Experiments 2 and 4 46
2.1. Phosphorus turnover 46
DISCUSSION 50
1. Effect of snails on phosphorus cycling
fluxes and turnover 50
2. Effect of substrate type on P cycling
fluxes 53
3. Effect of streamwater P content on P
cycling fluxes 56 4. Grazing treatments during the P turnover
studies 57
5. Future research 58
CONCLUSIONS AND RECOMMENDATIONS 59
LITERATURE CITED 61
APPENDIX A: TABLES USED TO CREATE FIGURES 66
'ͣ
T'5«r:"jJ5''-LIST OF FIGURES
FIGURE FIGURE PAGE NUMBER TITLE
1 NUTRIENT CYCLING IN AQUATIC SYSTEMS 2
2 PHOSPHORUS FLUXES IN THE PRESENCE AND 16 ABSENCE OF SNAILS IN PERIPHYTON AND
LEAF DETRITUS ^'p LABELLED COMMUNITIES
3 PROCEDURES FOR TOTAL PHOSPHORUS AND ^^P 25
ANALYSIS OF SAMPLES IN EXPERIMENT 1
4 FIELD DESIGN OF EXPERIMENT 2 27
5 MICROBIAL COLONIZATION OF LEAF STRIPS IN 30 WALKER BRANCH FOR EXPERIMENT 3
6 EFFECT OF STREAMWATER PHOSPHATE 35
CONCENTRATION ON PHOSPHORUS UPTAKE AND REGENERATION TO WATER IN PERIPHYTON
COMMUNITIES
7 EFFECT OF SUBSTRATE TYPE (PERIPHYTON, 36
DETRITUS) ON PHOSPHORUS UPTAKE AND
REGENERATION TO WATER
8 EFFECT OF SNAILS ON P REGENERATION TO 38
WATER FROM PERIPHYTON AND DETRITUS
COMMUNITIES
9 EFFECT OF STREAMWATER PHOSPHATE 40
CONCENTRATION ON PHOSPHORUS
INCORPORATION INTO SNAIL BIOMASS AND
FECES PRODUCTION IN PERIPHYTON
COMMUNITIES
10 EFFECT OF SUBSTRATE TYPE (PERIPHYTON, 41
DETRITUS) ON PHOSPHORUS INCORPORATION INTO SNAIL BIOMASS AND FECES PRODUCTION
11 EFFECT OF SNAILS ON PHOSPHORUS FLUXES 43
(MEAN ± STD DEV) DURING PERIPHYTON
EXPERIMENT
12 EFFECT OF SNAILS ON PHOSPHORUS FLUXES 44 (MEAN ± STD DEV) DURING LEAF DETRITUS
EXPERIMENT
13 EFFECT OF SUBSTRATE TYPE (PERIPHYTON, 45
11
14 AVERAGE GRAZING RATE VERSUS TIME BY 47
TREATMENT IN PERIPHYTON EXPERIMENT
15 AVERAGE GRAZING RATE VERSUS TIME BY 47
TREATMENT IN LEAF DETRITUS EXPERIMENT
16 EFFECT OF SNAILS ON PHOSPHORUS TURNOVER 49
Ill
ACKNOWLEDGMENTS
It is necessary to thank many people for helping me
complete this technical report and keep my sanity
simultaneously. Without their assistance, this production
would have required several more episodes of frustration and
anxiety!
I am grateful for the aide of several personnel
affiliated with the Environmental Science Division of ORNL.
As a scientific advisor, Pat Mulholland helped plan,
prepare, and perform experiments as well as presented
suggestions regarding data analysis and report editing.
Tony Palumbo also served on my committee, and offered advice
concerning this report and computer problems. Al Steinman,
Ramie Wilkerson and Bonnie Lu gave technical assistance
during various phases of the research. Erich Marzolf
answered many computer questions and helped prepare
overheads for presentations of the experiments. Gloria
Lomax located several important journal articles. Finally,
Kathy Ketner made paperwork involved in conducting research
at a location far away from school much easier to handle.
I wish to thank many people involved with my graduate
program at UNC-Chapel Hill for their aide, too. Don
Francisco, my academic advisor, offered advice ranging from
the best classes to take, to interesting areas of research
to pursue, to possible alterations to make on this report;
he also offered much encouragement and assistance with the
'^'^^^^^"^^p^P^^^^'^r
iv
committee member, helped improve this report. C. L.
Lassiter and Carol Garden answered several questions and
provided correct forms concerning the "important stuff"
(registration, grades, graduation, etc.)* Various teachers
gave helpful suggestions in times of confusion. Finally,
fellow classmates made the adjustment to school and life in
North Carolina easier than expected.
I am grateful for the relationships I have had with
families and friends over the years, also. My parents have
almost always been supportive of my goals, and have enabled
me to pursue these goals via school and various experiences;
they also fostered the drive for success that I now possess.
The Carnell family has always made me feel like one of their
family. Cindy Tsai has been a good listener during good and
bad times. Dobie Gnash has consistently greeted me with
wantith, sweetness, and a tail wag. Finally, to Bill
Kountis, to whom this work is dedicated, I can not express
my appreciation: he has been extremely supportive of my
work, has made me smell, and let me share, life's roses, and
has soothed me through many times of moodiness, tears and
tension.
This technical report is based on work performed in the
laboratory graduate participation program under contract
number DE-AC05-76OR00033 between the United StatesINTRODUCTION
Nutrient cycling in aquatic systems is of interest because, together with nutrient inputs, it determines the
supply of nutrients to organisms and hence the productivity
of nutrient limited ecosystems. In addition, the form andamount of a nutrient available to producers and consumers is
determined by how rapidly nutrients cycle as well as byexternal inputs. Finally, the transport of a nutrient is
controlled by nutrient cycling in flowing water ecosystemsalong with other characteristics of those systems, e.g. flow
rate and biota present.
Nutrient cycling is the uptake, assimilation, trophic
transfer, regeneration, loss, and reuptake of a nutrient by
organisms in an ecosystem (Figure 1). Nutrients areinitially taken up in inorganic form by plants and microbes.
Nutrients are assimilated and transferred through the
trophic web as animals consume plants, microbes, or other animals. Nutrients are regenerated by organisms via
excretion, because the supply of nutrients in food exceeds
nutrient demand, because of unavoidable loss resulting from
cell metabolic processes, or as result of inefficientfeeding. Nutrients are regenerated when plants, microbes,
and animals die and cells lyse or decompose, too.
FIGURE 1. NUTRIENT CYCLING IN AQUATIC SYSTEMS
INORGANIC NUTRIENT
POOL
PRIMARY
PRODUCERS, ETC. ALGAE. FUNGI.
BACTERIA
ORGANIC NUTRIENT POOLS
SECONDARY CONSUMERS PREDATORS PRIMARY
CONSUMERS
HERBIVORES. DETRITIVORES
NUTRIENT CYCLING PROCESSES: (1) NUTRIENT UPTAKE
(2) ASSIMILATION OF NUTRIENT (3) TROPHIC TRANSFER OF NUTRIENT
feces.
Nutrient cycling is often quantified by measuring
nutrient regeneration and/or turnover rates. Nutrient regeneration is the release of a nutrient in dissolved inorganic form from an organic pool. Nutrient turnover is the loss rate of a nutrient from an organic pool or sum of pools relative to storage of a nutrient in that pool or
LITERATURE REVIEW
Although many nutrients are important in freshwater
ecosystems, phosphorus has been shown to be the limiting nutrient in several freshwater streams throughout the world
(Jurgens and Gude 1990, Elwood et al. 1981). In other
words, phosphorus has been shown to be the nutrient in
lowest supply relative to its demand by biota in many
freshwater systems. Therefore, the focus of my study is
phosphorus.
Studies of phosphorus cycling in aquatic systems have
involved a variety of plant and microbial coiwnunities and
their consumers. Macrophytes, algae and microbes which live
attached to underwater surfaces have been studied. In
addition, primary consumers, such as grazers which feed upon the plant and microbial communities mentioned above, as well
as secondary consumers (predators) have been studied. Consumers commonly used in studies of nutrient cycling
include protozoans, zooplankton, aquatic insects, snails, and fish. The role of consumer organisms in the phosphorus
cycle involves feeding and assimilation of organic forms of
phosphorus (trophic transfer) and regeneration of inorganic
1. Bacteria and algae
The role of bacteria and algae in phosphorus cycling in
aquatic systems is twofold: bacteria and algae take up and
compete for phosphorus in inorganic dissolved form (Johannes
1968, Bloem et al. 1988), and bacteria and algae release
nutrients to the water in dissolved organic and inorganic
forms (Barsdate et al. 1974, Taylor 1982). For algae,
uptake is generally much more important than regeneration
(Pomeroy 1970). However, the importance of regeneration
versus uptake activities of bacteria depends on the relative
availability of organic carbon and inorganic phosphorus in a
system as well as the phosphorus requirement of the
bacteria. Therefore, this theory leads to the conclusion
that if a water body has a low available concentration of
inorganic phosphorus, sufficient available organic carbon,
and contains bacteria which have a high phosphorus
requirement, uptake and retention of phosphorus by the
bacteria will dominate over regeneration of phosphorus by
the bacteria.
The size of an algal or bacterial cell can also affect
phosphorus regeneration. Because larger planktonic bacteria
may have higher phosphorus to carbon ratios than smaller
planktonic bacteria, more phosphorus may be retained in the
bodies of larger planktonic bacteria than smaller planktonic
bacteria (Jurgens and Gude 1990). However, in general,
bacteria and algae act more as agents for uptake of
regeneration (Berman et al. 1987, Bloem et al. 1989).
Although algae and bacteria have similar roles, therole of bacteria is more complex because, unlike algae, they
can use dead organic matter (detritus) as a source ofphosphorus. If the detritus contains enough phosphorus, additional inorganic phosphorus from the water may not be
needed to satisfy the phosphorus demanded by microbes
growing on it. However, often the phosphorus content of detritus is lower (higher carbon to phosphorus ratio) than that needed by attached microbes and the phosphorusdeficiency must be overcome by uptake from the water. This
situation is particularly true for leaves from deciduous
terrestrial vegetation that fall into aquatic systems,
especially streams. Most of the phosphorus originallypresent in the leaf is leached rapidly after the leaf has
fallen into the water (Webster and Benfield 1986). As the
aquatic microbes colonize the leaf surface and utilize theorganic carbon within the leaf, they must take up phosphorus
from the water, and in doing so, they increase the
phosphorus content of the detritus (dead leaf-microbe
complex) as a whole (Mulholland et al. 1984). In this way, bacteria improve leaf detritus as a food source for higher
consumers. Thus, the higher consumers (detritivores), not
the bacteria themselves, are responsible for the
7 Nevertheless, it has also been shown that bacteria in the
presence of detritivores can regenerate considerable amounts
of phosphorus from detritus (Barsdate et al. 1974).
However, it is important to keep in mind that the nutrient
content of the leaf relative to that in bacteria, as well as
the effectiveness of bacteria in forming bacterial matter
from dead leaf matter, determines whether bacteria attached
to leaf detritus will regenerate phosphorus (Jurgens and
Gude 1990).
2. Consumers
Consumer organisms also need phosphorus, but their
mechanisms for uptake and release are different from those
of bacteria and algae. Consumers cannot obtain phosphorus
from the water in inorganic dissolved form; they must
obtain phosphorus from the food they consume in particulate,
organic form (Taylor 1982). Consumers release phosphorus
back to the water in dissolved inorganic (regeneration) and
organic form, as well as in particulate form as feces
(Andersson et al. 1985, Andersen et al. 1986, Taylor 1982,
Taylor and Lean 1981). Consumers can influence phosphorus
cycling directly by assimilation of phosphorus and
indirectly by altering the rates of algal and bacterial
uptake. In this report, I will focus on two types of
primary consumers in stream ecosystems, grazers (consumers
that eat periphyton) and detritivores (consumers that eat
=^ "^^^^ -=<" W-'^^
8 2.1. Alteration of bacterial and algal uptake rates by
consumers
Consumers can modify the biomass, metabolic rates and species composition of bacterial and algal communities. Therefore, consumers can change the amount and/or time required by these communities to consume phosphorus.
2.1.1. Effects on biomass
Although most studies have shown that grazers cause reductions in biomass of bacteria and algae (Mulholland et al. 1983, Sumner and Mclntire 1982, Mulholland et al. 1991, Hill and Knight 1987, Lamberti and Resh 1983, Barsdate et
al. 1974), other studies have shown that grazers have no
significant effect or even a positive effect on biomass of
microbes and periphyton (Marks and Lowe 1989, Gallepp 1979).
The impact of grazing on biomass may change as nutrient
concentrations, grazer density and/or algal and bacterial
size change. For instance, Bergquist and Carpenter (1986) found that, especially for nutrient depleted algae, growth rates of algae < 30 um in size declined at higher
zooplankton biomass and increased at lower zooplankton biomass levels. Growth rates of algae > 30 um did not change or increased as grazer biomass increased.
2.1.2. Effects on metabolic rates
Although some studies report that total phosphorus
'yS«?^3H!^?'?»J~fr»'!8SS^Ef
-9
across all grazer densities due to reduction in bacterial and algal abundance (Lehman 1980a, Mulholland et al. 1985, Mulholland et al. 1983), the rate of phosphorus uptake per
bacterial or algal cell can remain high in the presence of
grazers (Mulholland et al. 1984). By consuming algal and
bacterial material, grazers can increase the metabolism of that material by preventing self-limiting population
densities (Mulholland et al. 1984, Barsdate et al. 1974). Decomposition of dead organic matter is also enhanced by
consumers because microbial metabolism is increased via
consumption and regeneration of available nutrients, and the
surface area of leaf detritus available for microbial activity is increased (by consumption) as well (McDiffett
and Jordan 1978).
2.1.3. Effects on species composition
Grazing can cause changes in phosphorus consumption by
bacterial and algal communities by causing shifts in species composition of the communities. Different species of algae and bacteria are known to have different uptake rates of phosphorus (Vanni and Findlay 1990). Therefore, grazers, by selecting certain species, can indirectly alter phosphorus
uptake (Cuker 1983b, Sumner and Mclntire 1982). This
selection by grazers is due to differences in edibility,
accessibility, and digestibility of various algae and
bacteria (Marks and Lowe 1989, Porter 1976). In many cases,
.^e?**5^""-^!^^^^~ ^-^E--—^»*.~;5=s^t^^
^----10 the highest growth rate (Taylor 1982). However, recently Rosemond et al. (in press) have shown that grazing can result in a shift toward slower growing algal species.
2.2. Storage/Retention
Consumers, especially those with relatively long life spans, may reduce fluctuations in the amount of phosphorus cycled in a system due to their capacity for phosphorus
storage in biomass (Kitchell et al. 1979, Taylor 1982). For
example, because storage of phosphorus can lessen downstream
transport, it can decrease the loss of phosphorus from a system (Merritt et al. 1984) . However, such storage can
also reduce phosphorus cycling rates by reducing
regeneration back to water (Berman et al. 1987). Thus,
nutrient accumulation in consumer biomass can have either a positive or negative effect on nutrient cycling within a
system.
2.3. Regeneration
Consumers stimulate phosphorus cycling because they are very important agents of phosphorus regeneration back to
water (Andersen et al. 1986, Bloem et al. 1989, Jurgens and
Gude 1990, Johannes 1968). However, as with bacteria, the
rate of phosphorus regeneration by consumers is dependent on
phosphorus and carbon availability in their food relative to their physiological needs for phosphorus (Bloem et al.11
sterner (1990) has argued for a ratio approach for
examining nutrient regeneration by aquatic consumers. This approach assumes that the nutrient which is in shortest
supply in the food relative to its need is regenerated by
the consumer at the lowest rate. In addition, because
different consumers have somewhat different chemical
compositions, they have different nutrient demands. Thus, nutrient regeneration can vary greatly for different types
of consumers even when the same food is utilized. For
example, Kairesalo and Koskimies (1987) found that
oligochaetes regenerated almost three times as much of their ingested phosphorus as did snails when both grazers fed upon
an epiphyte community.
The size of a consumer may also influence its
phosphorus regeneration rate. In general, because smaller consumers have higher rates of metabolism, they can have higher phosphorus regeneration rates per unit biomass than
larger consumers (Lehman 1980b, Vanni and Findlay 1990).
However, Taylor and Lean (1981) showed that microzooplankton did not release phosphorus faster than larger zooplankton. Several other studies have reported that larger aquatic insects have a greater effect on phosphorus regeneration
rates than smaller ones (Gardner et al. 1981, Taylor 1982).
Therefore, it is unclear if larger or smaller organisms have
12
2.4. Feces
Although the importance of feces in nutrient
regeneration has been highly debated, it appears that feces
production does not result in significant amounts of
phosphorus regeneration. Taylor and Lean (1981) found that
release of phosphorus via zooplankton feces was more
important to phosphorus regeneration than direct release of
P to water. However, grazers feeding on algae can excrete
feces capable of nearly the same photosynthetic activity as
the ungrazed algae, and thus the feces would "consume"
bioavailable phosphorus rather than release it via leaching
(Cuker 1983a). In addition, it is probable that microbes
attached to feces, as well as many other organisms, could
consume bioavailable phosphorus in the feces, too (Shepard
and Minshall 1984). Finally, the formation of phosphorus-iron complexes in feces in well oxygenated water may result
in retention of phosphorus within fecal matter (Fukuhara and
Sakamoto 1987).
2.5. Snails
The role of snails as primary consumers in stream
ecosystems is twofold. Snails are scrapers, a type of
grazer, because they feed (scrape) on periphyton adhering to rock surfaces, and snails are detritivores because they
consume leaf detritus (Hom 1982, Mulholland et al. 1985). Algal and microbial communities often adhere to organic and
13
leaves which fall into the water from terrestrial trees, and fragments of bedrock. Thus, snails are commonly found
feeding on periphyton and microbially-colonized rocks and
leaves.
2.6. Food chain effects (predators)
Predators can alter rates of phosphorus regeneration to
water. Predators can increase phosphorus regeneration via
release to water, but can also decrease regeneration
indirectly as a result of decreasing grazer numbers or
activity (McCormick 1990). In addition to lethal effects,
predators decrease grazer activity by causing changes in
feeding behavior or by confining grazers to certain
microhabitats (Power et al. 1985). Predators may consume
grazers of certain sizes, and as a result, change the
average size of grazers in a system, also (Shahady et al. in
press).
3. Research objectives
In this study, I examine the role of snails in
phosphorus cycling in stream periphyton and leaf detritus
communities. More research regarding the role of snails in
phosphorus cycling is necessary for several reasons. This
research should be conducted mainly because a positive
effect of consumers on phosphorus cycling processes has been
explicitly demonstrated for a few types of organisms but not
14
has been shown to be the limiting nutrient for microbial leaf decomposition and algal reproduction occurring in
streams worldwide (e.g. Southeastern United States, Federal Republic of Germany) (Elwood et al. 1981, Jurgens and Gude
1990); thus, the role of primary consumers in phosphorus cycling is crucial for algal production and microbial leaf decomposition. Many past studies on phosphorus have
presented turnover and regeneration rates, but few have
evaluated all of the major fluxes involved in phosphorus
cycling in attached algal and microbial communities in
streams, also. Finally, snails are numerically abundant in many streams. Because they are the dominant herbivore in
most streams on the Oak Ridge reservation, which was the
site of my research in eastern Tennessee, the impact of
snails on phosphorus cycling in these streams may be high.
My objectives were:
1. To determine the effect of snails on phosphorus cycling fluxes and turnover in streams;
2. To determine the effect of different types of substrates (periphyton, leaf detritus) on phosphorus cycling fluxes in streams; and
15
METHODS
1. General approach
Phosphorus cycling fluxes were studied in the
laboratory while phosphorus turnover was studied in the
field. Both phosphorus cycling fluxes and phosphorus
turnover were measured using radioactive tracer techniques. Periphyton and leaf detritus were labelled with ^'p by
exposing each substrate to ^^PO^ in short term laboratory
incubations. Labelled substrates were then transported to
the field or placed in beakers in the laboratory. Snails
were excluded from half of the labelled substrates, and added to the rest of the labelled substrates, at both study
locations. In the laboratory studies, the release of ''p from ^^P-labelled algae or leaf detritus back to water was
measured. In addition, ^^P and total phosphorus content of
the substrates, snails, and feces were measured. Phosphorus
fluxes were then calculated from the ^^P data and ^'P / TP ratio in the substrate. In the field studies, ^^P content
of the substrates was measured several times over a period
of days and phosphorus turnover rates were calculated from
16
FIGURE 2. PHOSPHORUS FLUXES IN THE PRESENCE AND ABSENCE OF
SNAILS IN PERIPHYTON AND LEAF DETRITUS ^^P LABELLED COMMUNITIES
WITHOUT SNAILS
INORGANIC PHOSPHORUS
INORGANIC PHOSPHORUS
DRUS---(a)---ͨ
PERIPHYTON OR DETRITUS
WITH SNAILS
1 (b)
L—ͨ REGENERATION
PERIPHYTON OR DETRITUS
(«)
DRUS---(a)---ͨ — (d)-^ SNAILS —(0-^ FECES
1
1 (c)
'?* '—ͨ REGENERATION
l—^- REGENERATION
FLUXES:
(a) UPTAKE OF ''P FROM WATER BY PERIPHYTON OR LEAF DETRITUS (b) RELEASE OF '^P FROM PERIPHYTON OR LEAF DETRITUS TO WATER (c) RELEASE OF "P BY SNAILS TO WATER
(d) "P IN FECES AND IN SNAIL BIOMASS
(e) "P RETAINED IN BIOMASS OF SNAILS GRAZING *P LABELLED PERIPHYTON OR LEAF DETRITUS
, ^i» !5^,'Ss^5Sf?aj*«-f^:r^'-i-s----7»; .--•ͣ
.-H--17
2. Description of research areas
2.1. Field site
The field studies which investigated the effect of snails on phosphorus turnover were performed in the West
Fork of Walker Branch, a first order woodland stream in the
Oak Ridge National Environmental Research Park which is located in eastern Tennessee (Newbold et al. 1983b). A
detailed description of the system is provided by Curlin and
Nelson (1968).
The stream drains a 38.4-ha forested watershed within
the research park and is fed primarily by springs and seeps
that arise in dolomitic limestone. The stream bottom
consists mostly of cobble and gravel-size chert and outcrops of the parent dolomite (Newbold et al. 1983b). The stream is comprised of small pools and riffle areas with low summer baseflows of 3 - 5 L/s and occasional winter and spring
storm flows which surpass 50 L/s (Mulholland et al. 1990).
Stream gradient averages 55.9 m/km and mean annual discharge is 10.5 L/s. Water temperatures vary from winter lows of 4 - 5 °C to summer highs of 17 °C. During baseflow, the
average depth is 5 - 10 cm and the average width is 3 m
(Mulholland et al. 1990).
A forest canopy consisting mostly of oak fOuercus spp.) and hickory (Garya spp.) covers the stream from May through
September (Elwood and Nelson 1972). Stream algae are dominated by basal cells of the green alga Stigeoclonium.
18
herbivory (Rosemond et al., in press, Steinman 1992).
Although stream fauna is composed of over sixty species of
benthic macroinvertebrates, the snail Elimia clavaeformis is by far the dominant stream invertebrate organism (Hom 1982,
Mulholland et al. 1985, Elwood and Nelson 1972). This
species of snail represents more than 90% of the total
biomass of the stream, and average snail density ranges from
1000 snails/m^ to 1500 snails/m^.
Stream chemistry reflects the parent dolomite.
Alkalinity is 2 - 3 meq/L and streamwater pH is 7.4 - 8.2 (Mulholland et al. 1990). Dissolved oxygen levels are at or close to saturation levels throughout the year (Mulholland 1992). Concentrations of soluble reactive phosphorus (SRP) range from <1 to 6 ug/L (Mulholland 1992). Concentrations
of ammonium are <5 ug N/L and concentrations of nitrate
range from <5 to 60 ug N/L (Mulholland 1992). Studies
involving long-term phosphorus and nitrogen enrichments have
shown that algal growth and leaf decomposition in Walker
Branch are phosphorus limited (Newbold et al. 1983a, Elwood et al. 1981).
2.2. Laboratory
The experiments on phosphorus regeneration were
conducted in 1 L beakers. The beakers were kept in a large
tank which served as a constant temperature water bath (12 -20 °C) and the oxygen concentration of the water in the
19
as well as the substrates and/or snails in the beakers
originated from the natural stream (described above) or an artificial laboratory stream. The artificial laboratory streams are supplied with snails and periphyton from the
natural stream and once-through flow from a spring-fed pond.
These streams are illuminated by overhead metal halide lamps
providing approximately 100 umole quanta m'^s"^ (or 100
uEinstein m"^s'^) at the water surface. The temperature of
the artificial streamwater is 12 - 15 °C. The SRP
concentration of the artificial streamwater is generally 4
-6 ug/L, and the oxygen concentration is close to saturation levels (Mulholland et al. 1991).
3. Focus and hypothesis of each experiment
3.1. Experiment 1
The effect of snail grazing on phosphorus cycling fluxes in periphyton communities as well as the effect of water phosphorus content on these fluxes was investigated in the laboratory. It was hypothesized that snail grazing
would increase phosphorus cycling fluxes, especially in
algal communities which had been exposed to water with a
high phosphorus content.
3.2. Experiment 2
Experiment 2 was performed to investigate the effect of snail grazing on phosphorus turnover in periphyton
20
of snails would increase turnover rates of phosphorus from periphyton.
3.3. Experiment 3
The third experiment was very similar to Experiment 1
except that it used leaf detritus. The hypothesis of the
experiment was that snails would have a positive influence
on phosphorus cycling fluxes in leaf detritus communities.
3.4. Experiment 4
The effect of snail grazing on phosphorus turnover in
leaf detritus communities in the field was determined in
this experiment. As in Experiment 2, I hypothesized that
the presence of snails would increase the turnover rate of
phosphorus from a community, but I used leaf detritus rather
than periphyton in this experiment.
4. Specific experimental methods
4.1. Experiment 1
4.1.1. Preparation of substrates before labelling
Experiment 1 used periphyton communities grown on tiles
(exposed surface area per tile equalled 9.5 cm^) in large
laboratory streams for approximately 6 months. The tiles
were unglazed, solid, ceramic, and cylindrical (1.5 cm high
by 1.5 cm wide) (DU-CO Ceramics "ceramic cylinders"). In
addition, half of the periphyton covered tiles were grown in
'-^^^^^rjwa-5 -y'^;^.^?^^'*:.-^ ^^^^ ^^^^
21 an enriched SRP concentration. This concentration was 5-7
times the ambient, or in stream, SRP concentration of the streamwater. To elevate streamwater SRP concentration, a
carboy delivered drops of a phosphate solution to a section
of the stream for 18 days, and the SRP concentration
increased from 4-5 ug/L to about 27 ug/L. The function of
the two sections of the stream was to provide two different samples of algae. In other words, the algae in the SRP
enriched section of the stream would contain more phosphorus
than a similarly sized sample of algae found in the ambient
SRP section of the stream.
4.1.2. ^^P labelling and uptake
Six groups of 17 tiles from the ambient SRP section of the stream and 6 groups of 17 tiles from the SRP enriched
section of the stream were placed into recirculating
chambers containing 1 liter of filtered streamwater from the appropriate section of the stream. The water in the
chambers was recirculated by small pumps attached to the
chambers, and the water was filtered through Gelman type A/E
glass fiber filters, 1 urn pore size. The chambers wereplaced in a large tank that served as a constant temperature water bath (15 - 20 °C) . Approximately 0.5 uCi of
carrier-free ^^PO^ was added to each chamber and 1 ml samples were
taken at varying intervals over a 6 - 23 hour period from
each chamber and assayed for ^^P activity by liquid
-22
23 hours, was chosen on the basis of past research (Newbold et al. 1983b)). Rates of phosphorus uptake were computed
from the first-order uptake rate coefficient and the SRP concentration in water. The rate coefficient was determined
from the decline in '^P in water during the first 30-60
minutes of the experiment. SRP was measured by the standard molybdate blue ascorbic acid method using a Perkin-Elmer dual path length spectrophotometer (APHA, 1989).
4.1.3. Phosphorus cycling fluxes
After the tiles were labelled with ^^P, they were
placed in streamwater for 1 hour (in order to remove any '^P
adsorbed to the surface of the algae). Then 5 tiles from
each of the 12 groups of 17 tiles were collected for
determination of algal incorporation of ^'P. Each of the 12
remaining groups of 12 tiles was placed into 1 of 12 600 ml
beakers containing 315 ml or 415 ml of filtered (asdescribed above) streamwater from the appropriate section of
the stream. Approximately 100 ug/L PO^ was then added to
each beaker containing water and tiles from the ambient SRP
section of the stream to prevent reuptake of '^P released to
water by algae. This phosphate addition did not alter the P
: C ratio in the algae because a change in this ratio would
reguire a much longer time period than that of theexperiment. Snails collected from Walker Branch and
acclimated for 24 hours to streamwater from the artificial
23
containing tiles from each stream section. All beakers were
covered with pieces of plastic film (11.5 inches wide by approximately 9-14 inches long by 0.0005 inches thick,
Indusol, Inc. "Stretch-tite" plastic sheet household wrap)
to prevent snails from leaving the beakers and retard
evaporation. Then the beakers were placed in a large tank
which served as a constant-temperature water bath that
maintained the beakers at 12 °C. Air was continuously
supplied to each beaker to mix the water and keep dissolved
oxygen concentrations at nearly saturated levels.
Five ml samples were collected from each of the beakers
in triplicate at varying intervals over a 3 - 5 hour period and filtered using Nucleopore membrane filters of 0.45 um pore size. The samples were added to 15 ml of Ecolume (ICN
Biomedicals Corporation), and assayed for ^'p activity by
liquid scintillation counting whereas the filters were
discarded. Tiles were then removed from the beakers, rinsed in artificial streamwater, and dried at 80 "C for 24 - 48 hours. Snails were transferred to fresh streamwater in
beakers for an additional 24 hours to allow for clearance of gut contents. Snails were then collected, rinsed, their shells cracked, and dried at 80 °C for 24 - 48 hours. Snail
feces which were produced during the experiment and during
the time allotted for clearance of gut contents were removed
SIS^IS
24
and reweighed to obtain ash mass. Ash free dry mass (AFDM)
was computed as the difference between dry mass and ash
mass.
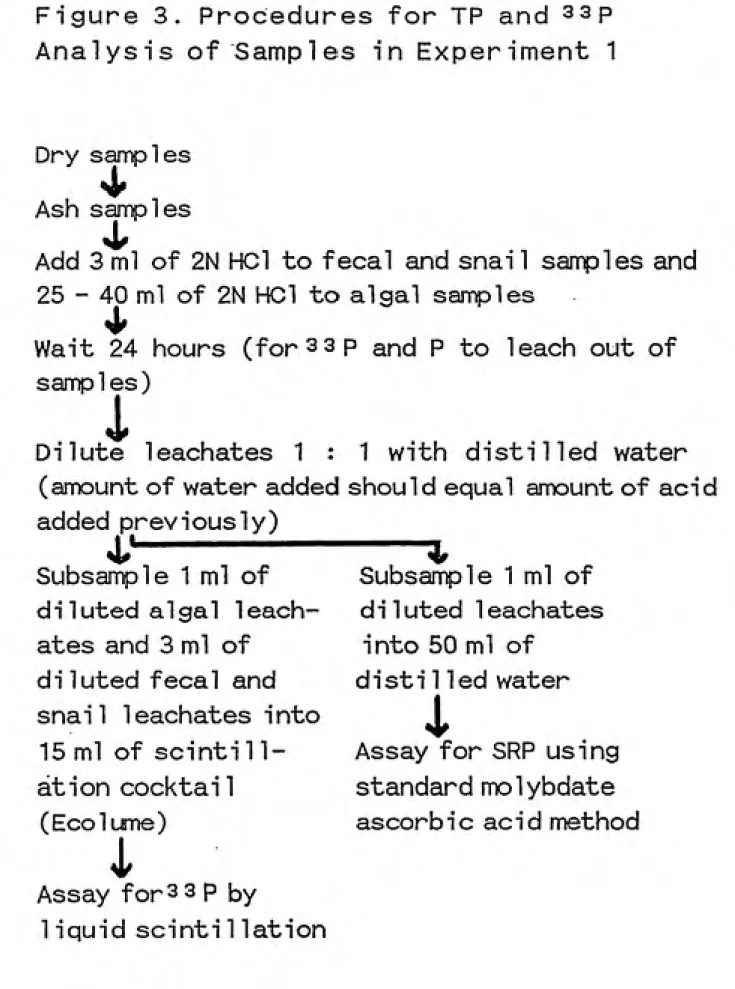
4.1.4. TP and ^^P analysis of periphyton. snails, and feces
After the samples had been combusted, the ^'p and total
phosphorus were leached from the fecal and snail samples
with 3 ml of 2N HCl and from the periphyton samples with
25 - 40 ml of 2N HCl for 24 hours. The leachates were
diluted 1 : 1 with distilled water. Then 1 ml of the
diluted algal leachates and 3 ml of the diluted fecal and
snail leachates were added to 15 ml of Ecolume and assayed
for ^^P by liquid scintillation. In addition, 1 ml of the
diluted leachates was added to 50 ml of distilled water and
assayed for SRP as described above (Figure 3). Both water
and organic matter '^P measurements were corrected for
background activity and isotopic decay. The ^^P of the
background samples (initial conditions) were measured in the
same manner as the '^P of the experimental samples.
Phosphorus regeneration rates were computed from the
measured increases in '^P concentration in the water in each
beaker and the ''P : total P ratio of the periphyton used in
the study. Incorporation of P into snails and feces
phosphorus production were computed from the measurements of snail and feces '^P and the ^^P : total P ratio of
25
Figure 3. Procedures for TP and 33p
Analysis of Samples in Experiment 1
Dry samples
Ash samples
Add 3 ml of 2N HCl to fecal and snai 1 samples and
25 - 40 ml of 2N HCl to algal samples
Wait 24 hours (for 33 p and P to leach out of
samples)
i
Dilute leachates 1 : 1 with distilled water
(amount of water added should equal amount of acid
added previously)
4."---Subsample 1 ml of
diluted algal leach¬
ates and 3 ml of
diluted fecal and
snail leachates into
15 ml of scintil
1-ation cocktai 1
(Ecolume)
Subsample 1 ml of
d i1uted 1eachates
into 50 ml of
disti 1 led water
4
Assay for SRP using
standard nx^lybdate
ascorb i c ac i d method
i
Assay for 3 3 p by
26
4.2. Experiment 2
4.2.1. Preparation of substrates before labellincf
Experiment 2 used periphyton covered tiles prepared as in Experiment 1. However, the SRP concentration of the streamwater in which periphyton grew (on tiles) was not altered.
4.2.2. ^^P labelling and uptake
The same basic techniques for labelling algae as used
in Experiment 1 were utilized in this experiment except that
periphyton colonized tiles and water came from Walker Branch
rather than from the laboratory streams. In addition, 6
groups of 20 tiles were labelled over a 3 hour period rather
than 12 groups of 17 tiles which were labelled over a 6 - 23
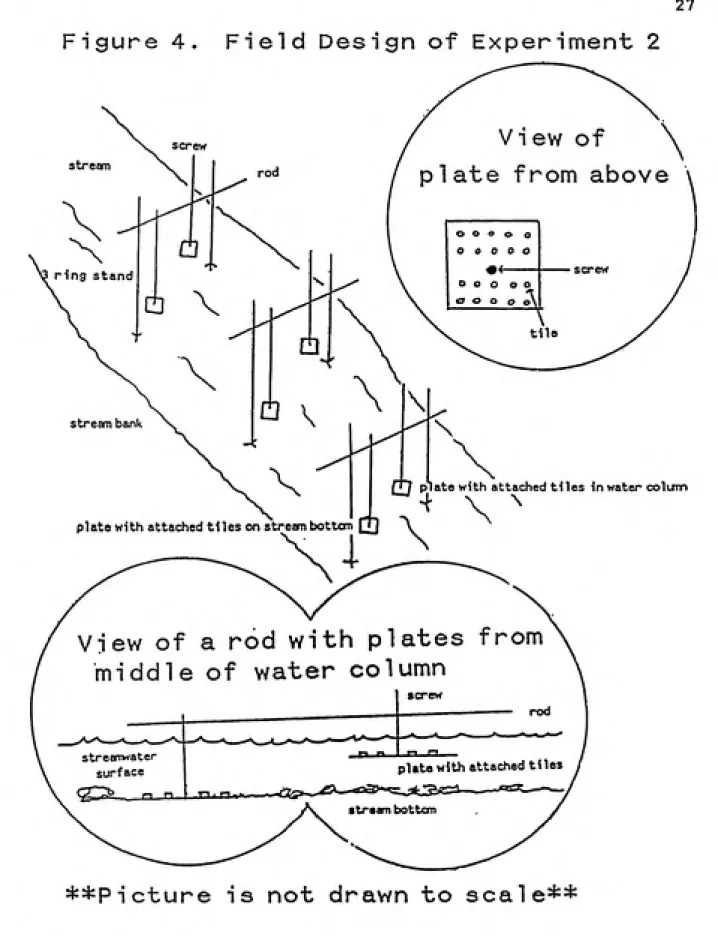
hour period. The ^'p labelled tiles were transported to the
field and each group of 20 tiles was attached to a 20.5 cm X 20.5 cm plexiglass plate with silicone cement. Each plate
had a screw bolted through its center that allowed it to be
clamped to a horizontal rod suspended over the stream. Each
plate could be suspended off the stream bottom to prevent snail access or placed on the stream bottom to allow snail
grazing of the attached tiles. The 6 plates with attached tiles were placed into 3 groups, each group containing two
plates. One plate of each group was suspended about 5 cm off the bottom (no snail treatment), and the other plate was
27
Figure 4. Field Design of Experiment 2
ring stand
^
stream bank
plate with attached tHes on stream bottcm [u
View of a rod with plates from
middle of water column
strearrwater
surface plate with attached tiles stream bottom
M / plate with attached tiles in water colum
4 \ \
28 Approximately 60 snails were placed on each of the plates on
the bottom to initiate grazing at a level similar to natural snail densities in Walker Branch. Snail densities on all plates were checked twice per day (morning and mid-afternoon) . The number of snails on tiles were counted as
well as the total number of snails on each plate. If fewer
than 60 snails were present on the plates, snails were added to the plates to reestablish the correct snail density.
Finally, any grazers present on the no snail treatments
(suspended plates) were removed.
4.2.3. Phosphorus turnover
Five tiles were collected from each plate on days 0 (2 hr after placement in stream), 4, 8, and 14. The tiles were dried at 80 "C, weighed, combusted at 500 "C, and reweighed, and AFDM was calculated as described for Experiment 1. ͣ^^P in the periphyton on each tile was then extracted in 5 ml of
2N HCl and assayed as described in Experiment 1. Total phosphorus in the samples was not measured. The ^^P counts
were corrected for background activity and radioactive
decay. The ^'p counts for each tile were log-transformed
-i^^^K!»wn»3?«
29
4.3. Experiment 3
4.3.1. Preparation of substrates before labelling
Experiment 3 used leaf detritus communities grown on leaf strips rather than periphyton communities grown on
tiles. Autumn-shed White Oak leaves, which had been
collected from the local area, air dried, and maintained in
a dry state for 5 years, were soaked overnight in distilled
water and then cut into 2.25 cm X 7 cm leaf strips. The strips were attached in sets of 3 to "Plastick Binder" plastic clips, and placed in a topless, wire mesh
rectangular cage (115 cm long by 17 cm wide by 9 cm high) in
Walker Branch for 10 days. 28 clipped sets of leaves were placed in an alternating pattern within 2 rows, 14 clipped sets of leaves per row, for efficient use of space in the cage. The wire cage was placed on a flat bridge of rocks to allow the top of cage to rise a few centimeters above the water surface. The base of the cage was surrounded by rocks to keep the cage from floating downstream (Figure 5). The leaf strips were placed in the stream to allow for microbial colonization (exposed surface area per leaf strip equalled
16 cm^) . The time allowed for microbes to grow on the leaf
strips (10 days) was chosen in order to establish a moderate level of bacterial colonization on the leaves (Mulholland et
al. 1984).
4.3.2. ^^P labelling and uptake
30
Figure 5. Microbial Colonization of Leaf
Strips in Walker Branch for Experiment 3
stream bank wire mesh cage
streanrwater
stream bottan
rocks
clipped leaf strip groups
31
Experiment 1, except that the time of exposure to '^P was
chosen to be 5 hours, instead of 6 - 23 hours, based on
previous research (Mulholland et al. 1988). Three clipped leaf strip groups were placed in each 1-L recirculating chamber, resulting in 9 leaf strips. In addition, total
surface area of the 8 leaf strips placed in each beaker (128
cm^) was similar to the total surface area of the 12 tiles
placed in each beaker (114 cm^) used in Experiment 1.
4.3.3. Phosphorus cycling fluxes
After the leaf strips were labelled with ^'p, they were placed in streamwater overnight in order to remove any ^^P
adsorbed to the surface of the algae. Then 1 leaf strip
from each group of 9 strips was collected for determination
of algal incorporation of ^^P and total phosphorus. Each of
the 6 remaining groups of 8 leaf strips was placed into 1 of 6 1000 ml beakers containing 365 ml of filtered (as
described above) streamwater.
Procedures involving snails, beakers in the tank, and
sampling for water followed in this experiment were as described for Experiment 1 except that water samples were
collected over a 2 hour period rather than over a 3 - 5 hour
period. At the end of the experiment, leaf strips, snails,
and feces were removed from beakers, and AFDM, '^P, and
total phosphorus content measured as described for
32
leach out '^P and total phosphorus.
4.4. Experiment 4
4.4.1. Preparation of substrates before labelling
Experiment 4 used leaf detritus strips prepared as in
Experiment 1.
4.4.2. ^^P labelling and uptake
Four sets of three leaf strips were clipped to the sides of each of the 6 plexiglass plates used in Experiment 2, resulting in 12 strips per plate. Total surface area of
the 12 leaf strips "clipped" to each plate (192 cm^) was
similar to the total surface area of the 20 tiles attachedto each plate (190 cm^) used in Experiment 2. The plates with attached leaf strips were placed in Walker Branch just prior to a 90 - minute injection of 1.5 uCi of '^P. The
injection was made by pumping a ^'p mixture (1.5 uCi of ^^P
and 4 L of streamwater) from a carboy into the stream at a continuously slow rate of 44 ml/min..
4.4.3. Phosphorus turnover
After the ^'p labelling, the plates were transferred to
the same site used in Experiment 2 and 4 strips were removed
from each plate for ^^p assay on days 0 (2 hr after
placement in stream), 4, and 8. Leaf strips were dried,
33
Snail density on all plates was monitored daily.
4.5. Statistical analysis
The effect of snails on phosphorus cyclj.ng and turnover rates was analyzed by use of a one-way ANOVA (SAS/STAT
1988). If P was less than 0.10, the effect under
consideration was deemed not significant. If P was less
than 0.05, the effect being analyzed was significant. If P
was less than 0.01, the effect under scrutiny was highly
34
RESULTS
1. Experiments 1 and 3
1.1. Phosphorus uptake
The rate of phosphorus uptake by periphyton was about 40% higher in the ambient streamwater phosphorus treatment
than in the high (enriched) streamwater phosphorus treatment (Figure 6). The effect of treatment on algal phosphorus
uptake rate was marginally significant (F = 3.55, P =
0.0888, df = 1,10) (Figure 6).
The phosphorus uptake rate was only about 10% higher in
the leaf detritus study than in the periphyton study, and this effect of substrate type on uptake rate of phosphorus was not significant (Figure 7). The substrate surface areas used in the periphyton and leaf detritus experiments were similar as described above. Streamwater SRP concentrations
were slightly greater for the periphyton study (4.4 ug P/L) than for the leaf detritus study (3.5 ug P/L).
1.2. Phosphorus regeneration
The rate of regeneration of phosphorus from periphyton
back to water in the absence of snails was about 50% higher
under the ambient streamwater P treatment than under the
high streamwater P treatment, and this effect of streamwater
35
F1gure 6 .
Effect of Streamwater Phosphate Concentration
on Phosphorus Uptake and Regeneration to
Water in Periphyton Communities
n Ambient P Treatment
^ High P Treatment
P Uptake
Regeneration of P Regeneration of P
to Water w/out to Water w/ Snails Snails
Significance, 1-Way ANOVA; mean ± SE
S-^C^. -^J-^-. ͣ•.ͣ,t^^,\.:
36
F i gure 7 .
Effect of Substrate Type (Periphyton,
Detritus) on Phosphorus Uptake and
Regeneration to Water
[J Periphyton m Detritus
**x *•*
P uptal<e Regeneration of P Regeneration of P
to Water w/out to Water w/ Snails
Snails
Significance, 1-Way ANOVA; mean ± SE
37 (Figure 6). However, the regeneration rate was only about 10% greater in the high streamwater P treatment as compared to the ambient streamwater P treatment in the presence of snails, and this effect of streamwater phosphorus treatment
was not significant (Figure 6). Regeneration rates were
about 55% of the uptake rate in the ambient and high
streamwater phosphorus treatments in the absence of snails. However, regeneration rates were approximately 80% of the
uptake rate in the ambient streamwater phosphorus treatment
and >100% of the uptake rate in the high streamwater phosphorus treatment with snails (Figure 6).
Regeneration rates in the leaf detritus study were approximately 30% of the regeneration rates in the
periphyton study, in both the presence and absence of
snails. This effect of substrate type on rates of
phosphorus regeneration to water was significant (Figure 7). The significant effect of substrate type on phosphorus
regeneration rate is in contrast to the lack of effect of substrate type on phosphorus uptake rate. This indicates that phosphorus cycled more rapidly in the periphyton
system.
The rate of phosphorus regeneration to water from
periphyton was increased in the presence of snails under both ambient and high streamwater phosphorus treatments
38
F i gure 8.
Effect of Snails on P Regeneration to Water
from Periphyton and Detritus Communities
n No Snail Treatment ^ Snail Treatment
Ambient P High P Detritus Study
Periphyton Study Periphyton Study
Significance, 1-Way ANOVA; mean ± SE (n = 3)
39
snails, the increase was only marginally significant for the
ambient phosphorus treatment (F = 5.06, P = 0.0876, d,f =1,4) and not significant for the high phosphorus treatment
(F = 4.10, P = 0.1128, d,f = 1,4) (Figure 8). In the leaf
detritus experiment, snails increased the rate of phosphorus
regeneration by about 30%, but this effect was notsignificant (Figure 8).
1.3. Phosphorus incorporation into snail biomass and feces
production
Although the rate of phosphorus incorporation into
snail tissue was about 50% greater in the ambient
streamwater phosphorus treatment than in the high streamwater phosphorus treatment, this effect was not
significant (Figure 9). In addition, the feces production
rates were very similar in both streamwater P treatments,
and total feces production was only 10% higher in the
ambient streamwater P treatment as compared to the high P streamwater treatment. This effect of streamwaterphosphorus treatment on both measures of feces production was not significant (Figure 9).
40
F i gure 9 .
Effect of Streamwater Phosphate
Concentration on Phosphorus Incorporation
into Snail Biomass and Feces Production in
Periphyton Communities
ͤ
Ambient P Treatment ^ High P Treatment
1.6
1.4-
1.2-'i
1-Q. S0.8 X Z)
u!.o.6-\
Q_0.4-]
0.2 0P Incorporation
Into Snail Biomass P Feces Productionmean ± SE (n = 3)
Total Feces Production -4 -3.5 4.5 Q u_ < E
2.5 §
o
O
-2
1.5 <u
o
U_
hi 75
ͣ
*-•
o
ͣ
ya^^^'t.^..'^^T
-41
F i gure 10.
Effect of Substrate Type (Periphyton,
Detritus) on Phosphorus Incorporation into
Snail Biomass and Feces Production
U Periphyton M Detritus
yckic
•kick
P0.6-P Incorporation
into Snail
Biomass
P Feces Production
Total Feces Production
Significance, 1-Way ANOVA; mean ± SE (n = 3)
= p<0.10
•*
= p<0.05
•**
42
periphyton study, about 85% of the phosphorus ingested was
incorporated into snail tissue, whereas about 15% of the
phosphorus ingested went into feces production (Figure 11).
However, when snails grazed on leaf detritus, approximately
40% of the phosphorus ingested was incorporated into snail
biomass and about 60% of the phosphorus ingested went into
feces production (Figure 12).
1.4. Phosphorus content of substrate, snail, and feces
The effect of streamwater phosphorus treatment on
substrate P content could not be analyzed for the periphyton
in the high streamwater phosphorus treatment because the
periphyton AFDM for that high P streamwater treatment was
not precisely measured. A balance which could not detect
minute changes in weight was mistakenly used for the
measurement of dry and ash mass of the high P streamwater
treatment algae. However, periphyton AFDM for the ambient
streamwater phosphorus treatment was measured. The average
AFDM of tiles from an artificial stream which had an ambient
concentration of phosphorus was 4.75 + 0.28 mg/tile (N=6).
When measured as ug P/AFDM, phosphorus content of leaf
detritus was only about 10% of algal phosphorus content, and
this effect was significant (Figure 13). However, when
measured as ug P/cm^, the P content of the substrates was
very similar and there was no significant difference between
substrates. Finally, the phosphorus contents of snails and
43
Figure 1 1 .
EFFECT OF SNAILS ON PHOSPHORUS FLUXES (MEAN + STD DEV) DURING PERIPHYTON
EXPERIMENT P INGESTION IS CALCULATED AS THE SUM OF P INCORPORATION AND FECESPRODUCTION. OTHER FLUXES WERE MEASURED DIRECTLY.
WITHOUT SNAILS
P UPTAKE
(4.21 ±1.48 ng/hr)
ALGAE (P CONTENT 0.00354 ± 0.00024 g/g) P RELEASE TO WATER
(2.30 ± 0.34 iig/hr)
>
WITH SNAILS
P UPTAKE
(4.21 ± 1.48 ug/hr)
ALGAE (P CONTENT. 0.00354 ± 0.00024 g/g) P RELEASE TO WATER (3.34±0.74ng/hr) P INGESTION (1.48ug/hr) \7 SNAILS (P CONTENT 0.00296 ± 0.00014 g/g)
y
P INCORPORATION(1.27±0.29 ng/"h?r> S^*°f.
-^---1^— ingestion
FECES (0.21 ± 0.06 tig/hr)
FECES
(P CONTENT 0.00216 ± 0.00025 g/g)
14 % of
44
Figure 1 2 .
EFFECT OF SNAILS ON PHOSPHORUS FLUXES (MEAN + STD DEV) DURING LEAF
DETRITUS EXPERIMENT. P INGESTION IS CALCULATED AS THE SUM OF P INCORPORATION
AND FECES PRODUCTION. OTHER FLUXES WERE MEASURED DIRECTLY.
P UPTAKE
(4.52 ±1.41 ng/hr)
WITHOUT SNAILS LEAVES (P CONTENT 0.00027 ± 0.00002 g/g) P RELEASE TO WATER
(0.81 ±0.18 jig/hr)
P UPTAKE
(4.52 ±1.41 ng/hr)
WITH SNAILS
LEAVES
(P CONTENT -0.00027 ± 0.00002 g/g) P RELEASE TO WATER (1.0'5±0.35ng/hr)
o
P INGESTION (2.01 ixg/hr)O
SNAILS(P CONTENT .
0.00344 ±
0.00087 g/g)
P INCORPORATION
(0.85 ±0.29 ng/hr)
42 % of
ingestion
V
FECES
(1.16 ±0.27 jig/hr)
FECES
(P CONTENT 0.00253 ±
0.00018 g/g)
58 % of
45
Figure 13.
Effect of Substrate Type (Periphyton,
Detritus) on Phosphorus Content of
Substrate, Snail Tissue and Feces
ͤ
Periphyton H Detritus
!U2.5n
**•
Substrate P Substrate P Snail P Feces P
Content Content Content Content
-2
(/vg P cm )
(/jgPmgAFDM"'') (/;g Pmg AFDM""*) (pg Pmg AFDM""")
Significance, 1-Way ANOVA; mean ± SE
46 study than in the periphyton study, but this effect was not significant for snail P content and only marginally
significant for fecal P content (F = 4.65, P = 0.0973, d,f =
1,4) (Figure 13). The minimal effect of substrate type on phosphorus content of the feces is in contrast to its highly
significant effect on fecal phosphorus flux. This underscores the importance of the much larger total
production of feces in the detritus study compared with the
periphyton study.
2. Experiments 2 and 4
2.1. Phosphorus turnover
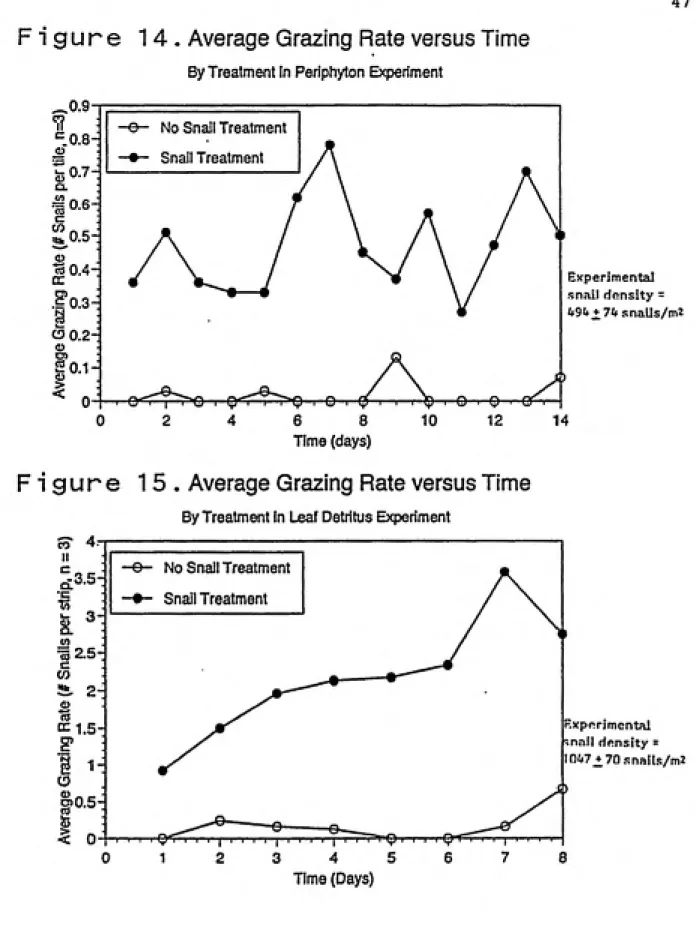
Grazing rates of snails in the field turnover studies
varied considerably by substrate and treatment. Grazing rates of periphyton had more fluctuations over time than
grazing rates of leaf detritus in snail and no snail treatments (Figure 14, 15). In addition, the ranges of
grazing rate values were smaller for the periphyton
experiment than for the leaf detritus experiment (0.00
0.13 versus 0.00 0.67 in no snail treatments and 0.27 -0.78 versus 0.92 - 3.58 in snail treatments) (Figure 14,
15). Finally, grazing rates in the snail treatments
increased over time in the leaf detritus study compared to
the periphyton study (Figure 14, 15).
The turnover rate was increased by about 45% in the
periphyton experiment by snails, and by about 70% in the
47
Figure 14. Average Grazing Rate versus Time
By Treatment in Periphyton Experiment
^0.9-1?
10.8-% 0.7^
Q. <o "3 0.4-ccf0.3i
0 0.2^ <i>go.H
^ 0
No Snail Treatment
Snail Treatment
(y<f^r^ , qx-'^^^
-e- 1—1 1 y I O I (j) 6 8 10 12Time (days)
Figure 15. Average Grazing Rate versus Time
By Treatment in l.eaf Detritus Experiment CO 4
II •c t5 CO =5 2.5d c CO
& 2
E1.5H
o
0)0.5-is
^
0-No Snail Treatment
Snail Treatment
Experimental snail density " k9it + 7kRnails/n\^
14
Rxpprimental ^nnil dfinsity =
I0i»7_f 70 snails/mZ
48
snails on rate of turnover was not significant in the
periphyton study and was significant in the leaf detritus
study (Figure 16). It is interesting to note that snails
significantly affected turnover rates when leaf detritus was
used but did not significantly affect rates of regeneration
from leaf detritus (Figure 8). Thus, it appears that the
major effect of snails when feeding on detritus is the flux
49
F i gure 1 6 .
Effect of Snails on Phosphorus Turnover
in Periphyton and Detritus Communities
ͤ
No Snail Treatment
'Zl Snail TreatmentDetritus Study
Penphyton Study
-r--0.05
O-0.15
Significance, 1-Way ANOVA; mean ± SE (n = 3)
50
DISCUSSION
1. Effect of snails on phosphorus cycling fluxes and
turnover
Although there was some evidence of an increase in rates of phosphorus regeneration to water from periphyton
and leaf detritus as a result of snail grazing, this effect was only marginally significant for the ambient P
streamwater treatment using periphyton, and was not
significant for the leaf detritus experiment (Figure 8).
The lack of an effect of snails on P regeneration rates might have been the result of similar ratios of P:C in the snail tissue, algae, and bacteria. In this case, there would be little regeneration of P by snails since their cellular needs would be almost met by the nutrient contents of the algae and bacteria. Other studies have also
suggested the importance of nutrient to carbon ratios of consumers relative to their prey in regard to nutrient
regeneration by consumers (Bloem et al. 1988, Sterner 1990).
My results could have also occurred if snails were
P-limited. P should be retained more efficiently by P-limited snails than by C-limited snails.
51 et al. (1985) found that snails had little effect on leaf
detritus mineralization, and this finding is also consistent with my results. In contrast, most other studies on
nutrient cycling involving consumer organisms other than snails, such as protozoans, have demonstrated that grazers do significantly increase rates of regeneration from leaf detritus and algae communities (Berman et al. 1987, Barsdate
et al. 1974, Taylor 1982).
Turnover rates of phosphorus, which are, in effect, the
sum of P regeneration, incorporation into snails, and feces production rates relative to the substrate P pool, did
increase in the presence of snails. The effect of snails on turnover rates was significant only for the leaf detritus study (Figure 16). Others have found that the effects of other consumer organisms on phosphorus turnovsr rates were
significant for leaf detritus and periphyton communities (e.g. caddis fly larvae in streams, zooplankton in lakes)
(Lamberti and Resh 1983, Lehman 1980a). Since snails did
not significantly affect rates of P regeneration, the only
other way in which snails could have increased turnover rates was via other P fluxes from the substrate. My
research revealed that phosphorus fluxes other than
regeneration were created in the presence of snails, specifically incorporation into snail tissue and feces
production, and the sum of these fluxes plus the additional
regeneration flux was large enough to cause turnover rates
52
11, 12) .
Not all of the P fluxes involved in P turnover
necessarily enhance P cycling. For instance, incorporation
of P into snail biomass may actually reduce P cycling
because the pool of P in consumer biomass is probably
regenerated back to water slowly (Berman et al. 1987).
However, incorporation of P into the tissues of consumers
could also stabilize cycling of P in streams because (1.)
algae and leaf detritus might otherwise be transported
downstream, (2.) consumer organisms usually are able to
remain in place, and (3.) consumers, particularly those with
relatively long life spans, have the ability to retain
phosphorus (Kitchell et al. 1979, Taylor 1982, Merritt et
al. 1984).
Feces production, like incorporation of P into consumer
tissue, may not necessarily stimulate P cycling. Such
production may reduce P cycling if feces are readily
transported downstream, or if P in feces is unavailable to
algae and bacteria, as suggested by Fukuhara and Sakamoto
(1987), and is released back to water very slowly. However,
feces production could stabilize P cycling if feces act as a
food source for other consumers and the consumers in turn
regenerate P to water (Shepard and Minshall 1984).
Furthermore, feces production could enhance cycling of P if
photosynthetic activity of undamaged algae in feces or
subsequent attachment of microbes to feces results in
53
et al. 1987). Feces production could also stimulate P
cycling if P is released from feces back to the water via leaching processes, in amounts equivalent to or exceeding
direct release of P to water by consumers (Cuker 1983a,
Taylor and Lean 1981).
2. Effect of substrate type on P cycling fluxes
Results from the experiments designed to compare the P
cycling fluxes between different communities (periphyton
and leaf detritus) are valid although the time allowed for
any ^^P adsorbed to periphyton to be removed (overnight) was
much greater than the time allowed for such removal from
leaf detritus (1 hr). One hour of time should have been
sufficient to remove any adsorbed ^^P to a substrate, and an
overnight period was utilized during the periphyton
experiment only for the sake of convenience.
The results regarding the effect of substrate type on P
cycling fluxes appear to indicate that rates of regeneration
from periphyton are higher than those from leaf detritus
(Figure 7). This result is understandable since leaf
detritus often has a very low ratio of P : C initially.
Thus, bacteria and fungi that colonize detritus may be very retentive of P taken up from the water. The leaf detritus
used in the experiments had a significantly lower P content
(ug P/mg AFDM) than did the periphyton that was used (Figure
13). However, much of the carbon in leaf detritus may not
54
may overestimate the P deficiency of microbes growing on this substrate and detritivores feeding on it. Thus, the
calculated P : C ratios may not completely explain the
effect of substrate type on regeneration rates.
Although rates of P incorporation into snail tissue
were higher in the periphyton experiment than in the leaf
detritus experiment and measures of P feces production were
higher in the leaf detritus study than in the periphyton
study, a significant effect of substrate type was only
observed for the measures of feces production (Figure 10).
These results suggest that snails were limited by the
availability of digestible carbon in the leaf detritus study
(Hill et al. 1992). Snails may have also been limited by C
in the algae study, but a greater fraction of the substrate
which was ingested was incorporated in the periphyton experiment than in the leaf detritus experiment. As a
result, snails have a greater demand for the P in periphyton than for the P in leaf detritus, and less P is lost as
either regeneration or feces production when snails graze
periphyton compared to leaf detritus. Several of my results showed that much more P went into feces produced by snails
grazing on leaf detritus than feces produced by snails grazing on periphyton. For example, if the phosphorus content of a substrate measured per mg AFDM is compared to the feces produced by snails feeding on that substrate, this ratio is much lower in the detritus study than in the
55
considerable quantities of leaf detritus due to its lack of
digestibility, snails consumed considerable amounts of P associated with leaf detritus and had to release much ofthis P due to lack of assimilable C. In fact, in terms of
P, snail feces production in the leaf detritus study was 5 times greater than in the periphyton study, whereas in terms of AFDM, feces production in the leaf detritus study was
only twice as great as it was in the periphyton study
(Figure 10).
If different internal cellular pools, or compartments, of P exist in the substrates and have different cycling rates, there may have been significant changes in some of
those pools that were not detected. Therefore, the
interpretation of my results regarding the effect of
substrate type on P cycling fluxes may have been inaccurate.
This consideration is valid because the substrates wereexposed to ^'p over a short time period. Thus, the
different P pools in the different substrates might have been brought to different states of isotopic equilibrium. The time required for an isotopic equilibrium to be
established regarding ^'p for periphyton is 1 - 2 days, and
I labelled the periphyton covered tiles grown in the ambient
streamwater P treatment for 6 hours (Newbold et al. 1983b).
Furthermore, the time needed for isotopic equilibrium to be