Junjie Wan. A Web-Based Database Management System. A Master’s Paper for the M.S. in I.S degree. April, 2017. 51 pages. Advisor: Robert Capra.
This project develops a web database management system for Gfeller Center at the University of North Carolina at Chapel Hill. This system allows users to upload and download structured data in terms of specific requirements.
The Gfeller Center works on research that studies the health condition of athletes. Researchers have collected a large amount of data from previous studies and they keep collecting data as the research goes on. The researchers need tools to help manage and organize the data and need advanced functionality to support their research. Therefore, this project helps to develop a web database system to manage data according to the requirements of the researchers in Gfeller Center. The system development includes requirements analysis, functionality analysis, and interface design. Finally, this project proposes a plan for usability testing to evaluate the system.
Headings:
Information Systems Requirements Analysis Interface Design
A WEB-BASED DATABASE MANAGEMENT SYSTEM
by Junjie Wan
A Master’s paper submitted to the faculty of the School of Information and Library Science of the University of North Carolina at Chapel Hill
in partial fulfillment of the requirements for the degree of Master of Science in
Information Science.
Chapel Hill, North Carolina April 2017
Approved by
Table of Contents
1. Introduction ... 2
2. Literature Review... 4
2.1 Database System ... 4
2.2 Requirements Gathering ... 4
2.3 Usability Testing... 6
3. System Design and Implementation ... 8
3.1 Requirements Analysis ... 8
3.2 Architecture ... 10
3.2.1 Uploading Subsystem ... 12
3.2.2 Variable Subsystem ... 21
3.2.3 Downloading subsystem ... 27
3.2.4 File subsystem ... 31
3.3 Interface ... 34
4. Usability Testing ... 39
4.1 Tasks ... 40
4.2 Questionnaire ... 42
5. Conclusion ... 45
1.
Introduction
The Sports Medicine Center, Gfeller Center of UNC, are working on a research project which studies the health condition of athletes. Researchers have collected a large amount of data from previous studies and they keep collecting data as the research goes on. The data comes from various sources based on different studies, sports, age levels, funding resources, and investigators. So the size of data keeps growing. However, the researchers use spreadsheet management software like Excel to manage the data. Furthermore, they have frequent interaction with the data and sometimes require advanced functions like merging tables and exporting part of a table. Those operations are time-consuming and have impact on the efficiency of research. Therefore, they need a database management system with the ability of merging all the data into an integrated database and providing advanced functions to serve for the research.
NOTES: 1Bootstrap: http://getbootstrap.com/
and database is realized by PHP, and the database used is MySQL.
This paper describes the process of developing the database management system, including requirement analysis, system design, and system implementation. For system design and implementation, I describe them based on subsystems and their use cases, since use cases are basic components of a system. Moreover, the development of a
2.
Literature Review
2.1 Database System
“A database management system (DBMS) is system software for creating and
managing databases. The DBMS provides users and programmers with a systematic way to create, retrieve, update and manage data.” (Rouse, 2015, paragraph 1). Nowadays, there are millions of DBMSs being used by organizations around the world. They are running on various platform and environments. Also, they provide various services to users.
In 1997, McHugh proposed a DBMS named Lore (McHugh, 1997). This system was used to manage semistructured data. The data could be unsystematic but Lore still tried to keep the original structure and did some processes to build a structured database. Lore would parse and pre-process the data then store them in the database. Lore processes data by query language and uses a “Query Plan Generator” to optimize queries according to the structure of data.
2.2 Requirements Gathering
implemented and measured, they must be specific, unambiguous and clear” (Mifsud, 2013, section 1). He also indicated that “requirement gathering is an iterative process” (Mifsud, 2013, section 2). For example, in the process of requirements analysis a developer may find out that what he thinks the system should do is not exactly what the user wants. The developer could arrange another talk with the user and clarify the ambiguity. There are several ways of gathering requirements including interviews, questionnaire, and direct observation. According to different conditions, requirements gathering processes need to be selected properly and the practices are also important during gathering requirements. Young has listed several suggested practices in his article. For instance, “Document the rationale for each requirement”, “Establish a mechanism to
control changes to requirements and new requirements”, and “Use requirements gathering techniques that are known, familiar, and proven in the organization such as requirements workshops, prototyping, and storyboards” (Young, 2002, p10).
2.3 Usability Testing
“Usability testing is a technique used in user-centered interaction design to evaluate a
product by testing it on users.” (Usability testing, 2017, paragraph 1).
Holzinger (2005) said that “Testing with end users is the most fundamental usability
method and is in some sense indispensable. It provides direct information about how people use our systems and their exact problems with a specific interface” (Holzinger, 2005, p73). He also described three methods of usability testing -- thinking aloud (THA), field observation, and questionnaires. Holzinger thought that thinking aloud could be the most useful method. Thinking aloud is a method of suggesting users to do brain storm during using a system and share their thoughts. When users share their experience immediately, developers are able to find out misleading parts of the system. Field observation is viewed as the simplest method by Holzinger. It needs developers to observe users when they are using a system and take notes to record their actions.
Questionnaire is also important in some cases. A well designed questionnaire can help to find out users’ preferred features.
Nowadays, organizations pay more attention to the use and costs of systems, while little attention has been paid to the system effectiveness. “Evaluation of system
evaluation is improving quality of maintenance.
Learnability is one of the five dimensions of usability testing. Vatrapu (2008)
indicated that learnability can be evaluated by analyzing qualitative data and quantitative information collected from experiments and case studies. Efficiency is another dimension of usability testing. Hamilton and Chervany (1981) proposed that system can be
3.
System Design and Implementation
3.1 Requirements Analysis
“Requirement analysis is the process of analyzing a new or modified product and
determining the user expectations for the product” (Rouse, 2007, paragraph 1). In detail, it includes specifying input data, obtained result, and output data.
For the system presented in this paper, the requirement analysis has gone through an iterative process in which the developer and user keep revising and optimizing the system in terms of user interfaces, functions, and data flow. Before the users are satisfied with the system design, we have arranged several meetings to talk about their requirements and my proposed design.
Here are some of the important requirements:
The system should be able to process Excel spreadsheets. Because users feel like
Because data is collected from different studies, the users want to upload data
based on studies. In other words, they like to combine those data from the same study into the same table of the database. Besides, there are four attributes to categorize data: age level, sports, primary investigator, and funding source. Every set of data which is going to be uploaded should be marked by those categories at first. Different sets of data of the same study could have different value in any of those categories.
For one study, there will be many spreadsheets to be uploaded to the database
management system, and each one could have its own distinct variables and also several common variables with other spreadsheets. Considering one of the requirements is to combine those data from the same study into the same table of database, the system should be able to merge those spreadsheets into a table by adding new attributes and processing duplicated attributes.
When downloading, based on different research purposes the users may wish to
download only a subset of attributes and relative data from a complete table. Also they may need to repeatedly download these subsest of attributes.
Usually, the users would like to compare between several studies in terms of
requirement.
As for downloading, the users would like to preview the data to be downloaded
and to set the target directory.
The users need a file manager to manage files which are uploaded to the server.
They need basic functions including renaming, moving and deleting.
3.2 Architecture
According to the requirements collected from the users, the system needs to provide four main functions which are uploading, downloading, attribute manager and file manager. Therefore, the system is designed to be combined by four subsystems – uploading subsystem, variable subsystem, downloading subsystem, and file subsystem. Figure1 is the use-case model diagram for the data management system. It was created using Popkin Software’s system architect and represents the relationships between the
Delete Category Select Category Manage Category <<uses>> <<uses>> initiates initiates Manage Variables Tree
Manage File and Directory Manage Category Upload Data <<depends on>> initiates Create Variables Group initiates initiates Select Variables <<depends on>> Download Data initiates initiates initiates Figure 1
3.2.1 Uploading Subsystem
Imagine that a researcher named Jay has a dataset to be uploaded. The dataset is contained in an Excel spreadsheet named “DSET26”. It comes from a previous study called “Athletes Brain Health” and the data of the dataset is collected from high school
basketball athletes. The primary investigator who collects the data is Joshua Wayne and the funding source is supported by Company K.
Use Case 1 – Manage category
This use case describes the event of a researcher managing the value of category. It is an abstract use case which is extracted from use case - add category and use case - delete category.
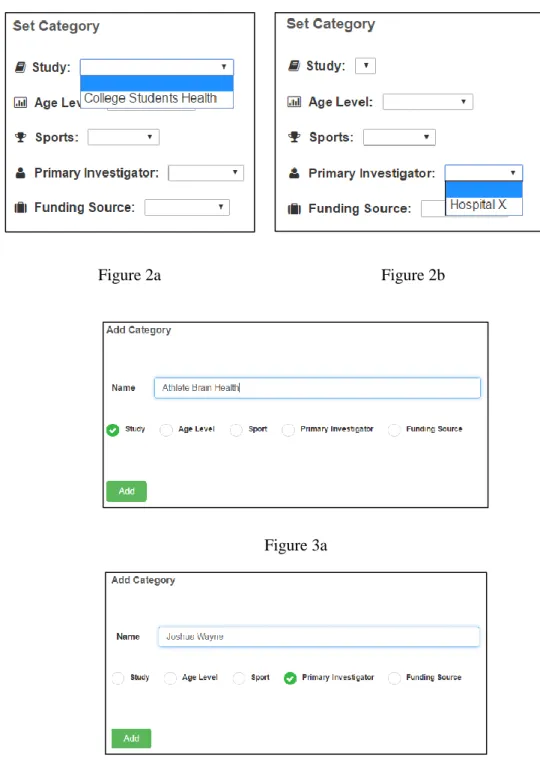
Before Jay uploads the dataset, he needs to set categories to provide basic information. However, Jay finds that “Athletes Brain Health” is a new study to this
system and Primary Investigator doesn’t contain the value he needs (Figure 2a and
Figure 2b). So he decides to add corresponding values to Study and Primary Investigator. In ‘Add Category’ module, Jay checks the ‘Study’ radio button and types the new study name “Athletes Brain Health” into the ‘Name’ bar then clicks ‘Add’ button (Figure 3a).
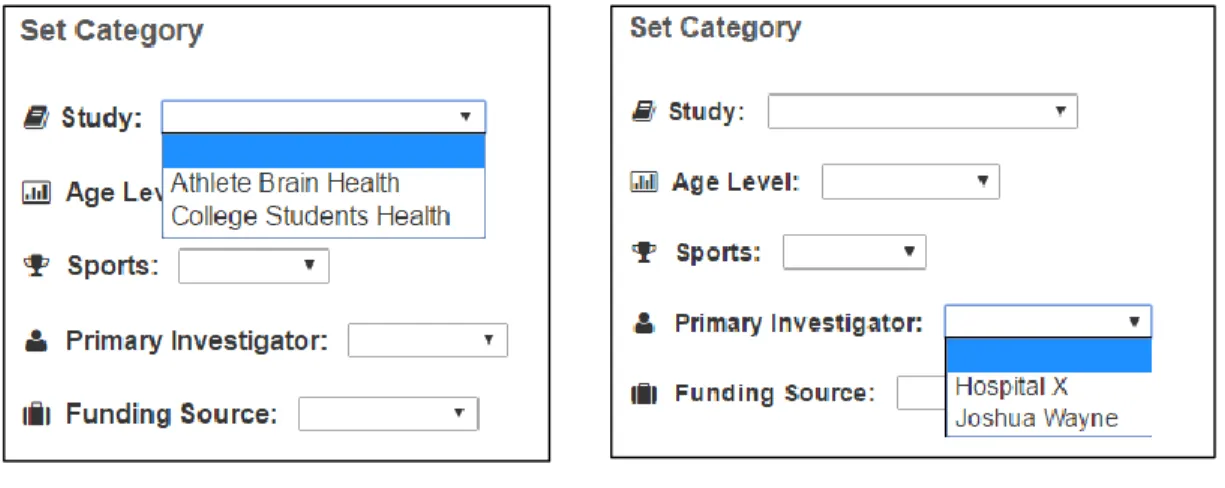
4a and Figure 4b). Specially, when Jay adds a new study, the system will create a new directory with the same name under the directory “/data/upload”, which is for uploading
other datasets of this study to the same place in the server.
Figure 2a Figure 2b
Figure 3a
Figure 4a Figure 4b
Implementation: After Jay types a new category name and selects a radio button, once he clicks the ‘Add’ button, the values of input controls will be submitted to the currently same page by HTTP POST request. After the page reloads, the conditional willl check if the value is posted and is valid, if yes, the new value of the category will be inserted to the database. Code Segment 1 shows the query language of inserting, also it shows the directory creating statements triggered by adding new study.
Code Segment 1
Now, Jay realizes that he has added a wrong value like “baseball” to Sports and he wants to remove the wrong value. He would select “baseball” from the list provided by
Figure 5
Implementation: Like adding category, the values that he selects will be submitted to the currently same page by HTTP POST request. After being checked by condirionals the value will be removed from the database. Code segement 2 shows the implementation of the system removing a value from Sports.
Code Segment 2
Use Case 2 – Select categories
This use case describes the event of a researcher setting values for each category. It is precondition of the use case – Upload Excel spreadsheet.
Figure 6
Use Case 3 – Upload data
This use case describes the event of a researcher uploading an Excel spreadsheet. It depends on the use case -- Set categories, which means the researcher must set all categories before successfully uploading.
After setting all the categories, Jay is ready to upload the dataset “DSET26”. He clicks ‘Choose File’ button then finds and select the Excel file named “DSET26” in the
dialog opened by the browser. Next, he selects the target directory in terms of current study from the directory list. Then he clicks ‘Upload’ button to finish uploading (Figure
Figure 6
Figure 7a
Figure 7b
Figure 7c
Figure 7d
Figure 7f
Implementation: As long as Jay clicks ‘Upload’ button, the information he has
provided including categories, spreadsheet, and target directory will be submitted to the current page by HTTP POST request. At the beginning of this page, it will check if the information is complete and valid. If there is some information missing, the bar will return one of the error messages, otherwise, the page will start to process uploaded spreadsheet. Code segment 3 shows a small part of conditionals for checking the
completeness and validness of submitted information and deciding corresponding prompt and bar theme.
If all provided information is complete and valid, the system will start to upload the spreadsheet. Firstly, the system checks if the study is a brand new study, if it is, the system will create a new table for this study and add four basic category attribute to the table in the database (Code segment 4). A query statement “SHOW TABLES LIKE [TABLE NAME]” is used in the code segment.
Code Segment 4
To process Excel spreadsheets, I take advantage of a library called “phpExcel” to
extract data of spreadsheet and push them to PHP arrays. Then there could be three cases to handle with:
1. There would be new attributes from the uploaded dataset, which don't exist in the table.
2. There would be some records identified by “id” already existing in the table. 3. There would be some new records which don't exist in the table..
Code Segment 5
For the second case, I update all the values for the existing record using query statement “INSERT INTO [TABLE NAME] ON DUPLICATE KEY UPDATE
[COLUMN NAME_1] = [VALUE_1], [COLUMN NAME_2] = [VALUE_2] …” (Code
Code Segment 6
For the third case, I use basic query statement “INSERT INTO [TABLE NAME] ([COLUMN NAME_1], [COLUMN_NAME_2], …) VALUES ([VALUE_1],
[VALUE_2], …) (Code Segment 7).
Code Segment 7
3.2.2 Variable Subsystem
Use Case 1 – Create variable(s) group
This use case describes the event of a researcher creating variable(s) group by selecting part or all of (common) attributes from one or more tables of database.
Jay clicks the ‘Create Group’ button, then all studies will be shown as checkboxes. Jay checks ‘BrainHealth’ to be the related study, then all attributes of the study will be listed as checkboxes below the ‘Common Variables’ label (Figure 8a). Jay checks several attributes and click ‘Create’ button, then a new tree node is created below ‘Variable Tree’
label and it is ready to be renamed (Figure 8b). He names it “group1” and the group has been created successfully. When he clicks any node in the group, the ‘Related Study’ label will present the name of related study of this variables group (Figure 9).
Figure 8b
Figure 9
Implementation: When the ‘Create Group’ button is clicked, a JavaScript function named “create_group()” is invoked. Inside the function, AJAX sends a HTTP GET request to “get_studies.php” file, then “get_studies.php” retrieve all study names from
Code Segment 8
Similarly, when checking one or more study checkboxes, a function called “check_funtion()” is invoked. Inside this function, those study names who have been checked are pushed to an array called “study_array” and AJAX uses HTTP POST to send the array to “get_variables.php” file, then “get_variables.php” retrieves common
Code Segment 9
After selecting all or part of the variables, once the ‘Create’ button is clicked, a function called “set_study()” is invoked (Code Segment 10). Specially, the variable tree is realized
by taking advantage of a jquery plug-in called “jsTree”. It provides interactive trees structure, and it is easily extendable, themable and configurable. Therefore, inside function “set_study()”, an object named “tree” is created and a function of the object is invoked. When invoking the object’s function, a parameter “create_group” is sent as a
Code Segment 10
Use Case 2 - Manage variable(s) tree
This use case describes the event of a researcher managing nodes of variables tree by performing some simple actions.
Jay finds that he includes a useless variable named “PICSS_question_13” in “group1”. So he right-clicks the mouse on the variable and a list of operations is shown
(Figure 10). Then he clicks ‘delete’ to remove the variable from the group. Similarly, to do other operations Jay simply needs to click other buttons. All the actions provided to managing variables tree are creating, renaming, deleting, copying, cutting, and pasting.
3.2.3 Downloading subsystem
Jay has already created a variables group combined with attributes he wants to download. Now, he decides to download the dataset which contains the variables and values of “group1”.
Use Case 1 – Select variable(s)
This use case describes the event of a researcher selecting variables to be downloaded. It is the precondition of the use case – Download data.
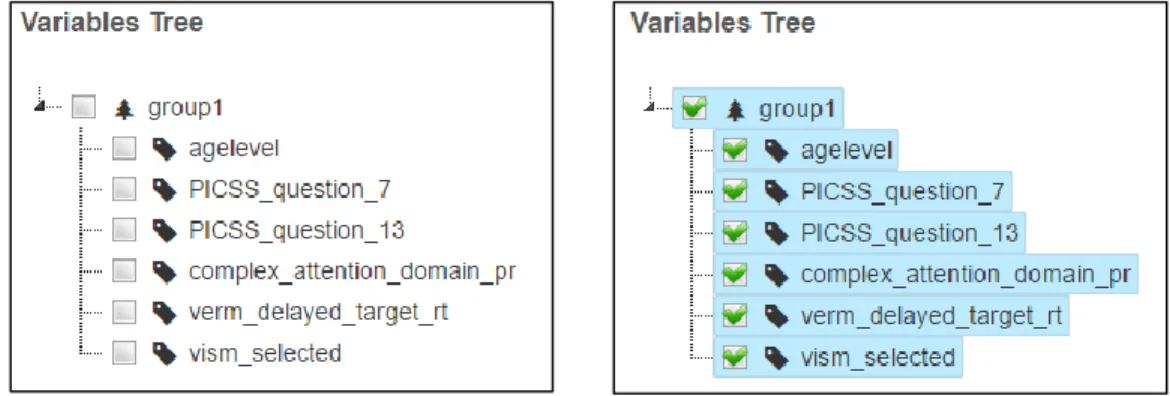
The variables tree is presented in the download page. The difference is that the nodes of the tree can be checked (Figure 11a). Because Jay wants to download all the variables of “group1”, he checks the checkbox of “group1” and all the variables are selected
(Figure 11b). Now, the data panel allows Jay to preview the data he wants to download (Figure 12). Jay is able select the number of records to be shown per page and he can also retrieve record by typing any value of the record into the search bar on the top right.
Figure 12
Code Segment 11
After selecting some variables in the tree, the selected variables’ names are pushed to an array and sent to a php file “get_data.php” by HTTP POST request through AJAX
(Code Segment 12). “get_data.php” retrieves all the data in terms of the variables and related studies, then it decorates the data into a table format and sends it back using AJAX. Now, all the data is stored in a JavaScript variable named “data”. I take advantage of a plug-in called “dataTables”1 to decorate the table by calling
“$('#dataTable').dataTable()”. Therefore, the theme and functions of the table are
Code Segment 12
Use Case 2 – Download data
This use case describes an event of a researcher downloading data which is contained in an Excel spreadsheet from database. Its precondition is the use case – select
variable(s).
After Jay previewing the data he plans to download in the data panel, he decides to download that part of data from the database. He types “Data100” into the text area of sheet name and he chooses “./download/” as target directory. Then he clicks the ‘Download’ button. Finally, Jay can find the spreadsheet named “Data100” under the
directory “download/” in the server.
Implementation: When the ‘Download’ button is clicked, a function named “download_data()” is invoked. Inside the function, JavaScript codes get the values of
selected nodes, sheet name, and target directory, then it sends all those information to “ajax_download.php” by HTTP POST request in AJAX (Code Segment 13). In
“ajax_download.php”, data will be retrieved from the database by query statements, then I use the library “phpExcel” to create a new Excel spreadsheet and store data in it.
Code Segment 13
3.2.4 File subsystem
directory “Athlete Brain Health”.
Use Case 1 – Manage file or directory
In the page of file manager, Jay clicks and opens the directory “Athlete Brain Health” (Figure 14a). Then he clicks the ‘move’ icon of “DSET26” and a new panel named “Move” is shown above the panel “Files” (Figure 14b). He opens the directory list
and selects “/upload/BrainHealth/” (Figure 15). At last, he clicks the button ‘Move’ and a blue bar tells that he moved the file successfully (Figure 16).
Figure 14a
Figure 15
Figure 16
Now, Jay wants to remove the file “PICSS-20160111050501”. He clicks the ‘Delete’ icon and a new panel named “Delete” shows. Jay ensures to delete the file and clicks the ‘Yes’ button (Figure 17). Then a blue bar tells him the file is removed (Figure
18).
Figure 17
3.3 Interface
As I mentioned above, the database management system is combined by four subsystem - uploading subsystem, variable subsystem, downloading subsystem, and file subsystem. So I developed one page per subsystem. The four pages are:
Upload Data page Download Data page Variable Manager page File manager page
Briefly, I used HTML, CSS, and JavaScript designing the user interface. And I took advantage of Bootstrap for decorating those components and arranging layout. Some JavaScript plug-ins were used for specific design like the variable tree and data table. For each page, I will describe the components and the reason for design.
Upload Data page:
This page has four panels – ‘set category’ panel, ‘upload file’ panel, ‘add category’ panel, and ‘delete category’ panel (Figure 19). The top two panels serve for uploading
data, and the bottom two are combined to be category manager.
by clicking once in the first panel, rather than doing another click on the main menu. Moreover, if a user is unsatisfied with the change after checking the lists in ‘Upload Data’ page, they need extra clicks back to category manager of another page. Values of
categories are presented in a drop-down list, which is according to user requirements. In ‘Upload File’ panel there is a bar of prompt. The system will tell users about the status of uploading, which is described in the “use case 3” of “uploading subsystem”. Figure 19 is a screenshot of ‘Upload Data’ page.
Figure 19
Download Data page:
name, or they can check any attribute in a group. The data in terms of the attributes will be presented in ‘Data Panel’, since users would feel more confident if they are able to preview the data before downloading. Furthermore, the ‘Data Panel’ has provided
search function to help users do simple retrieval. Figure 20 is the screenshot of ‘Download Data’ page.
Figure 20
File Manager page:
relevant function. Figure 21 is a screenshot of the ‘File Manager’ page
Figure 21
Variables Manager page:
NOTES: 1dataTables: https://datatables.net/
The main operation is creating a new group. When users click the ‘Create Group’ button,
some other components like selecting studies and attributes will show under the button, which is described in the use case 1 of variable subsystem. Figure 22 is a screenshot of ‘Variables Manage’ page.
4.
Usability Testing
“Usability testing is a technique used in user-centered interaction design to evaluate a
product by testing it on users. Usability testing focuses on measuring a human-made product's capacity to meet its intended purpose.” (Usability testing, 2017, section 1) Usability testing and requirement analysis are two important processes of interacting with users in system lifecycle. Requirement analysis makes sure that a system is able to satisfy users’ requirements. In other words, it makes system design stay in the right direction.
Usability testing evaluates how well a system satisfies users’ requirements and how easily users can accomplish their goals with the system. With feedback from usability testing, a developer could fix some bugs in the system and improve its design or implementation.
Therefore, I designed a usability test plan to evaluate the database management system. The evaluation plan is mainly based on observing participants doing tasks and gathering feedback from them after using the system. In this section, I will present tasks which could be used in observation and questionnaires which could be used to get feedback after each task.
participants are suggested to act as Tracy and complete each task. After each task they would be provided a questionnaire which asks about their experience about using the system.
In conclusion, the main purpose of this usability testing is to evaluate four quality components:
Learnability: How easy is it for users to accomplish basic tasks the first time they
encounter the design?
Efficiency: Once users have learned the design, how quickly can they perform tasks? Errors: How many errors do users make, how severe are these errors, and how easily
can they recover from the errors?
Satisfaction: How satisfied are users after using the design?
4.1 Tasks
Background: Tracy has a new research study and has collected two sets of data. The data is stored in two Excel spreadsheets. Both of them are in the same and valid format ready to be uploaded. All the records are uniquely identified by SID. And these two datasets have some common and some different attributes.
Now, Tracy needs to upload the two datasets to the system and do some managing jobs. Imagine you are Tracy, please complete a few tasks.
Task1:
Please add this new study and its attributes to categories. The information of the study is:
Study name: sport injury Age level: 18 – 25 Sport: football
Primary investigator: Tracy Funding source: Max
Task2:
Given the two Excel spreadsheets, please upload them to the directory of the target study.
Task3:
again in the future, please create a variable group of these combined svariables.
The information for the group is:
Group name: test group
Variables: SID, sport, protocol, administrator, psychomotor_speed_domain_ss,
complex_attention_domain_raw
Task4:
Now, please download the data based on the variable group. The Target directory is the directory for current study.
The information for the downloaded Excel spreadsheet is:
Name: test part
Task5:
For some reason, you may want to delete dataA.xlsx from the server and rename dataB.xlsx to uniqueFile.xlsx. Please complete this task in the File Manager.
4.2 Questionnaire
fourteen questions in total, including twelve rating questions and two open questions. (Lund, 2001)
Rating questions:
1. I think it was easy to complete this task.
2. I think most people would learn to complete this task quickly.
3. I felt very confident in completing this task.
4. I needed to learn a lot before I could complete this task.
5. I think the error message was useful.
6. I think the organization of components was clear.
7. I think input prompts were clear.
8. I think I can use it successfully every time.
9. It makes the task I want to complete easier.
10. It works the way I want it to work.
11. I think the task was completed efficiently.
12. The support information (instruction, messages) helped me a lot for completing the task.
1. Did you encounter any problems or difficulties with the system? If so, please describe.
5.
Conclusion
This project developed a database management system for Gfeller data center of UNC to manage research data. The system allows users to merge data according to studies and download part of the data for further research. There are four main functions which are uploading Excel spreadsheets, downloading data stored in Excel spreadsheets, managing attributes group for data downloading, and managing uploaded files in server.
The project has been through requirements analysis, use case analysis, and system implementation. The requirements gathering phase uses iterative interviews. The use case analysis splits the system into four subsystems and analyzes their use cases. Then based on each use case, the project develops related functions and combines functions into several modules. Finally, those modules are can be viewed as components of pages and allocated to several web pages.
The main future work for this system could be functionality extension. As the
research of the users goes on, they may need other advanced functionalities. For instance, the current system allow users to download data based on attributes group, and the
References
Delone, W. H., & McLean, E. R. (2003). The DeLone and McLean model of information systems success: a ten-year update. Journal of management information systems, 19(4), 9-30.
Holzinger, A. (2005). Usability engineering methods for software developers.
Communications of the ACM, 48(1), 71-74.
Hamilton, S., & Chervany, N. L. (1981). Evaluating information system effectiveness-Part I: Comparing evaluation approaches. MIS quarterly, 5(3), 55-69.
Lund, A.M. (2001) Measuring Usability with the USE Questionnaire. STC Usability SIG Newsletter, 8:2.
Mifsud, J. (2013). Requirements Gathering: A Step By Step Approach For A Better User Experience (Part 1). Retrieved February 10, 2017, from
http://usabilitygeek.com/requirements-gathering-user-experience-pt1/
Usability testing. (n.d.). In Wikipedia. Retrieved February 10, 2017, from https://en.wikipedia.org/wiki/Usability_testing
Rouse, M. (2015). database management system (DBMS). Retrieved from http://searchsqlserver.techtarget.com/definition/database-management-system
Rouse, M. (2007). requirements analysis (requirements engineering). Retrieved from http://searchsoftwarequality.techtarget.com/definition/requirements-analysis
Vatrapu, R., Suthers, D., & Medina, R. (2008). Usability, sociability, and learnability: A CSCL design evaluation framework. International Conference on Computers in
Education (ICCE 2008), (CD-ROM).