Tobacco Marketing at SNAP and
WIC Stores in the Contiguous U.S.
Implications for Policy and Practice
Shauna Rust
Undergraduate Honors Thesis
Department of Health Policy and Management Gillings School of Global Public Health University of North Carolina at Chapel Hill
2015-2016
Advisors:
Dr. Kurt M. Ribisl Professor
Department of Health Behavior
Gillings School of Global Public Health University of North Carolina at Chapel Hill Dr. Karl Umble
Director, Bachelor of Science in Public Health Program Department of Health Policy and Management
Abstract
In the U.S., low-income and racial/ethnic minority families are at increased risk for food insecurity and often rely on government programs such as SNAP and WIC for food assistance. Many food retailers that accept SNAP and/or WIC also commonly promote and sell tobacco, which remains the leading cause of preventable death in the U.S. Given the influence of the retail environment on smoking and tobacco use, this study examined the presence of tobacco
marketing in stores that millions of American families frequent for food purchases via SNAP and WIC. Data was obtained from a nationally representative sample of tobacco retailers (N = 2,305) in the contiguous U.S. Bivariate and multivariate logistic regression models were used to assess the association between tobacco marketing types, WIC acceptance, SNAP acceptance,
neighborhood demographics, and store type. When controlling for demographics, retailers accepting SNAP were significantly more likely to have interior tobacco advertisements (odds ratio = 2.55, 95% confidence interval [1.89, 3.46], p < .0001) and price promotions (odds ratio = 2.19, 95% confidence interval [1.75, 2.74], p < .0001), while stores accepting WIC were
significantly less likely to have any type of tobacco marketing, such as exterior tobacco
Background
More than 46.7 million Americans (14.8%) live in poverty, with household income below the federal threshold (DeNavas-Walt & Proctor, 2015). Income is a known predictor of health status and contributes to health disparities; lower-income Americanshave lower life expectancies (Sabanayagam & Shankar, 2012) and a higher disease burden (Muennig, Franks, Jia, Lubetkin, & Gold, 2005). Furthermore, racial and ethnic minorities in the U.S. experience poverty at rates disproportionate to white Americans (Macartney, Bishaw, & Fontenot, 2013), and are subject to worse health outcomes due to many factors including racial discrimination (Williams &
Mohammed, 2009). Low-income and racial/ethnic minority families are also at increased risk for food insecurity (Coleman-Jensen, Rabbitt, Gregory, & Singh, 2015), which is defined by the U.S. Department of Agriculture (USDA) as “a household-level economic and social condition of limited or uncertain access to adequate food” (U.S. Department of Agriculture, 2015a).
Government programs, such as SNAP (Supplemental Nutrition Assistance Program) and WIC (Special Supplemental Nutrition Program for Women, Infants, and Children), provide food aid to more than 45 million low-income Americans (U.S. Department of Agriculture, 2015c) and 8 million low-income women, infants and children, respectively (U.S. Department of
SNAP and/or WIC food assistance programs, and parents and families regularly shop at them, there is a need to investigate how unhealthy products, namely tobacco, are promoted in the retail environment (Hillier et al., 2015).
Tobacco use remains the leading cause of death in the U.S., causing over 480,000 deaths and $289 billion in economic costs annually, and disproportionately affects low-income and minority populations (U.S. Department of Health and Human Services, 2014). Since tobacco companies can no longer promote their deadly products via traditional media outlets including television, radio, or billboards, the tobacco industry is increasingly utilizing marketing within the retail store – also known as the “point of sale” or POS (Centers for Disease Control and
Prevention, 2014; Wakefield et al., 2002). Currently, tobacco companies spend more money at the POS than in any other venue, amounting to nearly $23 million each day – about $1 million per hour – to advertise, market, and promote their products (Federal Trade Commission, 2013; Feighery, Ribisl, Clark, & Haladjian, 2003).
Communities with more black, Hispanic, or low-income residents have a higher than average density of tobacco retailers (Rodriguez, Carlos, Adachi-Mejia, Berke, & Sargent, 2013), which results in a greater amount of tobacco marketing (Lee, Henriksen, Rose,
Furthermore, price promotions at the POS greatly appeal to youth (Robertson, Cameron, McGee, Marsh, & Hoek, 2016; White, White, Freeman, Gilpin, & Pierce, 2006), and youth smoking rates are higher in communities with more tobacco retailers and advertising (Henriksen et al., 2008). If current trends persist, 5.6 million children alive today in the U.S. will die
prematurely from tobacco use (U.S. Department of Health and Human Services, 2014). Food insecurity may exacerbate tobacco use rates among youth from low socioeconomic status (SES) households. Young adults who are food-insecure are more likely to be daily cigarette smokers, with some using the product because nicotine acts as an appetite suppressant and/or eases stress (Kim & Tsoh, 2016). Given the influence of the retail environment on smoking and tobacco use, it is important to consider the presence of tobacco marketing in stores that millions of low-income American families frequent for food purchases via SNAP and WIC.
Two previous studies have focused on the link between tobacco advertisements and SNAP/WIC retailers, but have produced conflicting findings. First, a study by Hosler & Kammer (2012) looked at youth tobacco access violations and in-store tobacco advertisements at 117 food stores in Albany, NY. Hosler found that SNAP retailers were significantly less likely to have interior tobacco advertisements, as compared to non-SNAP retailers. However, retailers in minority neighborhoods were significantly more likely to have interior tobacco advertisements, as compared to retailers in non-minority neighborhoods. Due to small sample size, WIC stores had no significant association with tobacco advertising, although all WIC retailers in the sample sold tobacco (Hosler & Kammer, 2012).
WIC retailers were significantly more likely to have interior and exterior tobacco advertisements, as compared to non-SNAP and non-WIC retailers. In addition, exterior tobacco advertisements were more likely to be found in black neighborhoods and in low-income neighborhoods, as compared to non-black and higher-income neighborhoods (Hillier et al., 2015).
Conflicting results between these two studies may be due to the sampling frame, environmental context, and other factors. The Hosler study sampled food retailers, whereas the Hillier study sampled tobacco retailers. The proportion of stores accepting WIC and/or SNAP could differ based on how the retailers were sampled, with food retailers being more likely to participate in government food assistance programs, such as WIC and SNAP. Furthermore, the Hosler study surveyed food retailers selling tobacco products in downtown Albany, New York, while the Hillier study assessed tobacco advertising in Philadelphia, Pennsylvania. Differences in the retail environment could be a factor in these studies. Philadelphia is home to over 1.5 million residents, while Albany has a population of roughly 98,000 people.
Methods
Data Set and Sampling
Data for this study came from the Advancing Science and Policy in the Retail Environment (ASPiRE) project and was collected in 2015. Funded by the National Cancer Institute’s State and Community Tobacco Control Initiative, ASPiRE is a consortium of researchers from the Stanford Prevention Research Center, the University of North Carolina at Chapel Hill, and Washington University in St. Louis.
To obtain data from a nationally representative sample of retailers in the 48 states of the contiguous U.S., we used a two-stage probability proportionate to population size (PPS)
sampling design. In the first stage, we randomly selected 100 counties with replacement, using 2010 Census data and the PPS method (Chromy, 1979). With the probability of selection proportional to each county’s population, 97 unique counties were selected.
Next, we randomly selected tobacco retailers within each county. The second stage of the PPS sampling process yields probabilities of selecting retailers in initially selected urban
counties substantially lower than in rural counties, resulting in a nationally representative sample of retailers (Rose et al., 2014). Since there is no nationwide licensing system for tobacco retailers in the United States, we purchased retailer lists from two commercial sources: ReferenceUSA and Dun & Bradstreet (D&B). Previous research found that 90% of tobacco outlets in a given area could be identified using the combination of these two data sources (D'Angelo,
Fleischhacker, Rose, & Ribisl, 2014). We selected the 10 retailer types representing 98% of tobacco sales in the U.S., using the 2007 Census of Retail Trade (D'Angelo et al., 2014).
phone-verification. To verify eligibility for the study, research assistants called stores to confirm addresses and the sale of cigarettes. A store was deemed ineligible if cigarettes were not sold, or if the store could not be reached after three attempts by phone.
Of the randomly selected, phone-verified stores, we selected the first 24 eligible stores per county, or all eligible stores if fewer, for in-person audits. The final sample for 2012 had 2346 stores. These stores were followed over time and audited every 1.5 years from 2012 to 2015, resulting in three waves of data collection. Between waves, 155 discount/dollar stores (e.g. Family Dollar, Dollar General) known to sell tobacco were added to the sample in 2014, and 90 CVS pharmacy stores were removed in 2015 after the company decided to stop tobacco sales. For this study, we collected and analyzed data from the 2015 sample of 2305 tobacco retailers.
Data Collection
We completed interior and exterior audits for 2126 retailers out of 2305 sampled stores in the study. Four audits were lost due to iSurvey technical error. In addition, 135 stores were deemed ineligible because they did not sell tobacco or were out of business. The remaining 40 store audits could not be completed due to clerk refusals, construction, temporary closures, or could not be located at the address listed.
Measures
This study collected information on tobacco product marketing, price promotions, and store characteristics. Store location was linked with community demographics, including race/ethnicity and socioeconomic status (SES).
Tobacco Marketing Materials. On the exterior of the store (e.g. windows, doors, sidewalk, building, parking lot), data collectors coded yes/no for the presence of branded tobacco advertising on any surface. For an advertisement to be “branded,” it must be a professional advertisement that is distinguishably representative of a tobacco company brand, and cannot be handwritten. On the interior of the store, data collectors coded yes/no for the presence of branded tobacco advertisements, signs, displays, and functional items. For both the interior and exterior of the store, data collectors indicated the product type associated with each marketing material. Product types included non-menthol cigarettes, menthol cigarettes, cigarillos/little cigars, large cigars, chew/snuff/dip/snus, and e-cigarettes.
Tobacco Price Promotions. Data collectors coded price promotions on both the exterior and interior of the store. Types of price promotions included special price (e.g. $1.00 discount per pack) or multi-buy special (e.g. buy 1 pack, get 1 pack free). Price promotion data was collected for cigarettes, e-cigarettes, and non-cigarette tobacco products.
SNAP and WIC Participation. Data collectors also assessed whether or not each retailer accepted WIC and/or SNAP. The data collectors were instructed to look for signage around the store indicating participation in the WIC and/or SNAP program. If no signage was present, data collectors were instructed to ask the clerk. In 3.8% of stores (n = 81), there was no signage and the clerk either refused to answer whether or not WIC was accepted or did not know. In 3.5% of stores (n = 74), there was no signage and the clerk either refused to answer whether or not SNAP was accepted or did not know.
Retailer Neighborhood Demographics. Retailer neighborhood was defined by the census tract location of each retailer. Data from the American Community Survey 5-year estimates, 2010– 2014 was used to assess the racial/ethnic composition, socioeconomic characteristics, and age levels of each census tract. Four variables provided demographic information for each retailer neighborhood: percent non-Hispanic Black residents, percent Hispanic residents, percent below federal poverty level (FPL), and percent under 18 years old.
Statistical Analysis
Descriptive information for the sample was compiled from all retailers in the sample. Then, I created bivariate regression models to assess the association between retailer tobacco marketing (e.g. exterior tobacco advertisements) and each store-level (e.g. store type,
marketing (the primary outcome) based on a predictor variable such as store type, WIC or SNAP acceptance, or neighborhood demographics (Hosmer, Lemeshow, & Sturdivant, 2013). Next, I used multivariate regression models to analyze the association between tobacco marketing types and store and neighborhood characteristics. The multivariate model predicted the presence of tobacco marketing while controlling for SNAP and WIC acceptance and neighborhood
demographics. Logistic regression models were used to model conditional probabilities since the dependent variables are dichotomous, rather than continuous (Hosmer et al., 2013).
Results
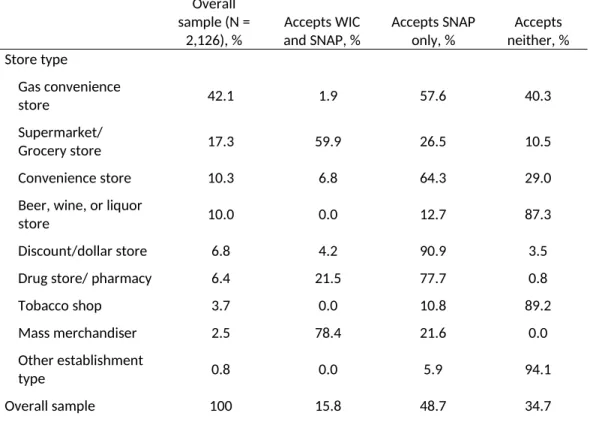
Of the 2,126 completed store audits in a nationally representative sample of tobacco retailers, SNAP was accepted at 64.7% of retailers, while WIC was accepted at only 16.5% of retailers (Table 1). Because WIC has stricter food stocking requirements than SNAP, most WIC-authorized retailers (95.6%) are also licensed to accept SNAP, but only 58.4% of SNAP retailers also accept WIC. Mass merchandisers (78.4%) and grocery stores/supermarkets (63.0%) were the retail types that most commonly accepted WIC benefits, whereas mass merchandisers (100.0%), drugstores/pharmacies (99.2%), and discount/dollar stores (95.1%) most commonly accepted SNAP benefits (Figure 1).
tobacco products placed within 12 inches of products targeted to children (e.g. candy,
soda/slushy machines, toys). The demographics of the retailer neighborhoods in our nationally representative sample were 13.0% black, non-Hispanic; 17.7% Hispanic; 13.3% under the federal poverty level (FPL); and 22.8% under 18 years old.
The bivariate logistic regression models showed significant associations between many of the dependent variables (tobacco marketing types) and independent variables (store and
neighborhood characteristics) (Table 2). For instance, exterior tobacco advertisements were more likely to be found at discount/dollar stores (OR = 9.86, 95% CI [5.30, 18.35], p<0.0001) than at any other store type, and were also most likely to be located at retailers in neighborhoods with more black residents (OR = 5.05, 95% CI [3.02, 8.45], p<0.0001) or more residents living in poverty (OR = 6.35, 95% CI [2.86, 14.12], p<0.0001). Tobacco shops (OR = 6.02, 95% CI [1.47, 24.67], p<0.013) and gas convenience stores (OR = 5.12, 95% CI [3.65, 7.19], p<0.0001) were the most likely store types to have interior tobacco advertisements, which were also more likely to be located in communities with more black residents (OR = 4.37, 95% CI [1.89, 10.14], p<0.001).
Of all store types, drug stores/pharmacies (OR = 11.55, 95% CI [4.25, 31.40], p<0.0001) were most likely to have interior tobacco price promotions. SNAP retailers were also
In the multivariate logistic regression model, WIC acceptance was significantly and negatively correlated with all four dependent variables, when controlling for neighborhood-level characteristics (e.g. race/ethnicity, poverty, age) (Table 3). Retailers accepting WIC were
significantly less likely to have any type of tobacco marketing or price promotions, with the lowest odds for exterior tobacco advertisements (OR = 0.06, 95% CI [0.04, 0.09], p<0.0001). However, when controlling for neighborhood characteristics, SNAP acceptance was significantly and positively correlated with two of the dependent variables, and was not significant for the remaining two variables. In the multivariate model, SNAP retailers were more likely to have interior tobacco advertisements (OR = 2.55, 95% CI [1.89, 3.46], p<0.0001) and interior tobacco price promotions (OR = 2.19, 95% CI [1.75, 2.74], p<0.0001).
When controlling for neighborhood characteristics in the multivariate model,
Discussion
In our nationally representative study of tobacco retailers in the contiguous U.S., WIC retailers were significantly less likely to have any type of tobacco marketing while SNAP retailers were significantly more likely to have interior tobacco advertisements and price promotions, even when controlling for neighborhood-level characteristics. Racial and socioeconomic disparities in tobacco marketing were also present. Communities with higher proportions of black residents were significantly more likely to have retailers with exterior tobacco advertising and tobacco product placement near children’s products, and communities with more residents in poverty were significantly more likely to have exterior tobacco
advertising.
My findings are somewhat consistent with a study by Hillier et al. (2015), which examined the relationship between tobacco advertising and SNAP/WIC acceptance at tobacco retailers in Philadelphia, PA. While I found similar associations between tobacco advertising and SNAP acceptance, neighborhood race/ethnicity, and neighborhood poverty levels, one key difference was WIC acceptance. Hillier found that WIC retailers were significantly more likely to have both exterior and interior tobacco advertisements, while I found that WIC retailers were significantly less likely to have exterior and interior tobacco advertisements – or any form of tobacco marketing (Hillier et al., 2015).
This contrast in findings may be the result of a difference in sampling frame and retail environment. Hillier used a population of all licensed tobacco retail outlets (TROs) in
and tobacco shops. Our study also contained mass merchandisers, which were not included in the Philadelphia study. The Hillier study contained a high proportion of restaurant/take-out stores, which were less likely to have tobacco advertising than other store types. Our study did not contain any restaurant/take-out retailers. Furthermore, the Hillier study likely contained a higher proportion of corner stores than our study, and also included bars, check-cashing stores, and laundromats, which were not included in our study (Hillier et al., 2015).
These differences in store type composition of the sample may have significant effects on the relationship between SNAP and WIC acceptance and tobacco marketing, due to the heavy influence of store type on a retailer’s likelihood of accepting SNAP and/or WIC. For example, the three store types that most commonly accepted WIC in our study – mass merchandisers, grocery stores/supermarkets, and drug stores/pharmacies – had below average rates of exterior and interior tobacco advertisements. While WIC acceptance was largely limited to a few store types, SNAP was accepted at a higher proportion and variety of retailers, including
discount/dollar stores, gas convenience stores, and other convenience stores.
There are several policy and programmatic approaches available to create healthier retail environments, especially through limiting tobacco availability and marketing and offering healthier food products. First, tobacco retailer licensing is widely regarded as a key policy for reducing tobacco retailer density, product availability, and marketing. State and local
These policy options could be used to mitigate exposure to tobacco marketing at a variety of stores, including SNAP and WIC retailers.
While over 261,000 retailers in the U.S. accept SNAP benefits (U.S. Department of Agriculture, 2015b), many stores lack a variety of fruits, vegetables, and other healthy products (Laska, Caspi, Pelletier, Friebur, & Harnack, 2015). Healthy retailer licensing is a policy option that aims to increase healthy food availability in stores, as well as limit the marketing and availability of tobacco and alcohol products. Cities can enact a licensing ordinance for food retailers (excluding restaurants) to carry a minimum selection of healthy food products. In addition, retailers receive incentives for exceeding food-stocking requirements, limiting the sale of sugar-sweetened beverages, and limiting or eliminating the sale of alcohol and tobacco products. Minneapolis was the first city in the U.S. to regulate nutritional requirements in food stores (ChangeLab Solutions, 2013). Some localities, like California, have created voluntary healthy retail environment programs, focusing on marketing and availability of food, tobacco, and alcohol in community stores (Healthy Stores for a Healthy Community, 2014). Healthy retailer licensing and healthy retail campaigns have the potential to address the top preventable causes of death in our nation – tobacco use and obesity – while also ameliorating food deserts. However, when working to reduce tobacco product availability in stores, policymakers and public health officials should ensure that unhealthy products, such as sugary snacks and candy, do not take their place (Ribisl et al., 2016).
pharmacies heavily promote tobacco and unhealthy food items, such as candy and sugar-sweetened beverages (Whitehouse, Simon, French, & Wolfson, 2012). Our study found that pharmacies and drug stores were significantly more likely to offer tobacco price promotions, as compared to non-pharmacies. Due to the conflict of interest present in selling tobacco at
pharmacies and drug stores, policymakers should consider adopting local or state-level tobacco-free pharmacy policies. Many localities in Massachusetts and California have banned tobacco sales in pharmacies, which has reduced tobacco retailer density in these communities (Jin et al., 2016). Some retail pharmacies, such as CVS, have taken voluntary action to end tobacco sales in order to better align with their mission of improving health, and to take advantage of benefits resulting from the Affordable Care Act (ACA) (Lopez-Trigo, Khanfar, Alameddine, & Harrington, 2015).
Limitations
The lack of a nationwide tobacco retailer licensing system is a limitation for the methods of this study, which uses store lists purchased from two commercial sources to identify tobacco retailers. Since there is no universal system for identifying tobacco retailers, some stores may have been overlooked in the sampling process. Furthermore, while this study is representative of tobacco retailers at the national level, it is not a nationally representative sample of WIC or SNAP, which may influence our findings. In addition, this study is only representative of the contiguous U.S., and the results cannot be generalized to the local level (i.e.: states, cities), and Alaska and Hawaii are not represented in these findings. Lastly, this study looks solely at retailer and neighborhood characteristics and is not linked to individual behavioral data, so an
Conclusion
Overall, SNAP acceptance was significantly associated with increased interior tobacco marketing, while WIC acceptance was significantly associated with decreased tobacco marketing of all types, when controlling for neighborhood race/ethnicity, SES, and age. In addition, some disparities in tobacco marketing exist for race/ethnicity and socioeconomic status. Policy options for creating healthier retail environments include tobacco retailer licensing, healthy retailer licensing, and pharmacy tobacco sales bans. In particular, efforts should be made to improve healthy food availability and limit tobacco marketing in SNAP stores across the U.S. Further research is needed to assess the effects of tobacco marketing exposure on SNAP and WIC participants, as well as the best policy options for reducing tobacco product availability in stores frequented by millions of families for SNAP and WIC food purchases.
Acknowledgments
Department of Health Policy and Management for providing me with a wonderful support system and learning environment.
Declaration of Conflicting Interests
None
Funding
Funded by grant number U01 CA154281 from the National Cancer Institute at the National Institutes of Health as part of the ASPiRE study (Advancing Science and Policy in the Retail Environment).
IRB Approval
Table 1. Store Characteristics of Tobacco Retailers by Type of Tobacco Marketing, Continental U.S., 2015.
Overall sample (N = 2,126), %
Outlets with exterior advertisements , % Outlets with interior advertisements, % Outlets with interior price promotions, % Outlets with tobacco near children’s products, % Store type Gas convenience
store 42.1 78.4 95.3 87.5 37.4
Supermarket/
Grocery store 17.3 18.7 71.4 62.7 13.0
Convenience store 10.3 72.3 88.4 74.8 30.4
Beer, wine, or liquor
store 10.0 42.5 69.6 44.4 23.4
Discount/dollar
store 6.8 92.4 94.5 60.4 4.2
Drug store/
pharmacy 6.4 1.5 80.9 97.1 2.9
Tobacco shop 3.7 85.0 97.4 85.5 30.3
Mass merchandiser 2.5 1.9 81.1 73.6 11.3
Other establishment
type 0.8 50.0 72.2 50.0 22.2
Total 100 58.0 86.4 75.5 25.6
WIC accepted
Yes 16.5 12.5 77.5 74.3 11.0
No 83.5 66.8 88.8 75.9 28.8
SNAP accepted
Yes 64.7 55.2 89.3 80.2 23.4
No 35.3 62.8 82.6 67.6 30.2
Table 1a. SNAP and WIC Acceptance by Tobacco Retailer Store Type, Continental U.S., 2015.
Overall sample (N =
2,126), %
Accepts WIC and SNAP, %
Accepts SNAP only, %
Accepts neither, % Store type
Gas convenience
store 42.1 1.9 57.6 40.3
Supermarket/
Grocery store 17.3 59.9 26.5 10.5
Convenience store 10.3 6.8 64.3 29.0
Beer, wine, or liquor
store 10.0 0.0 12.7 87.3
Discount/dollar store 6.8 4.2 90.9 3.5
Drug store/ pharmacy 6.4 21.5 77.7 0.8
Tobacco shop 3.7 0.0 10.8 89.2
Mass merchandiser 2.5 78.4 21.6 0.0
Other establishment
type 0.8 0.0 5.9 94.1
Overall sample 100 15.8 48.7 34.7
Note. WIC (Special Supplemental Nutrition Program for Women, Infants, and Children); SNAP (Supplemental Nutrition Assistance Program).
Drug stor e/Ph armac y Disc ount/ Dolla r Stor
e
Groc ery S
tore/ Supe rmark et Conv enien
ce St ore
Gas C onve
nienc e Stor
e
Beer, Wine
, or L iquor
Stor e
Toba cco S
hop
Othe r Stor
e Typ e 0% 10% 20% 30% 40% 50% 60% 70% 80% 90% 100% 21% 6% 63% 7% 2%
0% 0% 0%
99% 95% 87% 71% 60% 15% 11% 6%
WIC and SNAP Acceptance by Store Type
Table 2. Bivariate Logistic Regression Models of Presence of Tobacco Marketing by Tobacco Retailer Store Characteristics and Neighborhood Characteristics, Continental U.S., 2015.
Exterior advertisements, OR [95% CI] Interior advertisements, OR [95% CI] Interior price promotions, OR [95% CI]
Tobacco products near children’s products, OR
[95% CI] Store type
Gas convenience
store 4.80 [3.95, 5.84]* 5.12 [3.65, 7.19]* 3.47 [2.76, 4.38]* 2.96 [2.42, 3.62]*
Supermarket/
Grocery store 0.12 [0.09, 0.15]* 0.29 [0.22, 0.38]* 0.47 [0.37, 0.59]* 0.38 [0.28, 0.53]*
Convenience store 2.02 [1.48, 2.75]* 1.22 [0.79, 1.89] 0.95 [0.69, 1.32] 1.31 [0.96, 1.78]
Beer, wine, or liquor
store 0.50 [0.38, 0.67]* 0.30 [0.22, 0.42]* 0.21 [0.16, 0.28]* 0.88 [0.63, 1.22]
Discount/dollar
store 9.86 [5.30, 18.35]* 2.85 [1.38, 5.88]* 0.46 [0.32, 0.65]* 0.12 [0.05, 0.27]*
Drug store/
pharmacy 0.01 [0.00, 0.04]* 0.64 [0.41, 1.01] 11.55 [4.25, 31.40]* 0.08 [0.03, 0.22]*
Mass merchandiser 0.01 [0.00, 0.10]* 0.67 [0.33, 1.35] 0.90 [0.48, 1.67] 0.37 [0.16, 0.86]*
Tobacco shop 4.29 [2.31, 7.97]* 6.02 [1.47, 24.67]* 1.95 [1.02, 3.73]* 1.28 [0.77, 2.10]
Other establishment
type 0.72 [0.29, 1.83] 0.40 [0.14, 1.14] 0.32 [0.13, 0.81}* 0.83 [0.27, 2.54]
Accepts WIC 0.07 [0.05, 0.10]* 0.44 [0.32, 0.59]* 0.92 [0.70, 1.21] 0.31[0.21, 0.44]*
Accepts SNAP 0.74 [0.61, 0.89]* 1.76 [1.36, 2.28]* 1.94 [1.58, 2.39]* 0.71 [0.58, 0.87]*
Retailer neighborhood characteristics
% Black population 5.05 [3.02, 8.45]* 4.37 [1.89, 10.14]* 1.42 [0.83, 2.43] 2.02 [1.26, 3.25]*
% Hispanic
population 0.82 [0.56, 1.20] 0.36 [0.22, 0.59]* 0.44 [0.29, 0.67]* 0.68 [0.43, 1.07]
% in povertya
6.35 [2.86, 14.12]* 1.43 [0.46, 4.37] 0.51 [0.22, 1.21] 1.55 [0.66, 3.63] % Youthb population
1.69 [0.41, 6.95] 0.80 [0.10, 6.20] 1.82 [0.36, 9.28] 0.77 [0.16, 3.80]
Note. OR = odds ratio. CI = confidence interval. WIC (Special Supplemental Nutrition Program for Women, Infants, and Children). SNAP (Supplemental Nutrition Assistance Program).
*p < 0.5
Table 3. Multivariate Logistic Regression Results for Presence of Tobacco Marketing by Tobacco Retailer Store Characteristics and Neighborhood Characteristics, Continental U.S., 2015.
Exterior advertisements, OR (95% CI)
Interior advertisements, OR (95% CI)
Interior price promotions, OR
(95% CI)
Tobacco products near children’s products, OR
(95% CI) Accepts WIC 0.06 [0.04, 0.09]* 0.28 [0.20, 0.39]* 0.64 [0.48, 0.86]* 0.32 [0.22, 0.46]*
Accepts SNAP 1.18 [0.96, 1.45] 2.55 [1.89, 3.46]* 2.19 [1.75, 2.74]* 0.83 [0.67, 1.03]
% Black population 3.81 [1.94, 7.47]* 2.63 [0.96, 7.19] 1.09 [0.56, 2.10] 1.85 [1.01, 3.38]*
% Hispanic
population 0.59 [0.35, 1.00] 0.30 [0.15, 0.58]* 0.40 [0.23, 0.68]* 0.75 [0.43, 1.31]
% in povertya
4.13 [1.26, 13.52]* 2.12 [0.42, 10.63] 0.62 [0.19, 2.03] 1.31 [0.41, 4.21] % Youthb
population 1.11 [0.19, 6.47] 0.71 [0.06, 7.82] 4.89 [0.79, 30.21] 0.81 [0.13, 4.85]
Note. OR = odds ratio. CI = confidence interval. WIC (Special Supplemental Nutrition Program for Women, Infants, and Children). SNAP (Supplemental Nutrition Assistance Program).
*p < 0.5
References
Caspi, C. E., Pelletier, J. E., Harnack, L., Erickson, D. J., & Laska, M. N. (2016). Differences in healthy food supply and stocking practices between small grocery stores, gas-marts, pharmacies and dollar stores. Public Health Nutr, 19(3), 540-547. doi:10.1017/S1368980015002724
Centers for Disease Control and Prevention. (2014). Best Practices for Comprehensive Tobacco Control Programs—2014. Atlanta (GA): U.S. Department of Health and Human Services, Centers for Disease Control and Prevention, National Center for Chronic Disease Prevention and Health Promotion, Office on Smoking and Health.
ChangeLab Solutions. (2013). Licensing for Lettuce: A Guide to the Model Licensing Ordinance for Healthy Food Retailers. Retrieved from
http://www.changelabsolutions.org/sites/default/files/Licensing_for_Lettuce_FINAL_20130212_0.pdf Chromy, J. R. (1979). Sequential Sample Selection Methods. Paper presented at the American Statistical
Association.
Coleman-Jensen, A., Rabbitt, M. P., Gregory, C., & Singh, A. (2015). Household Food Security in the United States in 2014. (194). U.S. Department of Agriculture, Economic Research Service.
D'Angelo, H., Fleischhacker, S., Rose, S. W., & Ribisl, K. M. (2014). Field validation of secondary data sources for enumerating retail tobacco outlets in a state without tobacco outlet licensing. Health Place, 28, 38-44. doi:10.1016/j.healthplace.2014.03.006
DeNavas-Walt, C., & Proctor, B. D. (2015). Income and Poverty in the United States: 2014. (P60-252). Washington, DC: Census Bureau.
Federal Trade Commission. (2013). Federal Trade Commission Cigarette Report for 2011. Washington, DC: Federal Trade Commission.
Feighery, E. C., Ribisl, K. M., Clark, P. I., & Haladjian, H. H. (2003). How tobacco companies ensure prime placement of their advertising and products in stores: interviews with retailers about tobacco company incentive programmes. Tob Control, 12(2), 184-188.
Feld, A. L., Johnson, T. O., Byerly, K. W., & Ribisl, K. M. (2016). How to Conduct Store Observations of Tobacco Marketing and Products. Prev Chronic Dis, 13, E25. doi:10.5888/pcd13.150504
Germain, D., McCarthy, M., & Wakefield, M. (2010). Smoker sensitivity to retail tobacco displays and quitting: a cohort study. Addiction, 105(1), 159-163. doi:10.1111/j.1360-0443.2009.02714.x
Healthy Stores for a Healthy Community. (2014). Healthy Stores for a Healthy Community. Retrieved from http://www.healthystoreshealthycommunity.com
Henriksen, L., Feighery, E. C., Schleicher, N. C., Cowling, D. W., Kline, R. S., & Fortmann, S. P. (2008). Is adolescent smoking related to the density and proximity of tobacco outlets and retail cigarette
advertising near schools? Prev Med, 47(2), 210-214. doi:10.1016/j.ypmed.2008.04.008
Henriksen, L., Schleicher, N. C., Feighery, E. C., & Fortmann, S. P. (2010). A longitudinal study of exposure to retail cigarette advertising and smoking initiation. Pediatrics, 126(2), 232-238. doi:10.1542/peds.2009-3021
Hillier, A., Chilton, M., Zhao, Q. W., Szymkowiak, D., Coffman, R., & Mallya, G. (2015). Concentration of tobacco advertisements at SNAP and WIC stores, Philadelphia, Pennsylvania, 2012. Prev Chronic Dis, 12, E15. doi:10.5888/pcd12.140133
Hoek, J., Gifford, H., Pirikahu, G., Thomson, G., & Edwards, R. (2010). How do tobacco retail displays affect cessation attempts? Findings from a qualitative study. Tob Control, 19(4), 334-337.
doi:10.1136/tc.2009.031203
Hosler, A. S., & Kammer, J. R. (2012). Point-of-purchase tobacco access and advertisement in food stores. Tob Control, 21(4), 451-452. doi:10.1136/tobaccocontrol-2011-050221
Hosmer, D. W., Lemeshow, S., & Sturdivant, R. X. (2013). Applied logistic regressionWiley series in probability and statistics (pp. 1 online resource (xvi, 500 p.) ill.). Retrieved from
Jamal, A., Agaku, I. T., O'Connor, E., King, B. A., Kenemer, J. B., & Neff, L. (2014). Current cigarette
smoking among adults--United States, 2005-2013. MMWR Morb Mortal Wkly Rep, 63(47), 1108-1112. Jin, Y., Lu, B., Klein, E. G., Berman, M., Foraker, R. E., & Ferketich, A. K. (2016). Tobacco-Free Pharmacy
Laws and Trends in Tobacco Retailer Density in California and Massachusetts. Am J Public Health, 106(4), 679-685. doi:10.2105/AJPH.2015.303040
Kim, J. E., & Tsoh, J. Y. (2016). Cigarette Smoking Among Socioeconomically Disadvantaged Young Adults in Association With Food Insecurity and Other Factors. Prev Chronic Dis, 13, E08.
doi:10.5888/pcd13.150458
Laska, M. N., Caspi, C. E., Pelletier, J. E., Friebur, R., & Harnack, L. J. (2015). Lack of Healthy Food in Small-Size to Mid-Small-Size Retailers Participating in the Supplemental Nutrition Assistance Program,
Minneapolis-St. Paul, Minnesota, 2014. Prev Chronic Dis, 12, E135. doi:10.5888/pcd12.150171
Lee, J. G., Henriksen, L., Myers, A. E., Dauphinee, A. L., & Ribisl, K. M. (2014). A systematic review of store audit methods for assessing tobacco marketing and products at the point of sale. Tob Control, 23(2), 98-106. doi:10.1136/tobaccocontrol-2012-050807
Lee, J. G., Henriksen, L., Rose, S. W., Moreland-Russell, S., & Ribisl, K. M. (2015). A Systematic Review of Neighborhood Disparities in Point-of-Sale Tobacco Marketing. Am J Public Health, 105(9), e8-18. doi:10.2105/AJPH.2015.302777
Lopez-Trigo, P., Khanfar, N. M., Alameddine, S., & Harrington, C. (2015). Banning Tobacco Sales at the Retail Pharmacy: Natural Evolution of Drug Store As Responsible Health Provider Or Effective Marketing Strategy? Health Mark Q, 32(4), 382-393. doi:10.1080/07359683.2015.1093885
Macartney, S., Bishaw, A., & Fontenot, K. (2013). Poverty Rates for Selected Detailed Race and Hispanic Groups by State and Place: 2007 – 2011, American Community Survey Briefs. U.S. Department of Commerce, Economics and Statistics Administration, U.S. Census Bureau.
Muennig, P., Franks, P., Jia, H., Lubetkin, E., & Gold, M. R. (2005). The income-associated burden of disease in the United States. Soc Sci Med, 61(9), 2018-2026. doi:10.1016/j.socscimed.2005.04.005
Myers, A. E., Hall, M. G., Isgett, L. F., & Ribisl, K. M. (2015). A comparison of three policy approaches for tobacco retailer reduction. Prev Med, 74, 67-73. doi:10.1016/j.ypmed.2015.01.025
Ribisl, K. M., D'Angelo, H., Evenson, K. R., Fleischhacker, S., Myers, A. E., & Rose, S. W. (2016). Integrating Tobacco Control and Obesity Prevention Initiatives at Retail Outlets. Prev Chronic Dis, 13, E35.
doi:10.5888/pcd13.150426
Robertson, L., Cameron, C., McGee, R., Marsh, L., & Hoek, J. (2016). Point-of-sale tobacco promotion and youth smoking: a meta-analysis. Tob Control. doi:10.1136/tobaccocontrol-2015-052586
Robertson, L., McGee, R., Marsh, L., & Hoek, J. (2015). A systematic review on the impact of point-of-sale tobacco promotion on smoking. Nicotine Tob Res, 17(1), 2-17. doi:10.1093/ntr/ntu168
Rodriguez, D., Carlos, H. A., Adachi-Mejia, A. M., Berke, E. M., & Sargent, J. D. (2013). Predictors of tobacco outlet density nationwide: a geographic analysis. Tob Control, 22(5), 349-355.
doi:10.1136/tobaccocontrol-2011-050120
Rose, S. W., Barker, D. C., D'Angelo, H., Khan, T., Huang, J., Chaloupka, F. J., & Ribisl, K. M. (2014). The availability of electronic cigarettes in U.S. retail outlets, 2012: results of two national studies. Tob Control, 23 Suppl 3, iii10-16. doi:10.1136/tobaccocontrol-2013-051461
Sabanayagam, C., & Shankar, A. (2012). Income is a stronger predictor of mortality than education in a national sample of US adults. J Health Popul Nutr, 30(1), 82-86.
U.S. Department of Agriculture. (2015a). Food Security in the U.S.: Definitions of Food Security. Retrieved from http://www.ers.usda.gov/topics/food-nutrition-assistance/food-security-in-the-us/definitions-of-food-security.aspx
U.S. Department of Agriculture. (2015b). SNAP Retailer Management: 2014 Annual Report. U.S. Department of Agriculture, Food and Nutrition Service, Supplemental Nutrition Assistance Program.
U.S. Department of Agriculture. (2016). WIC Program Participation and Costs. Retrieved from http://www.fns.usda.gov/sites/default/files/pd/wisummary.pdf
U.S. Department of Health and Human Services. (2014). The Health Consequences of Smoking-50 Years of Progress: A Report of the Surgeon General. Atlanta (GA): U.S. Department of Health and Human Services, Centers for Disease Control and Prevention, National Center for Chronic Disease Prevention and Health Promotion, Office on Smoking and Health Retrieved from
http://www.ncbi.nlm.nih.gov/pubmed/24455788.
Wakefield, M. A., Terry-McElrath, Y. M., Chaloupka, F. J., Barker, D. C., Slater, S. J., Clark, P. I., & Giovino, G. A. (2002). Tobacco industry marketing at point of purchase after the 1998 MSA billboard advertising ban. Am J Public Health, 92(6), 937-940.
White, V. M., White, M. M., Freeman, K., Gilpin, E. A., & Pierce, J. P. (2006). Cigarette promotional offers: who takes advantage? Am J Prev Med, 30(3), 225-231. doi:10.1016/j.amepre.2005.11.001
Whitehouse, A., Simon, A., French, S. A., & Wolfson, J. (2012). Availability of snacks, candy and beverages in hospital, community clinic and commercial pharmacies. Public Health Nutr, 15(6), 1117-1123.
doi:10.1017/S1368980011003600