Abstract
TABLE OF CONTENTS
ABSTRACT ... 1
INTRODUCTION ... 1
BACKGROUND ... 2
LITERATURE REVIEW ... 6
METHODOLOGY ... 8
GISANALYSIS ... 8
POLICY ANALYSIS ... 10
QUALITATIVE INTERVIEWS ... 10
FINDINGS ... 11
GISANALYSIS ... 11
POLICY ANALYSIS ... 15
QUALITATIVE INTERVIEWS ... 18
DISCUSSION ... 19
LIMITATIONS ... 22
RECOMMENDATIONS ... 23
CONCLUSION ... 25
APPENDIX A ... 26
APPENDIX B ... 40
1
Introduction
In June 2016, the North Carolina Floodplain Mapping Program released a preliminary version of updated Flood Insurance Rate Maps (FIRMs) for the North Carolina coast on its Flood Risk Information System (FRIS). FIRMs map the 100- and 500-year floodplains and are the foundation for National Flood Insurance Program (NFIP) requirements, as all federally backed mortgages in the 100-year floodplain require flood insurance. The Federal Emergency Management Agency (FEMA), which operates the NFIP, sets standards for communities to create and update their FIRMs. In 2000, the North Carolina Floodplain Mapping Program was created and assumed control of the map update process for all North Carolina communities in an effort to improve mapping capacity and produce more accurate digital FIRMs. After a community review period, new FIRMs are approved by FEMA, adopted by local communities, and subsequently used to determine flood insurance rates and requirements. To participate in the NFIP and enable residents to purchase insurance, communities must also adopt local flood damage prevention ordinances to regulate development in the floodplain. FIRMs typically serve as the basis for these floodplain development regulations as well. Accurate FIRMs are thus an integral component of effective flood risk management.
If approved, the preliminary FIRMs for the North Carolina coast will result in downgrading the rated risk of over 31,000 properties, including 14,800 properties reclassified out of the high velocity flood zone and 17,000 properties reclassified as minimal flood risk (Friend, 2016). While properties in the latter group will no longer require flood insurance, all of the reclassified property will be subject to different—likely less stringent—building and usage requirements, depending on local flood damage prevention ordinances.
This paper encompasses an assessment of the proposed FIRM changes, an evaluation of existing floodplain management policies, and an analysis of planners and floodplain managers’ strategies and priorities as they plan their transition to the preliminary FIRMs. The proposed map changes in Dare County, NC merit study because they present a potential major barrier to coastal resilience. Depending on flood damage prevention ordinances, the FIRM changes may inherently enable less resilient development along the coast because flood zones typically determine the floodplain development regulations that apply to an area. Without higher standards in floodplain development regulations, if FIRMs show lower levels of risk, less resilient development can occur, even if actual flood risk is greater than what is shown on the FIRM. Furthermore, if planners and floodplain managers are not considering the future of risk, the FIRM changes may result in maladaptation that makes it more difficult to achieve resilience to future flood risk. In other words, planners may make decisions to develop areas that are currently not at risk of flooding but may be at risk in the future, thus increasing the exposure to future flood risk in the community. Finally, these FIRM changes may signal to residents, planners, and floodplain managers that the land along the coast is “safe” from flooding, resulting in decision-making that weakens future flood resilience.
2 However, this is not an unprecedented situation; for example, 10,000 properties were removed from the floodplain in Collier County, Florida in 2012 and St. Johns County, Florida in 2016 (Farrell, 2012; Martin, 2016). Additionally, while this study focuses on Dare County, NC, communities all along the North Carolina Coast are experiencing similar decreases in rated-risk. It can be assumed that this is not an isolated incident and that other communities may face similar challenges in the future. Therefore, this research can benefit other communities by identifying opportunities for building and maintaining resilience.
Background
If approved, the preliminary FIRMs will result in downgrading the rated risk of over 31,000 properties in coastal North Carolina, including 14,800 properties reclassified out of the high velocity flood zone and 17,000 properties reclassified as minimal flood risk (Friend, 2016). While properties in the latter group will no longer require flood insurance, all of the reclassified property will be subject to different—likely less stringent—building and usage requirements, depending on local flood damage prevention ordinances.
Following a public comment and review period, the new FIRMs will be released for approval, at which time local governments have six months to adopt the revised maps and update their flood damage prevention ordinances in order for the map update process to be considered complete. This process allows time for local governments to consider the implications of their rated risk changes and use planning and policy tools to encourage resilience in their jurisdictions. However, the timeline is relatively short and requires quick decision-making on the part of local planners, floodplain managers, and policy makers to consider the impacts of the changes and how best to continue managing future flood risk.
The revised maps were produced using more sophisticated technology and robust models than previous versions, enabling a more accurate snapshot of actual present day risk. However, that does not make them infallible. FIRMs reflect current conditions and risk at the time of their creation, but they can quickly become outdated. For example, environmental factors such as dune erosion or subsidence can impact the floodplain, exposing more area to flood risk. Development can also cause the floodplain to expand, either by increasing stormwater runoff if it is not properly managed on site or, if development occurs in the floodplain, by reducing the floodplain’s total flood storage volume.
Environmental conditions are impossible to control, and thus there will always be a level of uncertainty with regard to flood risk. On the other hand, development is a managed process, and development regulations are an important tool for addressing flood risk and floodplain management. Relaxed building conditions in newly designated “minimal risk” areas present the potential for increased development pressure or changes to existing development, which, in turn, may increase risk by expanding both the floodplain and physical exposure to flooding. Planning and regulations are thus a means of either increasing or decreasing flood hazard risk; determining how they will impact flood risk merits study.
3 no longer considered to be within the regulatory floodplain. In addition to its dramatic rated risk change, Dare County is also home to Bodie Island in the Outer Banks, one of the State’s most dynamic coastal environments. Due to this coupling of large-scale rated risk changes and high environmental dynamism, Dare County and its Outer Banks communities offer a prime test case to analyze the FIRM changes as well as the response of planners and floodplain managers. With this inquiry, we can begin to better understand the potential impact of these floodplain map changes on future flood risk, their implications for planning, and the opportunities for building resiliency into this process across all of coastal North Carolina. I expect to find that the map update process will pose a major barrier to resilience by enabling increased development in areas that will be at risk to flooding in the future.
In this paper, I evaluate the planning implications of this large-scale reduction of rated risk in Dare County, NC through GIS analysis of potential risk increases, descriptive policy research of existing flood prevention and floodplain management policy, and qualitative interviews with local planners and floodplain managers. The findings from these inquiries inform a set of recommendations intended to foster resilience in coastal communities’ floodplain management strategies. The scope of analysis includes all of Dare County, including the following areas:
• Dare County Unincorporated Areas • Town of Duck
• Town of Kitty Hawk • Town of Kill Devil Hills • Town of Manteo
• Town of Nags Head • Town of Southern Shores
Flood risk in the United States is typically understood as a locational attribute determined with respect to Flood Insurance Rate Maps (FIRMs) created by the Federal Emergency Management Agency (FEMA). These FIRMs delineate the Special Flood Hazard Area (SFHA) as those areas subject to the 1-percent annual chance flood, commonly referred to as the “100-year flood.” FIRMs also delineate the 0.2-percent annual change flood, or “500-year flood” and areas considered to be outside the floodplain. Additional stratifications within the SFHA provide further detail, such as distinguishing “AE,” areas subject to the 1-percent annual chance flood, from “VE,” areas also exposed to velocity wave action. Typical FIRM flood zones, as defined by FEMA, are detailed below in Table 1.
Table 1: FEMA Flood Zone Definitions Zone Definition
A
“Areas subject to inundation by the 1-percent-annual-chance flood event generally determined using approximate methodologies. Because detailed hydraulic analyses have not been performed, no Base Flood Elevations (BFEs) or flood depths are shown.”
AE “Areas subject to inundation by the 1-percent-annual-chance flood event determined by detailed methods. Base Flood Elevations (BFEs) are shown.”
AO
4 Zone Definition
VE
“Areas subject to inundation by the 1-percent-annual-chance flood event with additional hazards due to storm-induced velocity wave action. Base Flood Elevations (BFEs) derived from detailed hydraulic analyses are shown.”
0.2%-Annual-Chance Flood
Areas of moderate flood risk, “between the limits of the base flood and the 0.2-percent-annual-chance (or 500-year) flood.”
X (unshaded) Areas of minimal flood risk outside the SFHA and the 0.2-percent-annual-chance flood.
5 Figure 1: Dare County Effective and Preliminary FIRMs
6
Literature Review
The 100-year floodplain, or SFHA, is used as a demarcation of risk that determines federal NFIP policy requirements and affects local flood mitigation decisions. Despite its importance, the 100-year floodplain has been found to be both an ineffective threshold for risk and detrimental as a boundary for policy application (Highfield et al., 2013). In a study of 30 years of repetitive loss data in Harris County, Texas, Highfield, Norman, and Brody found that over 47% of claims and over $147 million in losses occurred outside the 100-year floodplain, suggesting that this boundary fails to capture an adequate degree of risk for local policymakers to enact effective flood mitigation efforts and build resilience (2013). Development policy treated all development outside the floodplain boundary equally, be it 1 foot or 1000 feet away, despite the fact that properties closer to the boundary faced more risk; however, it is unclear what distance from the floodplain boundary most losses were sustained and whether the boundary resulted in intense development directly outside the mapped floodplain (Highfield et al., 2013). Regardless, these findings call into question the validity of the 100-year floodplain as an appropriate baseline for flood risk mitigation. The validity of the 100-year floodplain as a boundary for flood risk is a particularly salient question given that climate change will likely increase the severity of the 1-percent-annual-chance flood by 2100 (AECOM et al., 2013). AECOM’s report for FEMA notes that in coastal areas, the definition of the 1-percent-annual-chance flood is highly dependent on changes in the frequency and intensity of coastal storms, with increased storm frequency increasing the rate of return for what is now considered the 100-year flood, and increased storm intensity increasing flood elevation (2013). Changes to storm frequency and intensity are uncertain and not locally specific, though AECOM adopts the general estimate of 10% increase in intensity and a 33% decrease in frequency. The SFHA boundary will also be affected by shoreline change; in coastal communities (that often attempt to stabilize their shorelines) the SFHA is expected to grow (AECOM et al., 2013).
Flood risk is further magnified by the inadequacy of standard NFIP policy requirements. The Association of State Floodplain Managers (ASFPM) “strongly believes the minimum NFIP floodplain regulations do not provide adequate long-term flood risk reduction for communities and that the benefits of flood risk reduction achieved by higher regulatory standards far outweighs the burden of administering them” (ASFPM, 2013). Thus, not only is the physical boundary for typical regulations too small, but the required standard for regulation within that boundary area is too weak.
The language and visual conveyance of flood risk information also affects flood risk, by impacting individuals’ risk perception, generating uncertainty about actual risk, and, in the case of mapped risk, possibly creating a perceived risk dichotomy between areas in and out of the SFHA (Bell and Tobin, 2007). In other words, some individuals may interpret the mapped floodplain to mean that all areas outside the floodplain are not at risk of flooding.
7 purchase requirements for federally backed mortgages and subsidies for older properties, participation in the NFIP is low (Burby, 2001; Kriesel and Landry, 2004; Dixon, Clancy, Seabury, and Overton, 2006). If individuals cannot be relied upon to prepare for disaster risk on their own, it is incumbent upon planners and policymakers to mitigate risk. In fact, a strong, community-oriented planning process may be enough to encourage individual action, as people are more likely to act when they trust their local officials and when they can imagine the effects of a disaster (Wachinger et al., 2013).
In addition to potentially encouraging individual action, planning and development management are key approaches to effectively mitigating large-scale risk because risk is fundamentally a function of exposure, and exposure is the outcome of development policy and practice (IPCC, 2012). However, just as risk uncertainty affects individuals’ behavior, it can also impact local planners’ efforts. One major barrier to effective hazard mitigation is the lack of local level knowledge and data on disasters and risk (IPCC, 2012). Overcoming this barrier is two-fold: (1) climate change data needs to be interpreted for the local level in order for planners to understand and plan for their true level of risk and (2) local level planners must then seek out and use that data.
Beyond impacts on individual action, inaccuracies in risk perception can be dangerous because the perception of safety can result in poor development practices, producing the safe development paradox. In hazardous areas, new development is often concentrated in locations where mitigation measures have rendered development “safe,” yet when a hazardous event occurs that exceeds the safety parameters of that location, losses are even greater than they would have been because exposure is so much higher (Burby, 2006). Burby defines this safety designation as occurring with the installation of technological fixes, such as levees or beach nourishment (2006), but considering the lack of accurate risk perception in floodplain mapping, I argue that the removal of properties from the SFHA could signal an interpretation of these properties as “safe” for development, triggering a similar increase in exposure.
In addition to the obligation to protect human life, hazard mitigation and adaptation measures are a matter of fiscal responsibility. The cost of climate adaptation will only increase with time because future measures may need to be larger and/or reactive (Melillo et al., 2014). Failing to act now also leaves open the possibility of incurring costly impacts of recovery; one dollar spent on mitigation now can save up to four dollars on recovery (MMC, 2005; Godschalk, 2009). Not only is inaction costly, but maladaptation, action that perpetuates or exacerbates climate risk, can also increase future vulnerability, risk, and costs (Barnett and O’Neill, 2009). Maladaptation includes making decisions that limit the options of future generations, such as developing in areas that may face risk in the future as a result of climate change (Barnett and O’Neill, 2009). Planners must also balance these concerns with issues of equity by taking care not to overburden long-term residents who might not be able to afford mitigation despite living in vulnerable areas.
8 planning, increasing equity, avoiding risk in future development, building sustainable and self-sufficient structures, rethinking growth boundaries and the “edge” of development, and engaging and empowering the community (Beatley, 2014). The case for coastal resilience has been forcefully made and principles for achieving it have been outlined (Beatley, 2014). However, are floodplain managers and planners aware of these barriers to building resilience? And when faced with these barriers, are they able to succeed in following these principles to ultimately increase their resilience?
Methodology
This project involves three data collection components: GIS analysis of mapped floodplain changes and potential flood risk increases; descriptive policy analysis of existing flood prevention ordinances and floodplain management plans; and qualitative interviews with planners and floodplain managers. The findings from these inquiries will inform the creation of policy recommendations intended to encourage resilience to flood hazards in coastal communities.
GISANALYSIS
The first phase of data collection was a GIS analysis of the study area, Dare County, NC and its incorporated municipalities. First, I compared the effective and revised maps to identify those areas that have experienced rated risk decreases and, more specifically, those areas that have been removed from the mapped floodplain.
Early media reports on the preliminary FIRMs are limited in that they only describe the changes in terms of impacts to structures. These reports identify whether individual buildings were affected by the FIRM changes but do not provide information on land area affected. This level of analysis is useful for evaluating effects on flood insurance requirements and policy holdings because insurance only applies to structures and their contents. However, this method fails to address the impacts of the changes on planning and development, which is an important consideration when looking at future risk given the possibility for growth. These early reports also failed to put the changes in the context of the regulations through which they will be implemented.
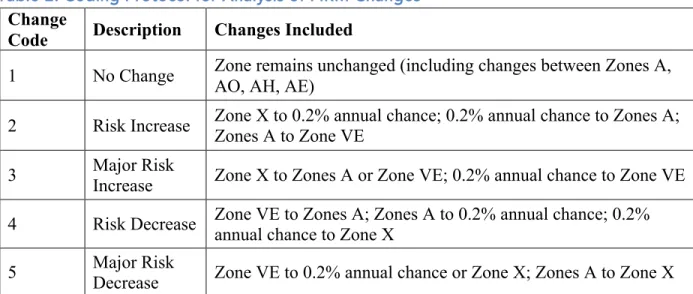
9 convey, which include information about the type and depth of flooding, under the assumption that regulation is typically applied equally to these zones. All other mapped zones were treated separately. This assumption does not account for the possibility of stricter regulations being applied to certain areas within the AO zone specified as Coastal A, but because Coastal A zones are not necessarily regulated separate from other A zones and because I could not identify a clearly demarcated Coastal A zone in the preliminary FIRMs, I felt this simplification was reasonable. The coding for change analysis is detailed in Table 2.
Table 2: Coding Protocol for Analysis of FIRM Changes
Change
Code Description Changes Included
1 No Change Zone remains unchanged (including changes between Zones A, AO, AH, AE)
2 Risk Increase Zone X to 0.2% annual chance; 0.2% annual chance to Zones A; Zones A to Zone VE
3 Major Risk Increase Zone X to Zones A or Zone VE; 0.2% annual chance to Zone VE
4 Risk Decrease Zone VE to Zones A; Zones A to 0.2% annual chance; 0.2% annual chance to Zone X
5 Major Risk Decrease Zone VE to 0.2% annual chance or Zone X; Zones A to Zone X
To understand the potential for development impacts, I evaluated the parcel-level rated risk changes in terms of the development status of each parcel, using the total improved value of each parcel as an indicator of development. If a parcel had an improved value of zero, I classified it as undeveloped; for any improved value above zero I classified the parcel as developed.
Then, using data from NOAA’s sea level rise data viewer1 for one, three, and six feet of approximate sea level rise, I evaluated the potential for future flooding. Specifically, I determined the percent of downgraded parcels (those with a risk decrease or major risk decrease) and removed parcels (those moved into the unshaded Zone X) that may be subject to future flooding and classified those parcels based on their development status. Parcels were considered affected if they were at all overlapped by a polygon of sea level rise extent.
Finally, I assessed the current land use, according to the National Parcel Data Portal (NPDP), of all parcels most vulnerable to SLR. This NPDP provides data on how each parcel is being used but does not convey the planned use for a parcel in the event that the future land use designation differs from the existing use. Still, given the pace of development, the existing map is a reasonable representation for future use. I limited this analysis to those parcels vulnerable to
1 Data updated in August 2016 with new elevation data based on post-Sandy LIDAR from NOAA’s National
10 foot SLR because, according to a 2010 report for the North Carolina coast, local sea level is likely to rise by 39 inches by 2100 (Peach, 2014).
POLICY ANALYSIS
The second phase of data collection involved conducting an evaluation and descriptive analysis of flood prevention ordinances and other floodplain management policies in Dare County, NC and its incorporated municipalities. Should no policy changes be enacted in conjunction with the adoption of the revised maps, these policies will dictate development in and around the floodplain. The aim of this inquiry was to understand the current strategies in place and the extent to which future flood risk might be mitigated (or intensified).
Given that the FIRM update process is tied to renewal of a community’s flood damage prevention ordinance, I focused primarily on the adoption of higher regulatory standards in this study. However, because higher regulatory standards are only one facet of building resilience to flooding, I also reviewed each community’s participation with the NFIP Community Rating System (CRS) as a further proxy for increased resilience in floodplain management. I did not include an analysis of land use plans and policies in this assessment, but instead asked interview participants about the integration of floodplain management in their land use plans and policies.
To evaluate the flood damage prevention ordinances, I used “A Guide for Higher Standards in Floodplain Management,” prepared by the Association of State Floodplain Managers (ASFPM) Regulations Committee and revised in March 2013. This guide outlines a list of options for “enhancing existing regulations with higher standards that will greatly reduce risk” (ASFPM, 2013). For each applicable category of regulation discussed in the guide, I differentiated tiers of achievable standards and assigned a point value to each tier, with higher point values corresponding to greater levels of resilience to flood risk. In total, I identified 20 categories of regulatory standards. The evaluation tool can be found in Appendix B. The details and rationale for each standard are explained in the ASFPM guide.
QUALITATIVE INTERVIEWS
The third phase of data collection consisted of qualitative interviews with planners and floodplain managers from Dare County and its incorporated municipalities. The aim of this component of the study was to learn how familiar planners and floodplain managers are with the impacts of the preliminary FIRMs, whether or not they are considering the changes in relation to future flood risk, and how they are planning to respond to the FIRM changes. Specifically, I sought to collect information on (1) planners’ and floodplain managers’ knowledge of local-level changes in the revised maps (as opposed to the overall structural impacts reported by news media), (2) the planning impacts they expect as a result of the map changes, (3) what they would consider to be best practices for planning in response to these floodplain map changes, and (4) their anticipated and/or preferred strategies for planning and floodplain management moving forward. The full interview protocol can be found in Appendix B.
11
Findings
GISANALYSIS
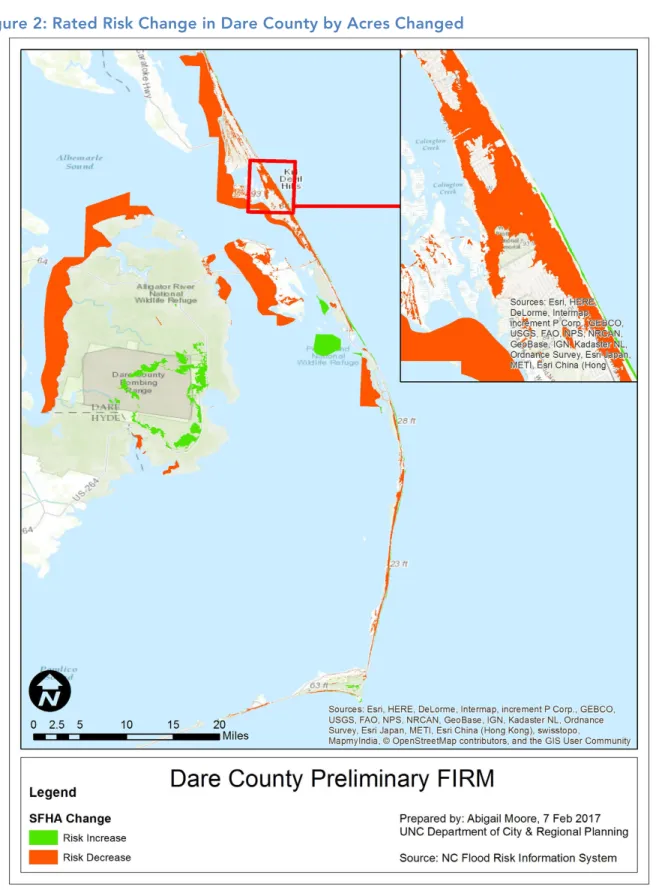
According to data from the NC Flood Risk Information System (FRIS) GIS, across the study area, 13,419.25 acres see a risk increase, and 68,952.53 acres see a risk decrease while 705,314.59 acres see no change in rated risk. These changes are reflected in Figure 2 in Appendix A. It is important to note that this data includes land and water area, and as a result, the total acreage is vastly inflated. The majority of water area is counted as no change, but some of the area mapped and recorded by NC FRIS as a change in risk is not land area. This is apparent, for example, on the western side of Roanoke Island, where portions of the Croatan Sound display as areas of risk decrease as well as along the eastern shore of the Alligator River where it meets the Albemarle Sound on the coast of northwestern Dare County. It also occurs for risk increase, as in portions of the Roanoke Sound southeast of Wanchese. Regardless, the data indicates an overwhelming trend of risk decrease with only minor areas of risk increase.
13 Figure 4 through Figure 9 in Appendix A detail changes for each municipality. These change categories are detailed in Table 2 in the Methodology section, above. These change categories assume a range in the degree of risk conveyed in flood zones, from Zone X, to 500-year, to Zones A/AE/AH/AO, to Zone VE, where Zone X designates the lowest level of risk and Zone VE designates the highest level of risk.
Compared to the NC FRIS data on risk change based on total area, this analysis shows a significant difference in acreage of risk increase. There are likely two explanations: (1) NC FRIS shows risk increases on large parcels in western Dare County near the Air Force Dare County Bombing Range that register as no change in a parcel analysis because parts of those parcels were rated higher in risk in the effective FIRM, and (2) areas of risk increase recorded by NC FRIS in the Roanoke Sound are not part of a parcel and thus not included in total parcel acreage.
Table 3: Summary of Overall Parcel-Level FIRM Changes
Change Status Number of Parcels Acreage
No Change 15,730 169,582.38
Risk Increase 26 187.05
Major Risk Increase 12 4.85
Risk Decrease 13,915 68,163.64
Major Risk Decrease 10,083 3,581.29
Across the entire study area, 8,567 parcels (184,358.59 acres) are undeveloped and 31,235 parcels (57,160.63 acres) are developed. Table 4 summarizes the FIRM changes of all undeveloped parcels. Table 5 summarizes the FIRM changes of all developed parcels.
Table 4: Summary of FIRM Changes in Undeveloped Parcels
Change Status Number of Parcels
Percent of
Total Parcels Total Acreage
Percent of Total Acreage
No Change 4,072 47.732% 121,715.09 66.021%
Risk Increase 4 0.047% 103.45 0.056%
Major Risk Increase 3 0.035% 2.60 0.001%
Risk Decrease 3,028 35.494% 61,870.54 33.560%
Major Risk Decrease 1,424 16.692% 666.91 0.362%
Table 5: Summary of FIRM Changes in Developed Parcels
Change Status Number of Parcels Percent of Total Parcels Total Acreage Percent of Total Acres
No Change 11,658 37.324% 47,867.29 83.742%
Risk Increase 22 0.070% 83.60 0.146%
14 Change Status Number of Parcels Percent of Total Parcels Total Acreage Percent of Total Acres
Risk Decrease 10,887 34.855% 6,293.11 11.010%
Major Risk Decrease 8,659 27.722% 2,914.38 5.099%
In both undeveloped and developed parcels, no change is the most common outcome of the shift to the preliminary FIRMs, in terms of both parcel count and total acreage. The second most common outcome across all parcels is a risk decrease, followed by a major risk decrease. While nearly the same percentage of developed and undeveloped parcels see a risk decrease, this change affects nearly 7 times more acres of undeveloped land. Overall, risk decreases account for nearly 34% of all undeveloped land and over 15% of all developed land.
In total, 23,998 parcels experience a decrease in rated risk under the preliminary FIRMs. Of those parcels, 17,822 are removed from the regulatory floodplain entirely. As shown in Figure 10 in Appendix A, the majority of removed parcels are clustered in northern Dare County in Duck, Southern Shores, Kill Devil Hills, Nags Head, and northwest of Manteo.
Parcel vulnerability to 1-foot, 3-foot, and 6-foot sea level rise (SLR) is summarized in Table 8, Table 9, and Table 10 in Appendix A. Across the study area, 7,621 parcels (19.2%) are expected to be impacted by 1 foot of SLR, 14,302 parcels (36.0%) are expected to be impacted by 3 feet of SLR, and 22,810 parcels (57.4%) are expected to be impacted by 6 feet of SLR. Parcels experiencing a risk increase or major increase remain constant across all three levels of SLR. Parcels experiencing no change of rated risk status account for the majority of those impacted by SLR: 76.5% of 1-foot SLR impacts, 77.8% of 3-foot SLR impacts, and 63.5% of 6-foot SLR impacts. Parcels with rated risk decreases account for over 20 percent of 1-foot and 3-foot SLR impacts and over 35 percent of 6-foot SLR impacts. Across all scenarios, the majority of impacted parcels are developed.
Projections of future SLR are still subject to a high degree of uncertainty due to the range of potential emissions scenarios, local variability, ice sheet melt, and other factors (Walsh et al., 2014). Current semi-empirical models based on simple statistical relationships between past temperature change and SLR suggest that two to six feet of additional SLR can be expected by 2100 (Walsh et al., 2014). Newer studies suggest a range of one to four feet of SLR by 2100, with 4-foot rise likely under high emission scenarios (Walsh et al., 2014). A report specific to the North Carolina coast produced in 2010 projected a likely 39 inches of SLR by 2100 (Peach, 2014).
15 The current land use of undeveloped parcels vulnerable to 3-foot SLR is summarized in Table 12. Only 23 of these parcels are currently registered with a residential use. However, the vast majority of these parcels, 82.2% (3338 parcels), are registered as privately held vacant land. This land use description leaves significant uncertainty regarding the future risk of these properties, but it is possible these parcels could be developed. Comparison with the zoning map or future land use map would clarify the possible future use of these properties and the flood risk they might present.
POLICY ANALYSIS
The evaluation of flood damage prevention ordinances using the ASFPM-based tool revealed a low level of adoption of higher regulatory standards across all jurisdictions with few exceptions. The results of the assessment are shown in Table 6.
16 Table 6: Flood Damage Prevention Ordinance Analysis Results
Dare
County Duck
Kill Devil Hills
Kitty
Hawk Manteo
Nags Head
Southern
Shores Average Median
Freeboard 1 1 0 1 1 1 2 1.00 1
Access 0 0 0 0 0 0 0 0.00 0
Compensatory Storage 0 0 0 0 0 0 0 0.00 0
Critical Development Protection 0 0 0 0 0 0 0 0.00 0
Cumulative Substantial
Damage/Improvement 0 0 0 0 0 0 1 0.14 0
Fill Standards 0 0 0 0 0 0 0 0.00 0
Floodway Rise 0 0 0 0 0 0 0 0.00 0
Foundation Design 0 0 0 0 0 0 0 0.00 0
Future Conditions Hydrologic
Mapping 0 0 0 0 0 0 0 0.00 0
Materials Storage 0 0 0 0 0 0 0 0.00 0
Setbacks 0 0 0 0 0 0 0 0.00 0
Stormwater Management 0 0 0 0 0 0 0 0.00 0
Subdivision Standards 0 0 0 0 0 0 0 0.00 0
Use Regulations 0 0 0 0 0 0 0 0.00 0
Regulating Areas Not Mapped
on FIRM 0 0 0 0 0 0 0 0.00 0
Elevation of All Additions 0 0 0 0 0 0 0 0.00 0
Coastal Siting 0 0 0 0 0 0 0 0.00 0
Dune Protection 1 1 1 1 1 1 1 1.00 1
Coastal Construction 1 1 0 1 1 1 1 0.86 1
Enforcement 2 2 2 2 2 2 2 2.00 2
17 Of these categories of standards, the highest average score achieved is for ordinance enforcement, with all jurisdictions receiving 2 points (out of 2 possible points) for enabling enforcement of the ordinance via both penalties and criminal sanctions. All jurisdictions also received 1 point (out of 1 possible point) for language requiring minimum impacts on dune systems. The next highest average score was achieved for freeboard, as all jurisdictions except Kill Devil Hills require a 1-foot freeboard, and Southern Shores requires a 2-foot freeboard. The average score for coastal construction was 0.86, with all jurisdictions except Kill Devil Hills receiving 1 point (out of a possible 2 points) for requiring that the lowest horizontal member of structures in the VE zone be elevated at least 1 foot above the base flood elevation (BFE).
There is a notable lack of adoption of higher standards that would maintain flood resilience through dramatic reductions in rated risk. None of the communities have adopted future conditions floodplain mapping, which could enable the incorporation of projected development, shoreline change, and sea level rise into the modeling of floodplains for the purposes of floodplain development regulation. Future conditions mapping models flood zones based on their projected future state and thus minimizes changes to mapped floodplains over time, increasing the consistency of floodplain development regulation and enabling flood-resilient long-term planning. Similarly, none of the communities have adopted regulations for areas not mapped on the FIRM. This action could have established existing Zone X minimum elevations or limitations on ground floor enclosures, thereby increasing consistency in development requirements across flood zones and reducing the likelihood of changes to development characteristics based on flood zone designation. All communities refer to Coastal Area Management Act standards for setbacks from the mean high tide, but these setbacks are smaller than what is recommended by ASFPM. Increasing required setbacks could counter the effects of the smaller VE zone by expanding the area along the coast where development is prohibited.
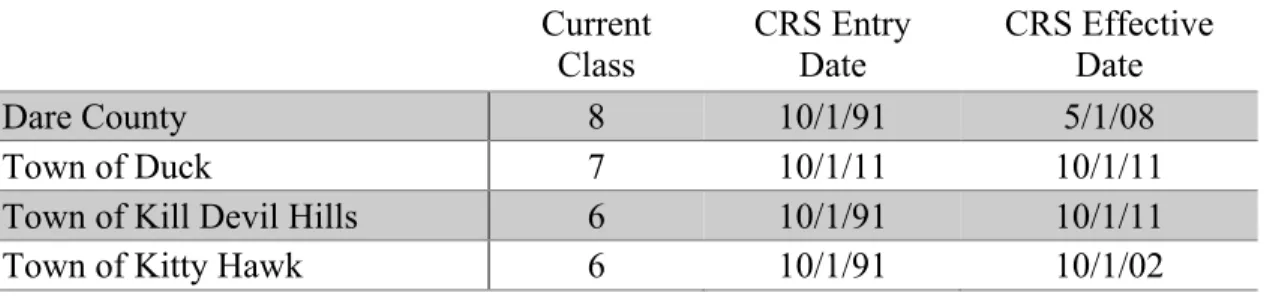
Dare County and all of its incorporated municipalities participate in the CRS program. With the exception of Duck, all communities have participated since the early 1990s. The current class, entry date, and effective date for each community is listed in Table 7, below. Interestingly, these class ratings do not align with scores for adoption of higher standards in flood damage prevention ordinances. Dare County received the second highest score for higher standards yet ranks comparatively lower than its incorporated municipalities in the CRS. Kill Devil Hills scored lowest on adoption of higher regulatory standards yet is ranks among the highest CRS class achieved in the County. Assuming the CRS is a reliable indicator of community flood resilience, these findings suggest that the adoption of higher regulatory standards is not necessarily indicative of overall community resilience to flooding.
Table 7: CRS Class Ratings, Entry Dates, and Effective Dates Current
Class CRS Entry Date CRS Effective Date
Dare County 8 10/1/91 5/1/08
Town of Duck 7 10/1/11 10/1/11
Town of Kill Devil Hills 6 10/1/91 10/1/11
18
Town of Manteo 7 10/1/91 10/1/16
Town of Nags Head 6 10/1/91 10/1/01
Town of Southern Shores 7 10/1/92 10/1/11
Source: FEMA. (2016). Community Rating System (CRS) Communities and their Classes.
The CRS program encourages communities to participate in activities related to public information, mapping and regulatory action, damage reduction, and emergency preparedness. Each class rating requires a minimum level of achievement across categories, but participation in the program does not necessarily mean a community has planned to reduce flood risk. Even for those activities intended to encourage planning for flood risk management, such as developing a floodplain management plan, prevention of flooding through land use planning is not necessarily required or achieved (Berke, Lyles, and Smith, 2014). Berke, Lyles, and Smith found that
preventive land use actions are the least likely to be included in floodplain management plans (2014). Thus, despite high class ratings in the CRS programs, these communities are not necessarily using land use planning to reduce flood risk and are more likely pursuing actions related to emergency services, structural protection of property and infrastructure, and information and awareness (Berke, Lyles, and Smith, 2014).
QUALITATIVE INTERVIEWS
Planners and floodplain managers from five of the seven study communities participated in interviews. Participants’ responses revealed that the FIRM update is a major priority for planners and floodplain managers, who are well aware of the impacts within their jurisdictions. All participants were able to provide or had access to information on the number of structures affected and the changes by zone between the effective and preliminary FIRMs. This awareness generally did not extend to impacts on developable land; however, in one case, the planner was aware of the general amount of developable land as well as the overall extent of impacts and made inferences based on that knowledge.
All participants also acknowledged having access to data on the extent of flooding under BFE +1 foot, BFE +2 feet, and BFE +3 feet conditions, but no participants considered this as a proxy for sea level rise nor used it for planning purposes. One community used the data to argue the need for higher regulatory standards. With the exception of Nags Head, no planners mentioned planning for sea level rise, and in one case the participant noted that it was not required of them to look at sea level rise, there are difficulties in doing so imposed by the State, and they are already too overwhelmed with handling the FIRM update process to consider additional planning.
19 Participants differed in what they felt was a greater concern for future risk, though all noted a change in current development characteristics. All participants feel the FIRM update process could lead to an increase in future flood risk by enabling increased exposure to flooding. Despite uncertainty about future development, nearly half of participants see new development as their primary concern for future risk. Two participants noted that while their towns are almost fully built out, redevelopment is a serious concern, as property owners may demolish old cottages to make way for larger structures, increasing flood exposure in the process. Still other participants see additions and conversions as the likely primary cause of future increased risk. Where structures are no longer considered part of the SFHA, planners fear that ground floor enclosures—currently regulated and restricted to use for storage and parking in VE zones—may be converted into living spaces. Such changes would increase exposure to flooding, reduce the area available for floodwaters to flow without impediment, and increase the potential damage of flood events.
When asked about their expected or planned response to the release of the new FIRMs, participants’ responses were generally well aligned. No jurisdiction plans to appeal the new maps, but all are planning to respond with measures to reduce the changes these new FIRMs would enable in floodplain development. Across the board, all participants named higher regulatory standards as both their idea of a coastal floodplain management best practice and as their preferred strategy moving forward. Additionally, all participants agreed that actual flood risk is higher than what is depicted in the preliminary FIRMs and most seem to expect that future FIRMs will reflect a higher level of risk.
Interestingly, many municipal planners recommended speaking with the county planner for more information on how they will be responding to the map changes. In an effort led by the county planner, all jurisdictions in Dare County are working together to plan a coordinated response to the State and a unified strategy for floodplain management moving forward. Strategies under discussion include adopting the new FIRMs for insurance purposes but maintaining the old FIRMs for regulatory purposes, applying a minimum elevation requirement across all land area regardless of flood zone, and/or increasing the required freeboard to compensate for the lower BFE in the preliminary FIRM.
Discussion
I expected to find that a significant number of undeveloped properties removed from the SFHA, and that this would elicit an increase in development pressure and pose a substantial increase in exposure to future flood. However, my findings indicate that undeveloped parcels removed from the floodplain represent an insignificant portion (less than 0.06%) of all parcels vulnerable to 3-foot SLR. Nonetheless, other land use and development issues were revealed to be of greater concern and still merit examination as barriers to resilience.
20 are expected to be impacted by 6-foot SLR. Irrespective of the existing policy framework and of planners’ and floodplain managers’ approaches to flood risk, these findings clearly demonstrate the likelihood of increased future flood risk.
Current uses on those properties vulnerable to 3-foot SLR represent potential for an even higher level of future risk. Of particular concern are 9,062 parcels with residential uses within these vulnerable areas. Residential use is recognized by the ASFPM as a priority area for protection (2013). Such a high percentage of residential use represents a substantial risk for loss of life and property within these areas. Other uses of particular concern in the floodplain are critical facilities, which provide services needed for emergency response and recovery as well as for public health and safety. If critical facilities are at risk of flooding it poses an increased risk to people and property dependent on those facilities. Uses storing or creating hazardous materials are also of concern in the floodplain, as flooding in these areas can result in pollution and negative public health impacts. The land uses identified by NPDP data are not specific enough to determine whether a property is a critical facility or might store hazardous materials, therefore the risk posed by these uses is unclear. Nevertheless, their presence indicates a potential for increased risk.
No planners or floodplain managers interviewed mentioned risk to critical facilities and hazardous materials as a concern. This could suggest that critical facilities and hazardous materials are not at risk in Dare County and are therefore not among planners’ and floodplain managers’ priorities. However, no jurisdiction scored for applying higher standards in critical development protection. Therefore, given the absence of regulations preventing the siting of critical in the floodplain, this lack of discussion could also point to a lack of awareness of the risk associated with these uses. Questioning on this subject was not included in the interview protocol, so no conclusions can be drawn.
All participants did recognize the risk that residential uses pose, particularly when existing structures are reclassified to outside the SFHA. Concerns over conversion were always expressed in terms of ground floor spaces on residential buildings being converted into living spaces. Given that the majority of developed structures vulnerable to 3-foot SLR are under residential use, this possibility represents a significant threat. Existing regulations prohibit residential use of ground floor enclosures in the SFHA, but no existing regulations would prohibit their conversion if they are no longer considered part of the SFHA. Planners and floodplain managers are currently considering ways to continue regulating these areas by applying higher standards such as adopting a minimum elevation requirement or applying regulations in Zone X.
21 process. This is crucial given the noted barrier to resilience that poor risk perception poses and the importance of planners’ and public officials’ role in educating the public on this topic. Planners and floodplain managers in Dare County are well-equipped for this task.
Planners and floodplain managers are aware of issues with risk perception in floodplain mapping and expressed concern about the message that removing parcels from the mapped floodplain sends to the public. One planner noted the confusion this process has induced, recounting that while property owners are generally pleased by the prospect of lower flood insurance rates or reduced insurance requirements, the magnitude of changes from the effective FIRM to the preliminary FIRM is so dramatic that many property owners are more confused than pleased. The planner argued that these changes are not intuitive, because the FIRMs are inconsistent with lived experience of flooding. Along with this concern was a recommendation from many planners that extensive public outreach and public education should be included among coastal floodplain management best practices. Consistent with research on risk perception and risk reduction actions, one planner argued that a priority in the public education process should be to build a recognition of responsibility for flood risk and flood mitigation among the public. A FEMA-sponsored Emergency Preparedness Demonstration Project carried out by MDC and the University of North Carolina-Chapel Hill found that extensive public engagement in a community-based vulnerability assessment strengthened community connections and built support for plan implementation, thus reducing vulnerability and improving preparedness and resilience (MDC, n.d.).
There is a shared sense that future FIRMs, if based on more comprehensive models, will show an increase in future flood risk relative to the preliminary FIRMs. Planners noted that the public response to the preliminary FIRMs is similarly skeptical of the dramatic risk decrease, particularly among long-term residents who share common knowledge of past flood events and problem flooding areas. In an effort to improve future floodplain mapping, the communities adopted a resolution in early March 2017 requesting that FEMA and the State to reconsider their coastal mapping models. Thus, in addition to considering how to respond to the preliminary FIRMs, planners and floodplain managers are also looking ahead at how to map and manage future flood risk.
Maintaining consistency over time in floodplain regulations was a common concern among planners and floodplain managers, not only because it affects risk perception but also because it can prevent major financial consequences. Given the shared expectation that the next FIRM update will reflect increased rated risk, planners and floodplain managers fear that development or conversions that occurs under the preliminary FIRM will not be grandfathered under future FIRMs and will instead be subject to costly improvements when they are required to be brought back into conformance with SFHA regulations. As a result, these planners and floodplain managers are pursuing strategies for maintaining existing levels of protection in order to avoid future mitigation or recovery costs.
22 suffer from a lack of investment due to strict regulations on floodplain development because their neighboring communities have generally adopted the same regulations. Additionally, this consistency ensures that no one community is overburdening others with irresponsible floodplain management. Kill Devil Hills may be an exception, as they lack a freeboard requirement and thus allow development at base flood elevation; however, the actual impact of this lack of freeboard is not examined in this study.
Similarly, coordination in planning may encourage a consistent adoption of higher regulatory standards across communities. By presenting a unified front in terms of recommended regulations in response to the preliminary FIRMs, these communities may increase their chances of successful adoption of higher standards. Though the efforts of planners and floodplain managers to coordinate their strategies is commendable, town and county council members will ultimately be responsible for deciding how to proceed. The outcome of these efforts to coordinate is unclear without information on whether planners are also coordinating with decision makers.
Though Dare County communities’ adoption of higher standards is low, the inclusion of some higher standards such as freeboard, dune protection, and coastal construction standards, indicates that communities recognize they must do more than the minimum NFIP standards in order to more fully mitigate risk. The provision of higher standards for enforcement is commendable, but will be more valuable if other higher standards are applied.
Communities commitment to resilience is also evident in their participation in the CRS program. However, CRS participation does not necessarily equate to the use of preventive land use planning strategies, despite this being one of the most important risk reduction tools the program advocates. Interviews with planners did not refute research on the average adoption of land use planning actions in the CRS floodplain management planning process. Planners did not note land use planning as a best practice for coastal management or as a strategy they recommend pursuing in this FIRM update process. Any upcoming or current land use planning is coincidental, and existing incorporation of flood risk appears to stop at hazard identification. No interview participants noted the use of land use planning or development management as a flood risk mitigation tool.
Limitations
1. This study looks at undeveloped land to consider the potential for future growth and thus future flood vulnerability, but not all undeveloped land is necessarily developable. Using undeveloped land to approximate the potential for future development conflates “undeveloped” with “developable”, which likely results in an overstatement of the potential for future risk.
23 undeveloped parcels. Further research should incorporate future land use planning in this assessment to understand if and how development plans account for flood risk, how exposure to flood might grow in the future, and what types of land uses will likely be at risk.
3. The determination of sea level rise impacts was oversimplified in that a parcel was considered affected if the extent of approximate sea level rise intersected it. This method does not account for the extent of the coverage or the magnitude of the impact. Many parcels deemed impacted may not actually see damages from SLR. Nonetheless, the reach of sea level rise can be considered as an indicator of future SFHA growth. As such, those parcels considered affected by sea level rise in this analysis may be those that will be impacted by the future 1-percent-annual-chance flood as the seas do rise.
4. The definition of parcels removed from the floodplain included only those parcels reclassified as fully within Zone X on the preliminary FIRMs. This definition did not include the 500-year floodplain because these zones are still shown on FIRMs and convey a level of risk to the public, enabling some awareness of flood risk. However, the 500-year floodplain is not included in the SFHA and thus is generally not subject to floodplain development regulations. As a result, the number of parcels removed from the floodplain is likely more significant than what is reported here.
5. Due to time and data constraints, the policy analysis does not include planning outcomes but instead is limited to the planning and policy framework. This analysis is useful for understanding the existing capacity for resilience, but further research should study planning outcomes in order to understand whether this capacity for resilience is implemented.
6. The analysis of resilience in planning and floodplain management strategies is based on only five interviews and does not include responses from two of the study communities. This sample may be too small to accurately assess community-wide attitudes and approaches. However, those interviewed are leaders in their respective communities’ map update process and regular planning efforts, and as such, they can be assumed to be reliable indicators of each community’s strategic response. Elected officials were not interviewed, yet their action will be needed to follow through on the strategies of planners and floodplain managers. Therefore, this assessment is not necessarily indicative of planning outcomes.
7. In recommending strategies for building resilience, this paper does not discuss the need to balance resilience and equity. The adoption of higher standards will come at a cost to community members. Though resilience is needed as a means to protect communities’ sustainability and longevity, planners must also consider how their strategies impact long-term residents, particularly given that low-income and socially vulnerable populations are often more likely to live in areas of higher hazard risk.
Recommendations
Link floodplain management and land use planning processes. Planners and floodplain managers
24 opportunity that land use planning presents as a tool for mitigating flood risk and building resilience. Land use plans can go beyond recognizing the existence of flood risk to advocate for future development patterns and strategies that protect against future flood risk as well. Developing a land use plan that includes a focus on flood hazard risk reduction offers the opportunity to engage the community in the risk identification and planning process, build social capital, and envision a resilient future for the community, acknowledging risk early on so as to minimize potential future impacts. As Schwab and Topping advocate, hazard mitigation should be incorporated not just in a standalone hazards element, but also throughout other plan elements that may affect hazards or offer an opportunity for hazard mitigation (2010).
Focus on adopting higher regulatory standards that encourage consistency across space and
time. Currently adopted higher regulatory standards only address areas within the SFHA, which
makes them susceptible to changes in the SFHA. As the FIRM update process in Dare County shows, changes in the SFHA can diverge from local knowledge of problem flooding areas, as floodplain mapping models are not always able to capture the true extent of risk. To protect against changes to the SFHA, communities should consider adopting strategies such as future conditions mapping or land use regulations for areas outside the SFHA in order to maintain consistency in the event new FIRMs differ dramatically from effective FIRMs. The consistency offered by such regulatory standards would also benefit public risk perception by avoiding the confusion that dramatic changes can generate.
Incorporate sea level rise projections in planning efforts. Given that FEMA requirements do not
stipulate the consideration of sea level rise in floodplain mapping models, the burden of planning for sea level rise falls to local planners and floodplain managers. Despite State opposition and the resource strain of responding to the preliminary FIRMs, planners must address sea level rise and incorporate it into their floodplain management plans. Without accounting for the eventual impacts of sea level rise, planners and floodplain managers limit the longevity of their plans and the compromise the resilience of development that occurs, possibly allowing for maladaptation to occur. Though no requirements for their use are in place yet, FEMA has begun to support resilience and climate change adaptation through the inclusion of sea level rise into their Hazard Mitigation Assistance Benefit-Cost Analysis tool, which includes economic value estimates for green open space and riparian areas (FEMA, 2015).
Involve decision makers in the planning discussions. While the efforts of planners and floodplain
25
Conclusion
Contrary to my expectations, undeveloped parcels removed from the SFHA make up only a small portion of those parcels vulnerable to future flood risk. Though some planners are concerned about flood risk and exposure increasing as a result of new development, existing structures and the possibility of redevelopment are more salient concerns. Higher standards in floodplain development policy are equally important to maintaining or increasing the resilience of existing development.
Planners and floodplain managers are well-versed in the FIRM update process and are able to serve as educators and leaders for the public. Similarly, they are aware of general best practices in floodplain management—namely, higher regulatory standards and public education—as well as typical barriers to resilience, including shortcomings in floodplain mapping models and poor public risk perception. This knowledge and awareness makes these planners and floodplain managers well equipped to encourage resilience to flood risk through the FIRM update process.
26
Appendix A
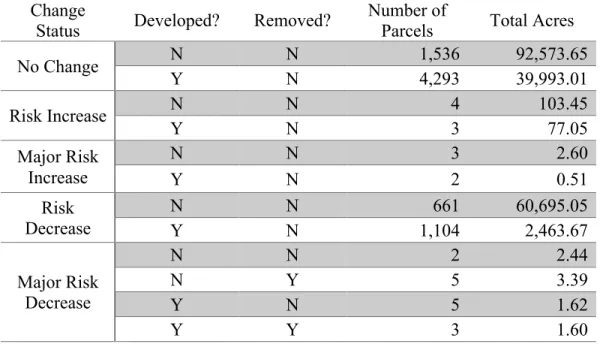
35 Table 8: Summary of Parcels Impacted by 1-foot Sea Level Rise
Change
Status Developed? Removed? Number of Parcels Total Acres
No Change N N 1,536 92,573.65
Y N 4,293 39,993.01
Risk Increase N N 4 103.45
Y N 3 77.05
Major Risk Increase
N N 3 2.60
Y N 2 0.51
Risk Decrease
N N 661 60,695.05
Y N 1,104 2,463.67
Major Risk Decrease
N N 2 2.44
N Y 5 3.39
Y N 5 1.62
Y Y 3 1.60
Table 9: Summary of Parcels Impacted by 3-foot Sea Level Rise Change
Status Developed? Removed?
Number of
Parcels Total Acres
No Change N N 3,046 119,967.82
Y N 8,075 44,984.49
Risk Increase N N 4 103.45
Y N 3 77.05
Major Risk Increase
N N 3 2.60
Y N 2 0.51
Risk Decrease
N N 987 60,848.28
Y N 2,049 2,821.28
Major Risk Decrease
N N 12 5.61
N Y 8 3.72
Y N 92 24.71
36 Table 10: Summary of Parcels Impacted by 6-foot Sea Level Rise
Change
Status Developed? Removed? Number of Parcels Total Acres
No Change N N 3,904 121,384.93
Y N 10,584 47,304.60
Risk Increase N N 4 103.45
Y N 4 77.51
Major Risk Increase
N N 3 2.60
Y N 2 0.51
Risk Decrease
N N 1,539 61,052.05
N Y 7 1.88
Y N 4,005 3,457.38
Y Y 12 7.54
Major Risk Decrease
N N 27 12.04
N Y 439 205.45
Y N 193 55.83
37 Table 11: Current Land Use of Developed Parcels Vulnerable to 3-foot SLR
Land Use Number of
Parcels
Percent of Total Parcels
Apartments 11 0.08%
Boat slip (Condominium) 7 0.05%
Camper / RV Park 2 0.01%
Cemetery 40 0.28%
Charitable Housing 1 0.01%
Commercial Condominium 5 0.03%
Condo (Undeveloped Portion) 7 0.05%
Co-Ownership 24 0.17%
County of Dare (Improved) 39 0.27%
Duck (Improved) 1 0.01%
Federal Government (Improved) 12 0.08%
Fire / Community / Civic Building 14 0.10%
Forestry Use Value 4 0.03%
Historic Deferment 8 0.06%
Hotel 40 0.28%
Kill Devil Hills (Improved) 5 0.03%
Kitty Hawk (Improved) 7 0.05%
Leasehold 7 0.05%
Leasehold (Manufactured Home or Addition) 13 0.09%
Manteo (Improved) 8 0.06%
Manufacturing 16 0.11%
Multi Use 160 1.12%
Museum 2 0.01%
Nags Head (Improved) 26 0.18%
Nonprofit Organization (Improved) 6 0.04%
Other 394 2.75%
Plant Nursery 2 0.01%
Pollution Abatement and Recycling 1 0.01%
Private Utility 3 0.02%
Professional 36 0.25%
Property Owners Association (Improved) 35 0.24%
Public Utility 21 0.15%
Recreational 44 0.31%
Religious 30 0.21%
Religious (Part Exempt) 1 0.01%
Residential 8492 59.38%
Residential Condominium 63 0.44%
38
Residential Mobile Home Park 23 0.16%
Residential Other 22 0.15%
Residential Townhouse 5 0.03%
Residential with Manufactured Home (Real Estate) 207 1.45%
Residential with Mobile Home (Personal Property) 214 1.50%
Residential-B&B 4 0.03%
Restaurant 36 0.25%
Retail 62 0.43%
Sales / Service / Rentals 4 0.03%
Secondary Improvement (Prop Owners Assoc) 19 0.13%
Service 24 0.17%
Shared Interest Property 7 0.05%
State of NC (Improved) 25 0.17%
Temporary Code 4 0.03%
Timeshare 2 0.01%
Vacant Commercial Building 2 0.01%
Vacant Land (Dare County) 76 0.53%
Vacant Land (Federal Government) 35 0.24%
Vacant Land (Kill Devil Hills) 24 0.17%
Vacant Land (Kitty Hawk) 37 0.26%
Vacant Land (Manteo) 3 0.02%
Vacant Land (Nags Head) 30 0.21%
Vacant Land (Nonprofit) 15 0.10%
Vacant Land (Private) 3370 23.56%
Vacant Land (Property Owners Assoc) 138 0.96%
Vacant Land (Public Utility) 2 0.01%
Vacant Land (Religious) 4 0.03%
Vacant Land (State of NC) 123 0.86%
Warehouse 18 0.13%
Washed Out Lot 137 0.96%
Wholesale Distribution 14 0.10%
Working Waterfront 3 0.02%
(blank) 1 0.01%
39 Table 12: Current Land Use of Undeveloped Parcels Vulnerable to 3-foot SLR
Land Use Number of
Parcels
Percent of Total Parcels
Cemetery 40 0.99%
Condo (Undeveloped Portion) 4 0.10%
Fire / Community / Civic Building 2 0.05%
Forestry Use Value 3 0.07%
Leasehold 2 0.05%
Leasehold (Manufactured Home or Addition) 13 0.32%
Manteo (Improved) 1 0.02%
Multi Use 1 0.02%
Nags Head (Improved) 1 0.02%
Other 4 0.10%
Plant Nursery 1 0.02%
Private Utility 1 0.02%
Public Utility 1 0.02%
Religious 1 0.02%
Residential 11 0.27%
Residential Condominium 1 0.02%
Residential Master Card 6 0.15%
Residential Mobile Home Park 2 0.05%
Residential with Manufactured Home (Real Estate) 2 0.05%
Residential with Mobile Home (Personal Property) 1 0.02%
Retail 1 0.02%
Secondary Improvement (Prop Owners Assoc) 1 0.02%
Shared Interest Property 6 0.15%
Temporary Code 1 0.02%
Vacant Land (Dare County) 73 1.80%
Vacant Land (Federal Government) 34 0.84%
Vacant Land (Kill Devil Hills) 24 0.59%
Vacant Land (Kitty Hawk) 36 0.89%
Vacant Land (Manteo) 3 0.07%
Vacant Land (Nags Head) 30 0.74%
Vacant Land (Nonprofit) 15 0.37%
Vacant Land (Private) 3338 82.24%
Vacant Land (Property Owners Assoc) 136 3.35%
Vacant Land (Religious) 4 0.10%
Vacant Land (State of NC) 122 3.01%
Washed Out Lot 137 3.38%
40
Appendix B
Item 1
Floodplain Management Regulations Evaluation Protocol, based on ASFPM’s “A Guide for Higher Standards in Floodplain Management” (2013)
Category Points Standards
Freeboard
0 No higher standards applied
1 Minimum of 1-foot freeboard required in SFHA
2 Minimum of 2-foot freeboard required in SFHA freeboard required in 500-year floodplain and/or
Access
0 No higher standards applied
1 New planned developments and subdivisions for residential structures are required to have a natural grade with elevation not less than BFE and dry land access
2 Access requirements are also applied to new development of non-residential structures
Compensatory Storage
0 No higher standards applied
1 Fill in SFHA should result in no net loss of floodplain storage or increase in base flood elevations; any loss in storage should be offset by compensatory measures
Critical Development Protection
0 No higher standards applied
1 Critical facilities prohibited in SFHA; must be constructed to 1-foot above 500-year flood elevation
2 Critical facilities prohibited in SFHA and 500-year floodplain
Cumulative Substantial Damage/Improvement
0 No higher standards applied
1
Substantial damage also defines when damage equaling 25% or more of pre-event value and sustained on two separate
occasions during a 10-year period or substantial improvement also defines when cumulative value of all improvements made equal or exceed 50% of structure’s market value or when an addition increases floor area by 25% or more
2
Substantial damage also defines when damage equaling 25% or more of pre-event value and sustained on two separate
occasions during a 10-year period and substantial improvement also defines when cumulative value of all improvements made equal or exceed 50% of structure’s market value or when an addition increases floor area by 25% or more
Fill Standards 0 No higher standards applied