DANA P. LOOMIS. An Investigation of Radon in North Carolina Groundwater and Its Relationship to Rock Type. (Under the direction of JAMES E. WATSON).
Previous studies of radon-222 in North Carolina
groundwater supplies have shown that the state has some of the highest radon concentrations in the United States.
Reanalysis of existing environmental sampling data from 272 public water systems shows that the distribution of radon in North Carolina follows distinct geographical and geological patterns; a simple average concentration based on these samples would not provide a meaningful estimate of public
exposure to radon.
Variations in radon concentration are associated, in particular, with rock type. The highest radon
concentrations in North Carolina groundwater supplies are found in waters from areas in the Piedmont and Blue Ridge regions underlain by granites, and the lowest concentrations
(generally < 500 pCi/1) occur in aquifers of the coastal plain. Concentrations in most of the Piedmont region are intermediate (generally between 1000 and 5000 pCi/1). There appears to be no systematic relationship between radon
TABLE OF CONTENTS
INTRODUCTION ... 1
RADON IN DRINKING WATER...4
Radon in U.S. Drinking Water Supplies ... 4
Sources of Radon in Groundwater ... 8
Factors Affecting Radon Concentration ... 9
NORTH CAROLINA GEOLOGY AND HYDROLOGY ... 12
PREVIOUS RESEARCH ... 18
METHODS...24
RADON IN NORTH CAROLINA GROUNDWATER ... 29
Lithology and Radon Concentration ... 31
Effects of Water System Size...33
Discussion...39
MANAGEMENT CONSIDERATIONS ... 44
SUMMARY...45
XI LIST OF TABLES
Table 1. Radon in U.S. water supplies... 5 Table 2. Lithologic groups in this study ... ... 26 Table 3. Radon concentration and lithology ... 32 Table 4. Radon concentration and water system size ... 36
Table 5. Regression models for Rn and water system size . 38
Table 6. Rn in coastal plain minus fall-line samples . . 43
LIST OF FIGURES
Figure 1. Frequency of Rn concentrations in US water
supplies ... 7 Figure 2. Geologic map of North Carolina ... 13 Figure 3. Frequency of Rn concentrations in NC DHR data . 20 Figure 4. Frequency of Rn concentrations in US EPA data . 22 Figure 5. Correlation of NC DHR and US EPA duplicate
samples... . 28 Figure 6. Frequency of Rn concentrations in NC public
ACKNOWLEDGEMENT
This research was supported by the Groundwater Section
of the North Carolina Department of Natural Resources and
Community Development, Division of Environmental Management. I thank Mr. Perry Nelson, Mr. Ted Mew and all the staff of
the Groundwater Section for their interest in the issue and
for making this project possible. Valuable assistance and additional data were provided by Felix Fong of the North Carolina Department of Human Resources Radiation Protection Section and the Water Supply Branch of the Department of Human Resources; Thomas Horton of the U.S. EPA also provided original data from the EPA radon study. Financial support was provided by a U.S. Public Health Service Traineeship during the fall of 1985.
I also thank Professors James E. Watson and Douglas Crawford-Brown of the Department of Environmental Sciences and Engineering for their interest and many helpful
INTRODUCTION
Environmental radon in air and water has recently been
recognized as a major source of public exposure to ionizing radiation, largely as a result of measurements showing that radon concentrations in drinking water supplies and indoor atmospheres are high enough to produce a radiation dose significantly above that from outdoor background levels (e.
g. Gessell, 1983; Hess et. al., 1985; Nero, 1983). Radon which may enter buildings in drinking water is transferred to air by household water uses such as showering and
cleaning (Gessell and Prichard, 1980). In this way radon in
drinking water may cause three types of radiation exposure which can potentially affect human health; an external
whole-body dose, an ingestion exposure through drinking
radon-bearing water, and an inhalation exposure from
breathing the radon emitted to the indoor atmosphere. The airborne exposure pathway is of the greatest public health
concern because the inhalation dose is larger by far than tfie dose from other pathways (Cross et al., 1985).
Radon may enter indoor air by direct emanation from the
ground, from outdoor air, and from contaminated building materials as well as from water; the relative importance of
Even if other sources of indoor radon are disregarded,
however, many water supplies contain sufficiently high radon concentrations to provide a radiation dose which exceeds that from other environmental sources, both natural and artificial (Cross et al., 1985). Because of the widespread occurrence and often high concentrations of radon in ground water supplies this radiation dose presents a significant risk of lung cancer to the U.S. population. The lifetime lung-cancer risk from radon in drinking water has been estimated (e. g. Cross et al., 1985; Hess et al., 1985), although with considerable uncertainty (Crawford-Brown and Cothern, 1985), as approaching the total risk of lung cancer among U.S. non-smokers for radon concentrations which are common in North Carolina groundwaters, and may be much higher for individuals using waters with extremely high radon concentrations. Because of the magnitude of this estimated risk, it is important to understand the natural
factors which control the distribution of environmental
radon and are responsible for high radon concentrations in
groundwater supplies.
North Carolina has some of the highest concentrations recorded in groundwater in the United States (Hess et. al., 1985; Horton, 1983; Sasser and Watson, 1978). Earlier studies of radon in North Carolina (Aldrich et. al., 1975; Sasser and Watson, 1978; U.S. EPA, 1982) showed that
investigated on a statewide basis.
This study was undertaken for the Groundwater Section of the North Carolina Department of Natural Resources and Community Development to gain a better understanding of the distribution of radon in North Carolina groundwater, and to examine the relationship between radon concentration and aquifer lithology to determine if lithology could be used as
a criterion for the identification of areas in North
Carolina where groundwater use might be impacted by high radon concentrations. Reanalysis of radon data from other
studies (Aldrich et. al., 1975; U.S. EPA, 1982) shows that
radon concentration is related to aquifer lithology, and that distinct average radon concentrations are associated with major rock types. Groundwater from the North Carolina coastal plain has the lowest average radon level in the state, while the Piedmont and mountain regions have higher levels. The highest concentrations occur in areas in the Piedmont underlain by granitic rocks. These broad
lithologic associations also imply variation in other
geologic and hydrologic variables which are related to rock type, such as grain size, porosity, and groundwater flow
rate (Tanner, 1964a).
4
effictiveness of potential water quality standards for radon. In addition, the understanding gained through this
investigation of the broad geologic affinities of radon in North Carolina groundwater may help to identify other
factors which account for variability in radon
concentration.
RADON IN DRINKING WATER
Radon in U.S. Drinking Water Supplies
The distribution of radon in U.S. drinking water supplies has been reported by the U.S. Environmental
Protection Agency (U.S. EPA, 1982; Horton, 1983) and by Hess et al. (1985). Radon concentration in drinking water varies
over several orders of magnitude, from near zero to over
100,000 pCi/1. In general, surface waters contain virtually no measurable radon, but high concentrations may occur in groundwaters. The highest concentrations recorded in the U.S. are in private wells in Maine and New Hampshire which
exceed 300,000 pCi/1 (Brutsaert et al., 1981). Table 1
shows geometric mean radon concentrations in public and private groundwater supplies from 40 states. The highest
concentrations in groundwater occur, in addition to New
England, in the Appalachian states, the Rocky Mountain states, and California (Hess et al., 1985; Horton, 1983). Groundwaters in the Atlantic-Gulf coastal plain and the
Table 1. Radon in U.S. drinking water supplies,
modified from Hess at al. (1985).
Geometric mean Rn-222 in pCi/1; number of samples
in parentheses.
PRIVATE PUBLIC
ATE WELLJ GROUNDWATER SUPPLY
AL 120 (22) 70 132)
AR 230 ( 2) 12 ( 22)
AZ
-250 124)
CA 43 ( 6) 470 ( 15)
CO
-230 ( 76)
DE
-30 ( 72)
FL 6000 (34) 30 (327) GA 2100 ( 2) 67 (225)
lA
-220 85)
ID
-99 (155)
IL - 95
(314)
IN -ͣ
35 (185)
KS
-120 47)
KY 1500 (10) 32 (104)
MA 1000 ( 8) 500 (212)
ME 7000 (24)
-MN 1400 ( 1) 130 (233)
MO 0 ( 2) 24 (138)
MS
-23 (104)
MT 4300 ( 8) 230 71)
ND
-35 (133) NH 1400 (18) 940 ( 52)
NJ
-300 38)
NM 59 (59) 55 (171)
NV
-190 57) NY 1500 ( 4) 52 (292)
OH
-79 (165)
OK
-93 ( 33)
OR 450 (18) 120 69)
I*A 910 (16) 380 (105) RI 6500 (69) 2400 (575) SC 1100 (23) 130 (384) SD 4300 ( 2) 210 (155)
TN 0 ( 2) 12 ( 98)
UT
-150 195) VA 560 (42) 350 (284) VT 210 (23) 660 ( 71)
WI 730 (40) 150 (278)
WY ^
330 32)
(Hess et. al., 1985; Horton, 1983).
In addition to this geographic variation, nationwide
studies suggest that radon concentration varies among water systems of different sizes. Radon levels in private wells
are often several times concentrations in public water
supplies (Table 1), and among public water systems radon
concentration tends to decrease as the size of the
population served increases (Hess et al., 1985). This
systematic difference between small and large water systems
is apparently due to the longer retention times of water in large systems which allow some fraction of original radon to
decay or escape to the atmosphere before the water is used
(Brutsaert et al., 1981; Hess et al., 1985).
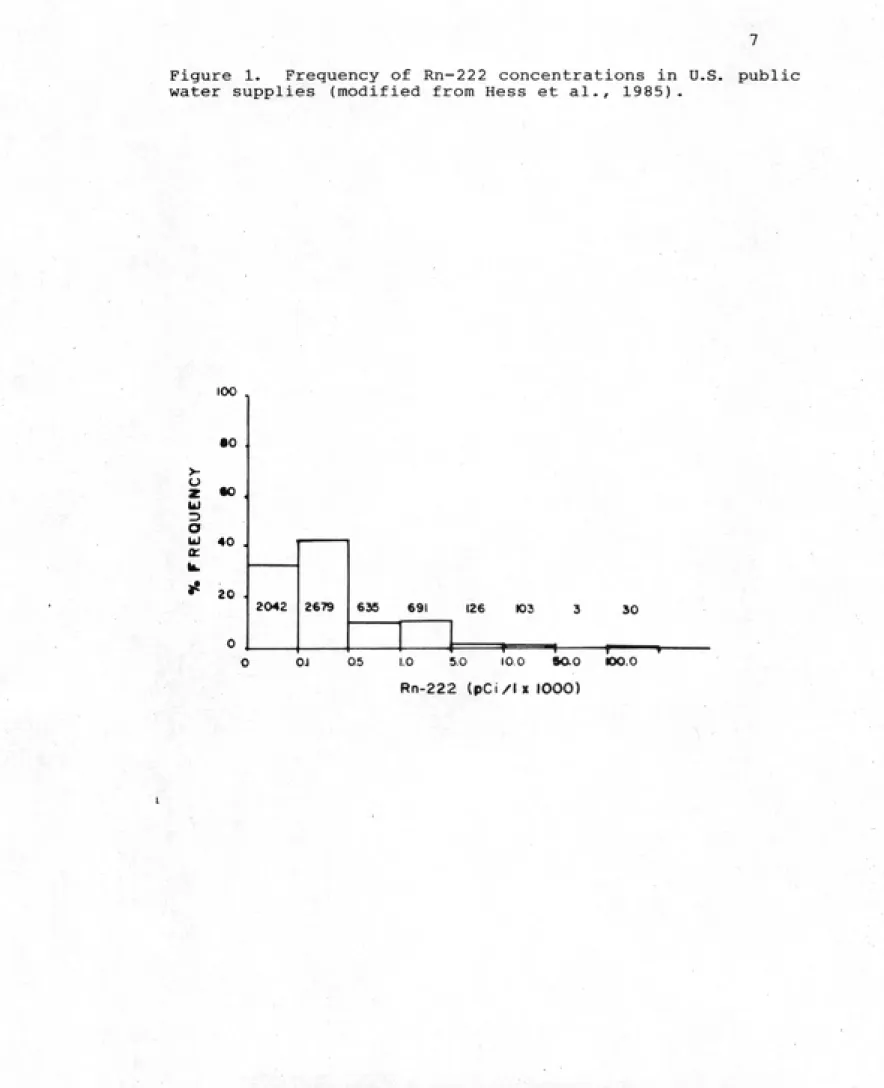
The frequency distribution of radon in U.S. public
groundwater supplies is shown in Figure 1. The figure shows
that radon concentrations in most of these systems (85%) is
below 1000 pCi/1 and that a substantial proportion (32%) are
below 100 pCi/1. Although the percentage of water systems
having extremely high radon concentrations over 10,000 pCi/1
is quite small, users of these waters bear a risk far above •associated with average levels of radon exposure.
Although the radon content of drinking water varies
geographically and with water system size the largest
variations are related to geologic factors. Radon in water
has been shown, in particular, to be strongly associated
Figure 1. Frequency of Rn-222 concentrations in U.S. public water supplies (modified from Hess et al., 1985) .
100
•0
u z *o
a bJ 40 .
>* 20
2042 2679 635 691 126 103 30
OJ Q5 1.0 5.0 10.0
----r— sao K>o.o
concentrations and their associated radiation exposures must be determined in respect to these factors.
Sources of Radon in Groundwater
The occurrence of radon in water is governed in large part by the concentration of its parent nuclides, uranium and radium, in rock and soil, and by physical variables
which control the emission of radon from solid materials
into water. The concentration of parent nuclides in rocks is a function of geologic history and of the geochemistry of the uranium decay chain. Uranium is widely distributed in the Earth's crust, and average uranium concentrations in many minerals and rocks are well known. The following abundances are from Rogers and Adams (1969); uranium concentrations from 1, to 10 ppm are characteristic of silicic igneous rocks, (granites, rhyolites, quartz monzonites, etc.); somewhat lower concentrations are charactristic of intermediate rocks, and much lower
concentrations, typically from .001 to 1 ppm, are found in
mafic and ultramafic rocks. Variation between different
rock bodies of the same type, or even within a single
pluton, may be considerable, however. Sedimentary rocks
have generally lower values, for example 0.45 ppm for quartz sandstones and 2.2 ppm for limestones, but marine
phosphorites and some unusual shales may contain
Factors affecting radon concentration
Patterns of radon occurrence in groundwater reflect, in
general, the major differences in the uranium content of common rocks. The consistent association of concentrations exceeding 100,000 pCi/1 with granitic terranes has been
observed repeatedly (Asikainen and Kahlos, 1979; Brutsaert
et. al, 1981; Snihs, 1973). Lower concentrations (generally < 500 pCi/1) have been observed in various sedimentary rocks
(Andrews and Wood, 1972; Gorgoni et al., 1982; Fukui and Katsurayama, 1983; King et al., 1982; Mitsch et al., 1984).
It might appear from these relationships that rock type is
the determinant of radon concentration in water. In fact,
many variables, only some of which are covariates of lithology, intervene between decay of uranium and measurement of radon in a well water sample. These
intermediate factors include
1) Geometry and mass of the radon source. Radon
concentrations in water may be affected not only by the concentration of parent nuclides in surrounding rocks, but by the absolute quantity of parent present. The ability of radon to enter water may be affected, in addition, by the
spatial distribution of nuclides within the rock.
2) Uranium-radium geochemistry. The extent to which radium, the immediate parent of radon, is in equilibrium with its progenitor uranium in geologic materials is largely a function of the degree to which the parent and its
processes. Pew data are available on radium in common
rocks, but its chemical behavior is quite different from that of uranium, so geochemical separation of parent and daughter might be expected in certain situations.
3) Emanation Fraction. Not all of radon produced by the
decay of radium in rocks escapes into air or water; the
ratio of radon escape to production is frequently called the
emanation fraction. The emanation fraction has been
measured in the laboratory for a variety of minerals, rocks, and soils and varies considerably among mineralogic and
lithologic types irrespective of uranium concentration
(Baretto, Clark, and Adams, 1975). Emanation fraction is inversely proportional to grain size (Andrews and Wood, 1972), and is enhanced by deep weathering or pervasive raicrofracturing, and when parent nuclides are distributed near the surface of mineral grains (Tanner, 1964a).
4) Dissolved radium. Radon may also be concentrated in water by decay of radium already in solution. In general,
dissolved radium levels are far lower than needed to support
observed radon concentrations and most investigators have
concluded that there is no relationship between dissolved
radium and radon (Tanner, 1964b; Snihs, 1972). No such relationship has been observed in studies of radium and radon in most areas in North Carolina (Lee, Watson, and Fong, 1979), but correlation between Ra and Rn has been
reported in the eastern Phosphate district of North Carolina
(Strain, Watson, and Fong, 1979) and between logRa and logRn
5) Radon Migration. Radon atoms which enter water-filled
pores may move from their original site by diffusion, in
which the radon atom moves relative to the water, or by
transport, in which the radon atom is carried by moving
water. Because radon is chemically inert it is not removed from groundwater by process other than diffusion and
radioactive decay. The factors which affect radon migration
through rocks are primarily hydrologic ones; these factors
include the diffusion constant of radon in water, degree of
saturation, groundwater flow rate, and the size and geometry of pore spaces in the rock matrix (Tanner, 1964a).
Migration is more rapid through fractures than in
intergranular porosity. In saturated, porous rock and soil, diffusion is inefficient and groundwater flow is the dominant factor in radon migration (Tanner, 1964a); the amount of radon transported from its original site is determined by the balance between flow rate and decay in
which high flow rates favor the maintenance of radon
activity near its original level (Andrews and Wood, 1972). 6) Temporal variations. Several investigators have
reported conflicting findings on the temporal stability of
radon concentration in wells repeatedly sampled over time. Michel and Moore (1980) reported stable radon concentrations
during one year of observation of wells in the South
Carolina coastal plain, but variation by a factor of 2-3 was
Radon concentration in these wells was positively correlated with rainfall, suggesting, perhaps, more efficient transport due to higher flow rates.
7) Well and water system design and use. Since groundwater samples must, in general, be obtained from wells, a number of variables related to well design and use may also affect the radon content measured in water samples. In addition to
the inverse relationship of radon concentration and water
system size (Hess et. al., 1985), Brutsaert et. al. (1981) reported a negative correlation between radon concentration and yield of 136 wells in Maine, and a positive correlation between radon concentration and well depth. Snihs (1973) found no evidence for the latter relationship in 37 wells in Sweden. Well pumping patterns may also affect the radon concentration of water samples; Fukui and Katsurayama (1983) reported small but consistent increases in radon activity after several hours pumping, presumably because induced flow brought new radon-laden water to the wellbore.
NORTH CAROLINA GEOLOGY AND HYDROLOGY
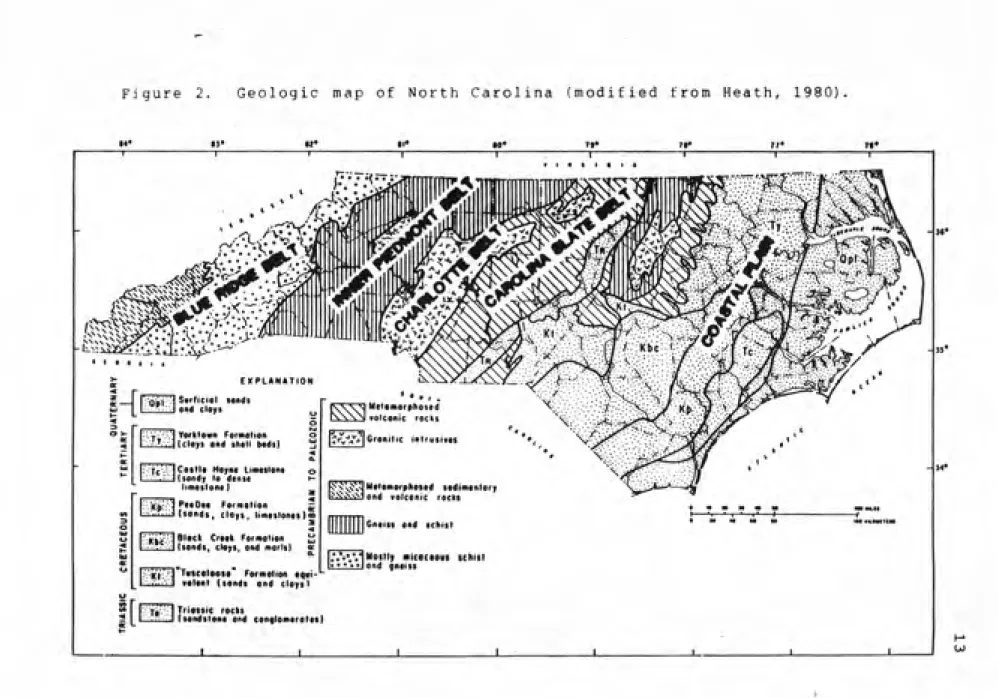
North Carolina can be geologically divided into a
series of northeast-trending belts as shown in Figure 2. The boundaries of the major belts correspond to the three natural physiographic regions of North Carolina; the coastal plain, the Piedmont, and the Blue Ridge region. About half
Figure 2. Geologic map of North Carolina (modified from Heath, 1980)
•»•
I • • • •< rr;
^"Xi-'x^.
' ' 1 • . . .
z o: —
u
EXPLANtTiOH
.Opi. Sarficial Mmtt
oad cloys
ͣ
'>.-1rcl<clofi Olid thtll bod>) ::Tc •. Cotllo HofOt LJmiloiii
.' Ktondy le dense
limtslone) :;k^!:'1 PetOee Forniolioii
Kbc
Msonds, cla,s, limesloinsln
Blocli Crt«» Formation " (sonds, cloys, ond marls) tc
a.
ͣ
JTrn'Toscolooso' Formation
tqni-.ill^ «olfiit (sonds ond cloys)
____ • • ., .
r;\V^ Melomorphosed
IvvOS KOlconic rocks I Granitic inlrusixi
|?T^^ Motamorpkofod stdi«Mt«ry K.>»>.\>1 end volconic rocks
Gntiss ond schist
• W M M « • M «•
[.*.^.*,^ Mostly micocooiis scliist
end gneiss
i[EM][;
lossic rockssandstone ond conilomerolesl
sedimentary rocks of the Atlantic coastal plain; these
strata form a sediment wedge which thickens eastward to over
10,000 ft at Cape Hatteras (Stuckey, 1965). The coastal
plain sequence is divided into many formally-named geologic
units, but a somewhat simpler system of nomenclature is
generally used in hydrologic reports. Groundwater is
obtained from four major aquifers in the coastal plain,
which are known informally as the Cretaceous aquifer, the
Castle Hayne aquifer. The Yorktown aquifer and the surficial
aquifer, in decreasing order of depth (Heath, 1980). The
relative positions of these aquifers in the geologic
sequence reflect the order of their formally-designated
counterparts, but the boundaries of these aquifers do not
correspond precisely to those of the formal geologic units.
The Castle Hayne aquifer is the principal water source in the eastern coastal plain (Cederstrom et al., 1979;
Heath, 1980). It is a confined aquifer of semi-consolidated
limestone and shell beds which stores and transmits
groundwater in voids created by limestone solution. Large
wells which may yield over 1000 gal/min are common in the
Castle Hayne aquifer (Heath, 1980). In the western portion
of the coastal plain the Castle Hayne is absent and groundwater is obtained instead from sand and gravel
aquifers in the Cretaceous, Yorktown, and surficial units.
Many wells in this area are completed in multiple water¬
bearing zones and may mix groundwaters from aquifers of
different ages and lithologies. The Cretaceous aquifer is
15
coastal plain (Heath, 1980) where the Yorktown Formation has
been removed by erosion (Stuckey and Conrad, 1958). The aquifer consists of three formal geologic units; the Tuscaloosa Formation, the Black Creek Formation and the
Peedee Formation (Heath, 1980). The Peedee and Black Creek
formations are lithologically complex units containing
sands, clay, and shell beds (Stuckey and Conrad, 1958), but are not highly productive as aquifers (Cederstrom et al.,
1979). The name Tuscaloosa is to be eliminated from formal
use on the latest geologic map of North Carolina (in press). Nevertheless, because of its long use in the state and its frequent citation in hydrologic reports it will be used
throughout this report. The Tuscaloosa is a highly
productive sand aquifer which is a major groundwater source
throughout the Atlantic-Gulf coastal plain (Cederstrom et al., 1979). Where it is exposed in North Carolina the
Tuscaloosa consists of sedimentary material derived from erosion of Piedmont crystalline rocks, including granites,
gneisses, and schists (Stuckey and Conrad, 1958).
The sediments of the coastal plain overlie much older
Precambrian and Palezoic igneous and metamorphic rocks which
emerge from beneath the coastal plain sequence along a northeast-trending zone called the fall-line. These
complexly faulted and deformed rocks form the bedrock of the Piedmont region, and include the rocks of the Carolina Slate Belt and the Inner Piedmont Belt (Fig.2). The Carolina
metasedimentary rocks, while the Inner Piedmont belt consists principally of gneisses and schists (King, 1955)
metamorphosed up to the sillimanite zone (Butler, 1972; Overstreet, 1955). These rocks are intruded by clusters of Paleozoic plutons (Fullagar, 1971) which form the Raleigh belt and Charlotte belt (Fig. 2). These plutonic rocks are primarily granitic, but the Charlotte belt also includes significant areas of mafic igneous rocks (King, 1955). In
several areas rocks of the Carolina Slate Belt and Inner
Piedmont Belt are overlain by unmetamorphosed sedimentary rocks of Triassic age, deposited in northeast-trending basins (Fig. 2) bounded by faults. The lithology of the Triassic rocks is variable and includes sandstones,
conglomerates, shales, siltstones and small amounts of limestone and coal (Stuckey, 1965). Small areas underlain by other rocks, including marbles and quartzites and
conglomerates are also present in the Piedmont (Overstreet,
1955) .
The Blue Ridge Belt in the far west is underlain by
Precambrian granites and gneisses and Precambrian to early Paleozoic metasedimentary rocks (King, 1955). All of the Blue Ridge Belt rocks are metamorphosed to some extent. Blue Ridge granites and gneisses are similar in general to those in the Piedmont, and vary in degree of metamorphism
from biotite to sillimanite zone (Butler, 1972). The
Precambrian metasedimentary rocks of the Blue Ridge belt are
significantly different from other metasediments in North
17
southwestern North Carolina including Cherokee, Graham, and Swain counties and adjacent areas (Fig. 2). These rocks,
formally assigned to the Ocoee Supergroup, were derived from
the erosion of crystalline rocks similar to the granites and gneisses now exposed in the Blue Ridge, and their bulk
composition is approximately that of granitic igneous rocks (Hadley, 1970). Small areas of other metasedimentary rocks
are also exposed in the Blue Ridge Belt (King, 1955; Stuckey
and Conrad, 1958).
Although the geology of the Piedmont and Blue Ridge regions is quite complex the hydrologic behavior of the major rock units is so similar that they can be regarded as
a single hydrologic region (Heath, 1980). The crystalline
rock aquifers of the Piedmont and Blue Ridge regions are
much less productive than coastal plain sediments; typical
well yields in the Piedmont are less than 100 gal/min
(Cederstrom et al., 1979). In areas underlain by
crystalline rocks groundwater is stored primarily in the saprolite (highly weathered rock material) which overlies bedrock and transmitted to discharge areas and wells by networks of fractures within the bedrock (LeGrand, 1967; Heath, 1980). Well yields tend to be higher in areas of
dense fracturing where fractures are interconnected
(Cederstrom et al., 1979). In general, rocks of the Ocoee
Series and the Inner Piedmont Belt are the most productive
PREVIOUS RESEARCH
Several studies have been conducted on radon in North
Carolina groundwater. Strain et al. (1979) and Mitsch et
al. (1984) examined the local effects of phosphate ore
extraction and processing in eastern North Carolina.
Mitsch et al. found large variations in the radon content of
groundwater samples from 116 wells producing from several aquifers in the phosphate district, but concluded that there
was no pattern of radon distribution which could be attributed to the activities of the phosphate industry. The occurrence of radon in groundwater has been surveyed statewide in two environmental sampling programs; one
conducted by the Radiation Protection Section of the North Carolina Department of Human Resources (Aldrich et al., 1975; Sasser and Watson, 1978) and the other by the U.S. Environmental Protection Agency (U.S. EPA, 1982; Horton,
1983).
Both statewide studies showed that measurable quantities of radon are present in many North Carolina
groundwaters, and that the concentration of radon in these
waters has a range of at least four orders of magnitude, from near zero to over 46,000 pCi/1. Geological data were
not systematically collected and no geologic analysis of the
radon data was presented in reports of either study. In
19
these two studies, they differ significantly in intent and
methodology.
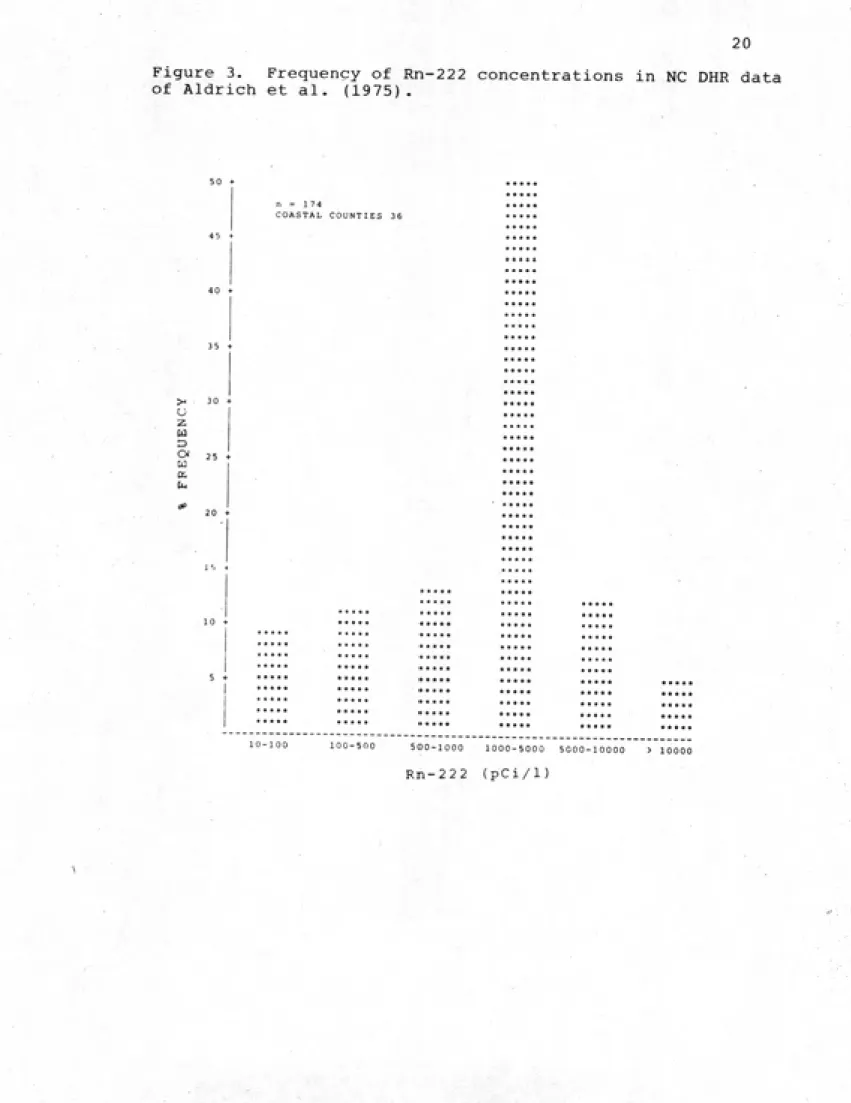
Differences in sampling philosophy, in particular,
appear to have had a major effect on the composition of the
two data sets. The North Carolina Department of Human
Resources (DHR) study of radon (Aldrich et al., 1975) was
intended primarily to identify areas of high radon
concentration. The investigators used prior knowledge to
locate and sample wells where radon concentrations could be
expected to be high (Aldrich et al., 1975; Felix S. W. Fong,
personal communication, 1985). The locations sampled in
this study are predominantly in the Piedmont and Blue Ridge
regions of North Carolina, and are clustered in several
counties which account for a large proportion of the sample.
Wake County contains 10% of the locations and Catawba,
Rockingham, Rowan, and Surry counties were also heavily
sampled. The field procedures used in the DHR study were
designed to obtain a sample of water as produced at the
well. The reported concentrations can therefore be expected
to represent the maximum concentrations to which users of
water from the sampled wells could be exposed. Only
groundwater supplies were sampled in the NC DHR study, and
most of the samples were taken from small public water
systems serving several hundred people, or less, such as
trailer parks and subdivisions. Because of the selection of
areas of known high radon concentration, the predominance of
sample locations in the Piedmont and the generally small
Figure 3. Frequency of Rn-222 concentrations in NC DHR data
of Aldrich et al. (1975).
D
n = 174
COASTAL Counties 36
*«•«*
***** ***** ***** ***** ***** *****
***** ***** *****
r * * « * r * * * *
* * * * *
* * * * *
» * * * * t * * * *
500-1000 1000-5000 5000-10000 > 10000
21
the DHR study could be expected, a priori, to be biased
toward high radon concentrations. Figure 3 shows the
frequency distribution of radon concentrations from this
study and the number of observations from coastal versus
Piedmont and mountain counties. The expected predominance
of high values is manifested in the large number of
observations in the 1000-10,000 pCi/1 range.
The EPA study of radon in North Carolina groundwater
was part of a nationwide program to estimate population
exposure to radon and other naturally-occurring
radionuclides in public water supplies (Horton, 1983). The
design of the EPA study emphasized collecting a sample
representative of the water actually consumed by the
majority of groundwater users in the United States. EPA's
sampling criteria called for the collection only of finished
water from public systems serving 1000 people or more.
Samples were collected as close to the water source as
possible, to minimize the effects to radioactive decay, and
composite samples were taken from multiwell systems. In
North Carolina several of the systems sampled did use
surface water or a mixture of surface and groundwaters, and
many were smaller than the 1000 customer criterion. Actual
sample collection was done for EPA by the Radiation
Protection Section of NC DHR.
EPA's sampling criteria resulted in the collection of a
more geographically uniform sample than in the DHR study,
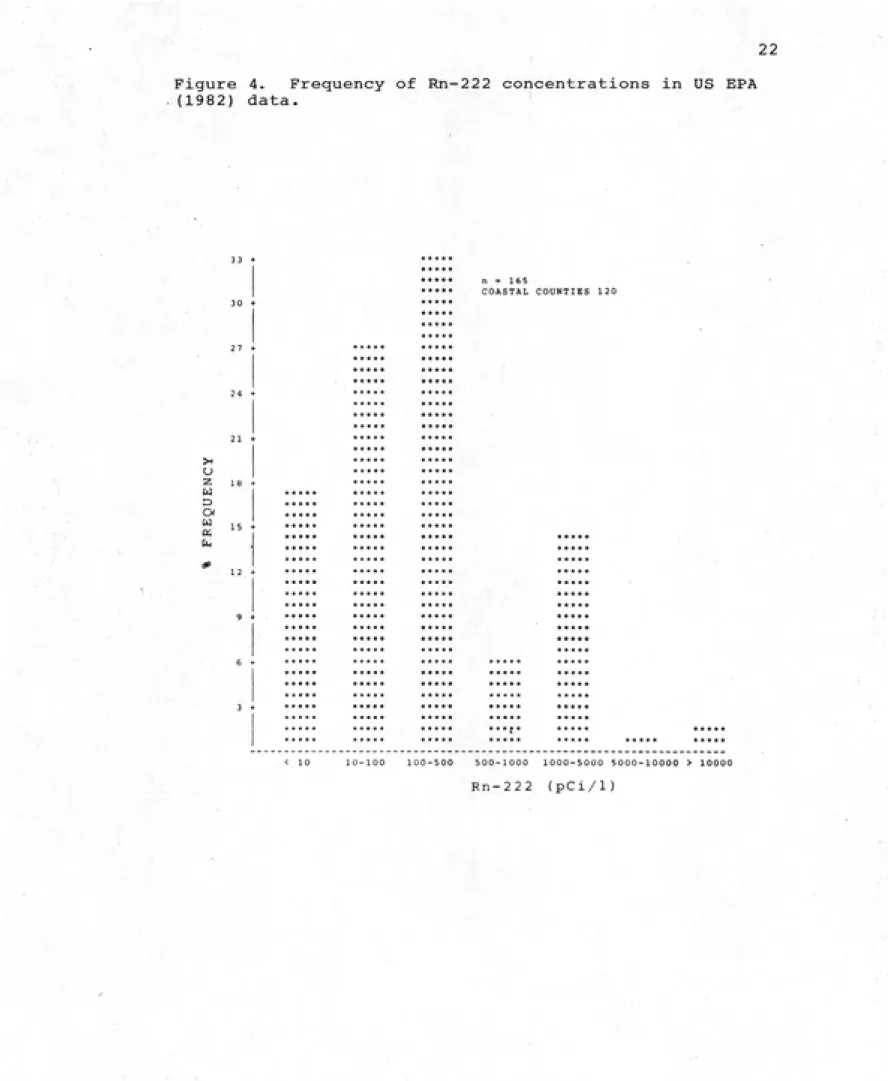
Figure 4. Frequency of Rn-222 concentrations in US EPA (1982) data.
>< (J
2 It
M O a
* * * * * *
* • * * * *
* * * * * * * * *
n = 165
COASTAL COUNTIES 120
10-100 100-500 500-1000 1000-5000 5000-10000 > 10000
23
in the coastal plain counties (Fig.4) , perhaps because of
the relative scarcity of large groundwater systems in the
western portion of North Carolina. Other studies indicate
that radon concentrations are generally low in the Atlantic
coastal plain (Hess et al., 1985; Horton, 1983; King et al.,
1982). As expecxted the EPA data (Fig. 4) shows mostly low
radon concentrations.
In addition to these large differences in sampling
criteria, the DHR and EPA radon studies also employed
different analytical methods for determining radon activity.
EPA used a liquid scintillation counting technique, while NC
DHR use a gas-emanation (Lucas cell) technique. Although
measurements by the two techniques should be comparable and
calibration tests performed for the EPA research (Horton,
1983) indicate no significant differences between analyses
measured with liquid scintillation versus other techniques,
the comparabitly of North Carolina data using different
analytical methods has been questioned (Fong and Penny,
1981). The comparability of these methods is discussed
further in the description of methods used in the present
METHODS
The conclusions of this study are based on analyses of
all available North Carolina environmental radon data
collected in earlier statewide studies (Aldrich et al.,
1975; Sasser and Watson, 1978; U.S. EPA, 1982). Names and
localities of the sampled water systems were obtained
directly from NC DHR and EPA. EPA also provided field data
sheets for each water sample, giving a brief description of
the sampled water system including number of wells in the
system, number of individuals served, and for some systems,
well depth and pumped aquifer. All of the water samples
were collected from public water systems, so detailed
information on system location, water source, and number of
customers could be obtained through the Water Supply Branch
of NC DHR, which maintains extensive records on all public
water systems. Systems listed in Water Supply Branch
records as using surface water or a mixture of surface water
and groundwater were eliminated from the data set, leaving a
working data set of 295 radon analyses.
For geologic analysis, radon concentrations were
plotted on a 1:500,000 geologic map of North Carolina (N.C.
Dept. of Conservation and Development, 1958) using well
location information from records of the NC DHR Water Supply
25
Groundwater .Section of the NC Department of Natural
Resources and Community Development (NC DNRCD). Each of 272
samples which could be plotted on the map was assigned to
one of the lithologic categories in Table 2 according to its
location on the geologic map. An initial attempt was made
to obtain lithologic descriptons of aquifers in each of the
sampled wells through the well records of the NC DNRCD
Groundwater Section, but this procedure had to be abandoned
because data were only available for a small proportion of
the wells and these were mostly in the form of unreliable
drillers' logs. Although detailed lithologic descriptions
of producing aquifers could not be obtained for most of the
wells, the units shown on the geologic map are a
sufficiently reliable and consistent reflection of the
composition of aquifers in the Piedmont and mountain regions
where groundwaters are drawn from crystalline rock bodies or
from saprolite derived from them. Coastal plain locations
were simply assigned to the general coastal plain
lithologic group because the data which could be obtained
for most wells were insufficiently detailed to allow
aquifers in the sedimentary sequence to be differentiated.
The practice of combining observations from different
aquifers is imprecise, but should not distort the results of
this study because differences between the radon
concentrations of groundwater samples from the coastal plain
relative to other areas can be expected to be larger than
differences among the aquifers whch make up the coastal
Table 2. Lithologic groups
GROUP
Granites
Precambrian
sedimentary
rocks
Gneiss & Schist
Metavolcanic rocks
DESCRIPTION
Paleozoic and Precambrian granitoid rocks of the Piedmont and Blue Ridge. sandstone, conglomerate, graywacke and other sedimentary and metasedimentary rocks of the Ocoee Supergroup.
all gneisses and schists of Piedmont and Blue Ridge, including Brevard Schist, Henderson Gneiss, Cranberry
Gneiss, and others.
early Paleozoic metavolcanic and associated metasedimentary rocks of the Carolina slate belt.
Mafic igneous
rocks diorite and gabbro of the Charlottebelt.
Metasedimentary
rocks
Coastal plain
sediments
quartzite, marble, and associated metasedimentary rocks of the King's Mountain and Murphy belts.
all Mesozoic and Cenozoic clastic
27
data were available were also treated separately with
respect to aquifer in the data analysis.
The working data set was also examined to determine if
loss of data might have altered its geographic or
quantitative distribution. The frequency distribution of
the radon concentratons in unaggregated data taken from the
NC DHR and EPA studies is virtually the same as the
distribution in the original studies. Likewise, the
relative proportion of the sample in each North Carolina
county is virtually unchanged in the final data set. The
close match between the original data and those used in this
study with respect to radon concentration and geographic
distribution means that the results of the present study are
unlikely to be biased by loss of data. This implies, in
addition, that differences between the conclusions of this
study and any which might be drawn from separate
consideration of either primary data set are due to the
effects of combining the earlier data and to the
different analytic approach of this study.
The two original data sets were also tested for
comparability because different methods of sample analysis
were used in the NC DHR and EPA studies, as discussed above.
This comparison was facilitated by the fact that twenty-one
water systems were sampled in both studies. Regression
analysis of EPA versus NC DHR results (Fig. 5) yields a
slope of 0.75 and a highly-significant (P < 0.0001) Pearson
correlation coefficient of 0.75. Results from the two
methods are highly correlated and although the slope is not
Figure 5.
samples.
Correlation of NC DHR and US EPA duplicate
14,000 J
liOOT)
12,0004
ILOui-4
IO,00(>l
CM
Ol 90004 (M
8000
7000
6001
^ 50uC 4
4o00
Q 3000
zuOij
loco
a«5l5 b-0.75 r«0.75
1000 2000 3000 4000 5000 6000 7C00 8000 9000 10,00c 11,000
29
equal to 1 this does not appear to imply that there is a
systematic difference in values between the studies. Visual
inspection of the plot shows that most of the values fall
approximately along a 1:1 line and that the deviation of the
calculated slope from 1 is due primarily to several outliers
in the data. In addition, a paired t-test for the
difference in mean Radon concentration in the systems
sampled in both studies yielded a non-significant value of t
(t = 0.0123) , indicating that the data sets are
indistinguishable at the 90% confidence level. Because of
these results the data from both studies were used in raw
form without any adjustment for differences in methodology.
RADON IN NORTH CAROLINA GROUNDWATER
The frequency distribution of radon concentrations in 272 groundwater samples from North Carolina public water
supplies is shown in Figure 6. Note that combining data
from the earlier studies smoothes the skewed distributions
(Figs. 3 and 4) that resulted from sampling bias in these
studies.
The distribution of radon in North Carolina is quite
different from that for the entire United States (Fig. 1) in
that a much higher proportion (41%) of the water systems
sampled contain over 1000 pCi Rn-222/1. This difference
suggests that population exposure to radon in North Carolina
Figure 6. Frequency of Rn-222 concentrations in North
Carolina public groundwater supplies (272 samples).
Z IB
u D
o
W 15 + b
<*> 12
10-100 100-500 500-1000 1000-5000 5000-10000 >10000
31
geometric mean radon concentration of 180 pCi/1 for 6300
public water supplies in the United States has been reported
by Hess et al. (1985). Although it might be of interest to
calculate such an average for North Carolina using these data, the result would not be meaningful because the sample is not randomized on geologic variables. A more meaningful estimate can be made by examining radon concentration in
relation to lithology.
Lithology and radon concentration
Average radon concentrations and concentration ranges
for eight North Carolina rock groups are shown in Table 3.
Most of the radon values (94%) are from coastal plain
sedimentary rocks, gneiss and schist, metavolcanic rocks,
and granites; these rock types together make up most of North Carolina's land area (Fig. 2). Several other
lithologic groups, including Precambrian sedimentary rocks
of the Ocoee Supergroup, sedimentary rocks of Triassic
basins, and mafic igneous rocks, which account for a minor
proportion of the state's area, are also included in the
sample.
The lowest radon concentrations are found in the
coastal plain. Low values are also associated with mafic igneous rocks (5 observations) in the Charlotte Belt. The
highest average concentration, as well as the highest
measured values, are found in areas in the Piedmont
underlain by granites. Intermediate average radon
ITHOLOGY NUMBER
GRANITE 24
PRECAMBRIAN SED. 2
GNEISS/SCHIST 71 METAVOLCANIC 21
TRIASSIC 6
METASEDIMENTARY 4
MAFIC 5
COASTAL PLAIN 139
ARITH. MEAN GEOM. MEAN
10562.6 7090.65 2244.38 1348.86 909.75 834.25 527.35 426 5909.7 5259.99 1502.35 1183.9 499.12 645.05 263.99 48.28
5th PCT. 515.67 2335.13 170.66 481.52 41.69 303.22 34.^2 ND
95th PCT. 43871.3 1186.2 7703.6 3354.8 1766.8 1510.55 1139.00 2508.2
CASTLE HAYNE AQUIFER 22
PEEDEE-BLACK CREEK 6
TUSCALOOSA AQUIFER 15
93.6 40.55 563.01 14.07 7.52 215.53 ND ND ND 642.43 178.6 2278.37
32
and schists which underlie most of the Piedmont and Blue
Ridge regions. Although the radon levels associated with these widely-exposed rocks are low compared to those in granitic areas they are still significantly higher than the U.S. average. Figure 7 shows the influence of the major rock groups on the distribution of radon in groundwater. Observations from the coastal plain dominate the lower part of the concentration range, while values from igneous and metamorphic terranes in the Piedmont and Blue Ridge populate the upper part of the range, and virtually all of the high values over 10,000 pCi/1 are associated with granitic areas.
The variation in average radon concentrations shown in
Table 3 shows that radon concentration in groundwater is a
function of lithology in North Carolina. Other variables, some of which are themselves related to lithology, may also
have large effects on radon concentration. One such factor
which has been cited by other investigators is water systen
size; the relationship of radon concentration with water
system size in North Carolina is discussed in the following
section.
Effects of water system size
Some investigators have found evidence of an inverse
relationship between water system size (i.e., number of individuals served) and radon concentration (Brutsaert et
al., 1981; Hess et al., 1985). This relationship may be
more than fortuitous. Hess et al. (1985) have made
34
Figure 7. Frequency of Rn-222 in North Carolina groundwater
by lithology (data as in Fig. 6).
u z M D O w Cm DDDDD BEBBB AAAAA AAAAA AAAAA AAAAA AAAAA AAAAA AAAAA AAAAA AAAAA AAAAA AAAAA AAAAA AAAAA AAAAA AAAAA AAAAA AAAAA AAAAA AAAAA AAAAA AAAAA AAAAA AAAAA AAAAA AAAAA AAAAA AAAAA AAAAA AAAAA AAAAA AAAAA AAAAA AAAAA AAAAA < 10 10-100
FFFFF EEEEE BBBBB BBBBB AAAAA AAAAA AAAAA AAAAA AAAAA AAAAA AAAAA AAAAA AAAAA AAAAA AAAAA AAAAA AAAAA AAAAA AAAAA AAAAA AAAAA AAAAA AAAAA AAAAA AAAAA AAAAA AAAAA AAAAA AAAAA FFFFF FFFFF DDDDD BBBBB BBBBB BBBBB BBBBB BBBBB AAAAA AAAAA AAAAA AAAAA HHHHH HHHHH FFFFF FFFFF FFFFF FFFFF FFFFF FFFFF FFFFF EEEEE CCCCC CCCCC BBBBB BBBBB BBBBB BBBBB BEB3E BBBBB BBBBB BBBBB BBBBB BBBBB BBBBB BBBBB BBBBB BBBBB BBBBB BBBBB BBBBB BBBBB BBBBB BBBBB BBBBB BBBBB AAAAA AAAAA AAAAA AAAAA AAAAA CCCCC CCCCC CCCCC CCCCC CCCCC BBBBB BBBBB BBBBB CCCCC CCCCC CCCCC
100-500 500-1000 1000-5000 5000-10000 >10000
Rn-222 (pCi/1)
A = Coastal Plain; B =
E = metasidimentary; F
H = Triassic.
gneiss; C * granite; D = mafic
concentrations in water systems serving populations of
different sizes. This approach presumes that radon
concentration is systematically related to system size and
that radon levels can be predicted by population. It can be
argued that such a functional relationship should exist
between water system size and radon concentration because
radon is more likely to escape to the atmosphere during the
aeration that typically accompanies water treatment in
larger public water systems, or to decay before it is
transmitted to users through extensive distribution
systems. Because of the potential importance of water
system size as a predictor of radon concentration. North
Carolina radon data were also analyzed with respect to this
variable to determine if system size is systematically
related to radon concentration in the state.
Table 4 gives average radon concentrations for
population classes similar those used by Hess et al (1985).
These values in the table decrease with water system size.
But, Table 5 shows mean population sizes of water systems by
lithologic group. It is apparent from this table that mean
system size varies among lithologic groups, and that systems
in the coastal plain tend to be larger than those in other
parts of North Carlina. Therefore, the apparent variation
of radon concentration with system size in Table 4 is not
independent of lithology. To examine the relationship of
water system size and radon concentration independent of
Radon (pCi/l)
INDIVIDUALS SERVED n ARITH. MEAN GEOM. MEAN MIN. MAX.
< 100 36 3342.72
1652.43 30.39 35552.45
100-1000 102 3006.02 671.82
ND 46644.53
1000-5000 110 583.33 92.76
ND 5830.41
5000-10000 16 276.56 21.33 ND 1598.03
> 10000 3 42.13 39.3 26.9
37
within each lithologic group using the model:
radon = A + B (population).
Regression coefficients are given in Table 5. If there is a
systematic negative effect of population on radon
concentration independent of lithology the slope (b) should
be negative in each group and radon should be negatively
correlated with population. Among lithologic groups,
however, the regression lines have both positive and
negative slopes and the degree of correlation between radon
and population is low (Table 5). This suggests that in
North Carolina water system size does not affect radon
concentration independently of lithology. The apparent
inverse relationship between water system size and radon
concentration in Table 4 is due to differential distribution
of different-size water systems among lithologic groups.
This is largely a result of the different hydrologic
properties of these rock groups. Because of the low
productivity of most Piedmont aquifers, large municipal
water systems in that part of North Carolina must generally
use surface water, and only relatively small public water
supplies rely on groundwater. Larger systems in the coastal
plain, on the other hand, typically do use groundwater. The
distinctly different hydrologic characteristics of Piedmont
and coastal plain regions thus have a large effect on the
overall relationship of radon concentration and water system
size in North Carolina. Essentially the same aquifers and
similar patterns of groundwater use are present throughout
TABLE 5. Regression models for radon and water system size.
SIZE
LITHOLOGY n MEAN S.D. a b r P
coastal plain 139 2659 3323 585.8 -0.06 -0.16 0.07
gneiss/schist 71 644 760 2467.4 -0.27
-0.1 0.42
granite 24 343 304 6543.67 8.52 0.25 0.25
mafic igneous 5 1503 1230 318.58
0.21 0.35 0.56
metasediments 4 495 507 1406.6 -1.15 -0.95 0.05
metavolcanics 21 1208 1422 1355.43 -0.01 -0.01 0.96
triassic 6 1056 920 723.66 0.18 0.24 0.65
TOTAL 272 1715
157 2305 -0.29 -0.18 0.003
Model: radon = A + (B)number of individuals
*
size = number of individuals served by water system.
n = number of samples.
^
39
may similarly affect radon distribution throughout the
region.
These results further emphasize the important influence
of geologic and hydrologic variables on radon concentration,
and strongly suggest that water system size is not an
independent predictor of radon concentration.
Discussion
The radon concentration of groundwaters from the
aquifers considered here is largely consistent with results
in other areas and with known relative average uranium
concentrations for each rock type. The association of very
high radon concentrations with granites has been observed in
other areas (e.g., Asikainen and Kahlos, 1979; Brutsaert,
1981; Snihs, 1973), but the high values from the
metasedimentary rocks of Ocoee Supergroup (2 observations)
may be surprising. Although the estimated average
concentration in this group is unstable, high radon
concentrations might reasonably be expected to occur in this
aquifer because its mineralogic composition is similar to
granite (Hadley, 1970). In addition, the Ocoee is
metamorphosed to high rank (sillimanite zone) in some areas.
Brutsaert et al. (1981) reported an arithmetic mean radon
concentration of 13,630 pCi/1 in sillimanite-grade aquifers
in Maine. The relative radon concentrations of groundwaters
from other minor aquifers also appear to be generally
consistent with relationships between lithology and radon
concentration of groundwater from the Triassic basins (6
observations) reflects the overall lithologic similarity of
the Triassic sediments to the Piedmont rocks from which they
were derived. Additional samples would probably be required
to characterize the full range and distribution of radon
concentration in the Triassic rocks because they are quite
lithologically diverse. The low radon concentration of
mafic igneous rock aquifers (5 observations) is consistent
with the known average uranium concentration of these rocks,
which is orders of magnitude below that of granite.
Groundwaters from metamorphic rock aquifers in the
Piedmont and Blue Ridge together with those from coastal
plain aquifers account for most of the observations in the
sample; average radon concentrations from these groups show
that a distinct break exists between radon levels in the
coastal plain versus the Piedmont and Blue Ridge regions.
The gap in average radon concentration between coastal
plain and Piedmont aquifers in North Carolina is similar in
magnitude to the discontinuity reported in geometric mean
radon concentrations of 158.5 and 2511.9 pCi/1,
respectively, in the South Carolina coastal plain and
Piedmont (King et al., 1982). In spite of their distinct
differences from each other, the coastal plain,
gneiss/schist, and metavolcanic lithologic groups are broad
categories which include rocks with different chemical
compositions and physical and hydrologic properties which
41
could not be obtained to evaluate other geologic and
hydrologic sources of variability in radon concentration
within lithologic groups in the Piedmont and Blue Ridge
because well records are poor in crystalline rock areas of
North Carolina. It was possible, however, to conduct a
more detailed analysis of the coastal plain sample.
The coastal plain group, with 139 observations, is the
largest and perhaps the most geologically varied of the
lithologic groups considered here. Several aquifers of
different age and lithology are utilized in the coastal
plain, and primary data on the aquifers being pumped were
available for a few of the sampled wells. Average radon
concentrations were determined separately for each aquifer
for which data were available (Table 3). The differences
between these average concentrations are geologically
significant. The average radon content of the Castle Hayne
aquifer which supplies water to a large portion of eastern
North Carolina is quite low (Table 3); this average is
similar to that observed by Mitsch et al. (1984) in the
Castle Hayne. The higher concentrations in the Tuscaloosa
aquifer may be a result of its compositional similarity to
the Piedmont crystalline rocks it overlies (Stuckey and
Conrad, 1958). Differences between the average radon
concentrations of coastal plain aquifers are a potential
source of variability within the combined coastal plain
group. There is also a spatial pattern to variations in
concentration.
pCi/1 occur along the fall line at the dissected western edge of the coastal plain. Several of the highest anomalous
values occur in wells located where the western edge of the
coastal plain overlaps Piedmont granites. The coastal plain sedimentary rocks are thin near the fall line and it is
possible that some of the anomalous wells may have been drilled through the coastal plain sediments to granites beneath. High radon concentrations in coastal plain
aquifers may also be due to sedimentological concentration
of rock and mineral fragments eroded from Piedmont crystalline rocks in sedimentary units such as the
Tuscaloosa which overlie crystalline rocks. Alternatively,
Michel and Moore (1980) suggested that uranium from Piedmont crstalline rocks may be geochemically concentrated in the upper coastal plain. Anomalous concentrations of radium,
the immediate parent of radon, have also been observed along
the fall line in North Carolina (Menetrez and Watson, 1983)
and South Carolina (Michel and Moore, 1980). Although the
reasons for these radiological anomalies are not clear, it
appears that an average radon concentration which excluded
observations from along the fall line would be more
representative of the region. Removing measurements from
along the fall line, including those which were not
anomalously high, reduces the average radon concentrations
and the range of concentrations significantly as shown in
43
Table 6. Rn-222 in Coastal Plain minus fall-line samples,
n ARITH. MEAN GEOM. MEAN MAXIMUM MINIMUM
127 148.72 72.2 2727.33 ND*
Not detectable above background.
It should be emphasized that although these revised values
may be more representative of the coastal plain as a whole,
the high concentrations along the fall line are an important
determinant of radon exposure in that area.
The importance of other variables, in addition to
lithology, which affect radon concentration should also be
considered although they can not be evaluated directly from
the data used here. The observed relationship between
lithology and radon concentration may be a function, in
part, of other factors which are correlated with lithology.
Perhaps the most important of these lithology-related
variables are the large differences between the hydrologic
characteristics of aquifers in the coastal plain and the
rest of North Carolina. All of these factors need
additional study. These differences in hydrologic
characteristics are so large that they may overwhelm the
effects of other variables and create correlations between
apparently unrelated factors like lithology and water system
size. Although some investigators have found relationships
between, for example, well yield and radon concentration, an
overall analysis of this relationship in North Carolina
might be deceptive because, as is the case with water
average yields between coastal plain and crystalline rock
aquifers. A more useful treatment of this relationship might examine the relationship between well yield and radon
levels within lithologic or hydrologic units.
MANAGEMENT CONSIDERATIONS ,
The relationship of radon in groundwater to aquifer lithology is potentially useful in risk assessment and
management. Average concentrations indicate that
groundwater in the North Carolina coastal plain has radon concentrations which are significantly lower than the 180 pCi/1 United States average reported by Hess et al (1985). The low radon concentrations of the coastal plain contrast with concentrations on the order of 1000 to 5000 pCi/1 in large areas of the Piedmont and Appalachian portions of
North Carolina which are underlain by gneisses, schists and metavolcanic rocks, and with smaller areas underlain by
granite where radon concentrations may exceed 10,000 pCi/1.
These radon levels are significantly above average for the U.S.
The large discrepancy between radon concentrations in the coastal plain and the remainder of the state dictates that any efi^orts to evaluate or mitigate the risk associated
with radon in groundwater should be focussed in the Piedmont
45
are at the greatest risk from radon exposure. The impact of
radon on private wells should also be given additional
consideration. Data from other studies (Hess et al, 1985)
indicate that radon concentrations tend to be higher in
private wells than in public water supplies. Since none of the water samples considered in this study were from private
wells, the applicability of predictive criteria for radon levels in private supplies needs to be assessed by further sampling. The relationship between lithology and radon
concentration shows that geologic factors which control
radon concentration, rather than factors like water system
size, should be considered in efforts to estimate radon exposures or their associated risks.
A complete assessment of radon exposure requires, in
addition to knowledge of the geologic and hydrologic factors
which control radon concentrations in water, a determination of the number of individuals exposed to specific
concentrations of radon. This number could be obtained by
estimating the number of groundwater users with wells in a
particular aquifer and then applying average radon
concentrations from each aquifer to the appropriate number of individuals to produce a geologically-weighted estimate.
SUMMARY
In North Carolina the highest concentrations of radon
lowest concentrations are found in the coastal plain and in areas where bedrock consists of mafic igneous rocks.
Anomalously high radon concentrations also occur immediately downdip of the fall line, but the reasons for these high
values are not apparent. In general radon concentrations are less than 500 pCi/1 in the coastal plain and between 1,000 and 5,000 pCi/1 in the Piedmont and Blue Ridge
regions. Typical radon concentrations in the coastal plain
are below average for the United States, while
concentrations in the Piedmont and Blue Ridge are above average. This distinct break in radon concentrations reflects the large differences in the lithologic and
hydrologic characteristics between the coastal plain and the remainder of North Carolina. There is no overall systematic relationship between radon concentration and water system
size in North Carolina.
Relationships between lithology and radon concentration in North Carolina groundwater are consistent with relative concentrations that might be expected from the relative
average uranium concentration in common rocks. However
lithology is related to such factors as grain size,
weathering, and many hydrologic properties which also affect radon concentration. Therefore the observed relatiohship between lithology and radon may be due in part to these other factors which are correlated with lithology.
Additional study is needed to evaluate the importance of
47
REFERENCES CITED
Aldrich, L. K., Sasser, M. K., and Conners, D. A.,
"Evaluation of Radon Concentration in North Carolina
Ground Water Supplies." North Carolina Department of
Human Resources, Raleigh N.C., 1975
Andrews, J. N., and Wood, D. F., "Mechanism of Radon Release in Rock Matrices and Entry into Groundwaters,"
Institute of Mining and Metallurgy, Transactions, Sec. B, Vol. 81, No. 792, 1972, pp. B198-209.
Asikainen, M., and Kahlos H., "Anomalously High
Concentration of Uranium, Radium and Radon in Water from Drilled Wells in the Helsinki Region," Geochimica et Cosmochimica Acta, Vol. 43, 1979, pp. 1681-1686. Baretto, P. M. C, Clark, R. B., and Adams, J. A. S.,
"Physical Characteristics of Rn-222 Emanation from
Rocks, Soils, and Minerals: Its Relation to Temperature and Alpha Dose, in Adams, J. A. S., and Lowder, W. M., eds.. Natural Radiation Environment II, 1972, pp.
731-73 8.
Brutsaert, W. F., Norton, S. A., Hess, C. T., and Williams, J. S., "Geologic and Hydrologic Factors Controlling Radon-222 in Ground Water in Maine," Ground Water, Vol.
19, 1981, pp. 407-417.
Butler, J. R., "Age of Paleozoic Regional Metamorphism in the Carolinas, Georgia, and Tennessee Southern
Appalachians," American Journal of Science, Vol. 272, 1972, pp. 272-333.
«
Cederstrom, D. J., Boswell, E. H., and Tarver, G. R., Summary Appraisals of the Nation's Ground-Water
Resources—South Atlantic-Gulf Region, U.S. Geological Survey Professional Paper 813-0, 1979.
Crawford-Brown, D. J., and Cothern, C. R., Use of
"' Uncertainty Concepts in Estimating Lifetime Human Risk
^. .• Due to the Occurrence of Radon in £^ S^ Public Drinking
'If' Water Supplies, U.S. Environmental Protection Agency
( Draft Report, 1985.
Cross, F. T., Harley, N. H., and Hoffman, W., "Health
Health Physics, Vol. 48, 1985, pp. 649-670.
Fong, S. W., and Penny, J. M., Report on Environmental
Radiation Surveillance in North Carolina for 1980-1981 North Carolina Deparatment of Human Resources
(Raleigh NC), 1981 109p.
Fukui, M., and Katsurayama, K., "Rn-222 Content of
Groundwater in Strata of the Plio-Pleistocene Osaka Group in the Sennan Area, Japan," Journal of Hydrology,
Vol. 60, 1983, pp. 197-207.
Fullagar, P. D., "Age and Origin of Plutonic Intrusions in
the Piedmont of the Southeastern Appalachians,"
Geological Society of America Bulletin, Vol. 82, 1972,
pp. 2845-2862.
Gesell, T. F., "Background Atmospheric 222j^j^ Conceantrations
Outdoors and Indoors: A Review," Health Physics, Vol.
45, 1983, pp. 289-302.
Gesell, T. F., and Prichard, H. M., "The Contribution of
Radon in Tap Water to Indoor Radon Concentration," in
Gesell, T. F., and Lowder, W. M., eds.. Natural
Radiation Environment III, Vol., 2, U.S. Department of Energy CONF 780422, 1980, pp. 1347-1363.
Gorgoni, C, Martinelli, G., and Sighinolfi, G. P., "Radon Distribution in Groundwater of the Po Sedimentary Basin (Italy)," Chemical Geology, Vol. 35, 1982,
pp. 279-309.
Hadley, J. B., "The Ocoee Series and its Possible
Correlatives," in Fisher, G. W., Pettijohn, F. J.,
Reed, J. C, and Weaver, K. N., eds.. Studies of Appalachian Geology; Central and Southern,
Interscience, New York, 1970, pp. 247-259.
Heath, R. C, Basic Elements of Ground-Water Hydrology with
Reference to Conditions in North Carolina, U.S.
Geological Survey Water Resources Investigations Open
File Report OF 80-44, 1980.
Hess, C. T., Michel, J., Horton, T. R., Prichard, H. M., and Coniglio, W. A., The Occurrence of Radioactivity in Public Drinking Water Supplies in the United States," Health Physics, Vol. 48, 1985, pp. 553-586.
•f Hess, C. T., Weiffenbach, C. V., and Norton, S. A.,
"Environmental Radon and Cancer Correlations in Maine," ii^^Ayi Physics, Vol. 45, 1983, pp. 339-348.
Horton, T. R., Methods and Results of EPA'S Study of Radon in Drinking Water, U.S. Environmental Protection
49
Kahlos, H., and Asikainen, M., "Internal Radiation Doses from Radioactivity of Drinking Water in Finland," Health Physics, Vol. 39, 1980, pp. 108-111.
King, P. B., "A Geologic Cross-Section Across the Southern Appalachians," in Russell, R. J., ed.. Guides to
Southeastrn Geology, Geological Society of America,
Boulder Colorado, 1955. pp. 332-373.
King, P. T., Michel, J., and Moore, W. S., "Ground Water
Geochemistry of 228^3^ 226j^3^ ^^d 222Rn,"
Geochimica et Cosmochimica Acta , Vol. 46, 1982, pp. 1173-1182.
Lee, R. D., Watson, J. E., and Fong, S. W., "An Assessment of Radium in Selected North Carolina Drinking Water Supplies," Health Physics, Vol. 37, 1979, pp. 777-779. LeGrand, H. E., Groundwater Resources of the Piedmont and
Blue Ridge Provinces in the Southeastern United States, U.S. Geological Survey Information Circular 538, 1967.
Michel, J., and Moore, W. S., l.?lRa and ^Ahia Content of
Fall Line Aquifers Near Leesvil'le, South Carolina,"
Water Resources Research Institute Report No. 83,
Clemson South Carolina, 1980.
Menetrez, M. Y., and Watson, J. E., Natural Radioacativity in North Carolina Ground Water Supplies, University of North Carolina Water Resources Research Institute
Report No. 208 (Raleigh NC), 30 pp.
Mitsch, B. F., Watson, J. E., and Hayes, J. E., A Study of Radium-226 and Radon-222 Concentrations in Ground Water Near a Phosphate Mining and Manufacutring Facility with Emphasis on the Hydrogeologic Characteristics of the Area, Water Resources Research Institute Report No.
216, Raleigh, N. C., 1984.
Nero, A. V., "Airborne Radionuclides and Radiation in
Buildings: A Review," Health Physics, Vol. 45, pp.
303-322.
North Carolina Department of Conservation and Development,
Geologic Map of North Carolina, Raleigh, N.C., 1958. Rogers, J. J. W., and Adams, J. A. S., "Uranium," in
Wedepohl, K. H., ed.. Handbook of Geochemistry Chapter
92, Springer, Berlin, r969. Sasser, M. K., and Wa
Radon Concentra
Health Phys^ics,
atson, J. E., "An Evaluation of the tion of North Carolina Ground Water,"