ii ABSTRACT
Gwen Yung-Hsin Hwarng:
Finding links between obesity and diabetes: Using diacylglycerol kinase to regulate insulin signaling
(Under direction of Rosalind A. Coleman)
In the U.S., two-thirds of adults are overweight or obese, with 35.7% of them - nearly 78 million
people – obese. What used to be a disease that only afflicted adults is now also increasingly being
diagnosed in children, contributing to ever-growing obesity rates. In particular, obesity and diabetes are
closely linked, with obese people at higher risk for developing type 2 diabetes. All this only further
intensifies the urgent need to address obesity and type 2 diabetes. In particular, we need to understand
how the two conditions are linked and what metabolic processes are involved, in order to develop
treatment and prevention strategies that will ultimately reduce the burden of type 2 diabetes on healthcare.
My project looks at how the triacylglycerol synthesis and insulin signaling pathways are linked.
In particular, we are studying how lipid intermediates cause insulin resistance in hepatocytes. We are
interested in whether phosphatidic acid (PA) and diacylglycerol (DAG) affect Akt phosphorylation, and
the mechanism by which PA and DAG might inhibit insulin signaling. Diacylglycerol kinase (DGK) is
the enzyme that catalyzes conversion of DAG to PA, and was used as a tool to manipulate the cellular
content of PA and DAG. The content and activity of DGK was adjusted by DGK overexpression in
mouse hepatocytes, thus altering the balance of PA and DAG. The physiological consequences were then
used to determine how insulin signaling is affected. Our hypothesis is that DGK regulates insulin
signaling by changing intracellular PA and DAG levels. The isoform used was the DGKθ isoform. Our
iii
ACKNOWLEDGEMENTS
I would like to thank Dr. Rosalind A. Coleman and Dr. Eric L. Klett for sharing your knowledge
and skills with me and pushing me beyond what I thought I was capable of. Our conversations,
discussions, and debates always challenge and inspire me. I would especially like to recognize the efforts
of my mentor, Dr. Chongben Zhang, for guiding me every step of the way through this project and
teaching me everything I know about lab research. You have been instrumental in shaping the past two
years of my Carolina experience and for that I am so grateful. I would also like to thank everyone in the
Coleman lab for supporting me in this project. I have grown tremendously from our time working
together in the lab, and seeing your smiling faces at my honors thesis public defense made me realize how
much I appreciate you all.
I would also like to thank my community here in Chapel Hill, as well as family and friends back
home in Singapore, for your love and warmth. It is from all of you that I have learned what it means to be
genuine.
Most importantly, I would like to give all glory, honor, and praise to my Father in heaven.
“Every good and perfect gift is from above, coming down from the Father of the heavenly lights, who does not change like shifting shadows.” James 1:17
This project was supported by the Tom and Elizabeth Long Excellence Fund for Honors,
iv
TABLE OF CONTENTS
LIST OF TABLES………vi
LIST OF FIGURES……….vii
LIST OF ABBREVIATIONS……….……viii
CHAPTER 1: INTRODUCTION………..1
1.1 Obesity and diabetes………...1
1.2 The insulin signaling pathway………1
1.3 The GPAT pathway………3
1.4 Lipid metabolism and insulin resistance………5
CHAPTER 2: STUDY AIMS AND HYPOTHESIS……….6
CHAPTER 3: MATERIALS AND METHODS………...8
3.1 Materials………....8
3.2 Methods……….8
3.2.1 DGK activity assay………...8
3.2.2 Western blot analysis………....9
3.3 Other methods………....9
3.3.1 Mouse liver perfusion, hepatocyte isolation, and culture………...9
v
3.3.3 Lipid extraction and PA and DAG assays………..10
3.4 Statistical analysis………10
CHAPTER 4: RESULTS……….11
4.1 DGKθ overexpression impaired Akt phosphorylation in mouse hepatocytes………...11
4.2 DGKθ overexpression increased cellular content of PA, and decreased cellular content of DAG………12
CHAPTER 5: DISCUSSION………..14
5.1 Molecular mechanisms of insulin resistance………14
5.2 Lipid metabolism and insulin resistance………...15
5.3 DGK………..16
5.4 DGK-derived PA is associated with impaired insulin action, but DAG is not………....17
5.5 Limitations………18
5.6 Future direction……….18
vi
LIST OF TABLES
Table 1. Cellular content of PA species in mouse primary hepatocytes
with GFP or DGKθ overexpression (pmol/mg protein)………..……….13
Table 2. Cellular content of DAG species in mouse primary hepatocytes
vii
LIST OF FIGURES
Figure 1. Key steps in the insulin signaling pathway………2
Figure 2. Enzymes and lipid intermediates of the GPAT pathway………4
Figure 3. Lipid intermediates and the insulin signaling pathway………..7
Figure 4. DGKθ overexpression impaired Akt phosphorylation in mouse hepatocytes………..……11
Figure 5. DGKθ overexpression increased cellular content of PA, and decreased cellular content of DAG………...12
Figure 6. Structures of ten mammalian DGK isoforms classified into five types………...16
Figure 7. Structural diagram of DGKθ………17
viii
LIST OF ABBREVIATIONS
ACSL acyl-CoA synthetase
AGPAT 1-acyglycerol-3-phosphate acyltransferase
ATP adenosine triphosphate
CRD cysteine-rich domain
DAG diacylglycerol
DGAT diacylglycerol acyltransferase
DGK diacylglycerol kinase
ER endoplasmic reticulum
G3P glycerol-3-phosphate
GLUT glucose transporter
GPAT glycerol-3-phosphate acyltransferase
IR insulin receptor
IRS insulin receptor substrate
LPA lysophosphatidic acid
mTOR mammalian target of rapamycin
mTORC mammalian target of rapamycin complex
PA phosphatidic acid
PAPase/lipin phosphatidic acid phosphohydrolase
PC phosphatidylcholine
PDK1 3-phosphoinositidedependent protein kinase-1
PH pleckstrin homology
PI3K phosphatidylinositol 3-kinase
PIP2 phosphatidylinositol-4,5-bisphosphate
ix
PKC protein kinase C
PLD phospholipase D
RA Ras-associating domain
S473 serine473
T2D type 2 diabetes
T308 threonine308
1
CHAPTER 1: INTRODUCTION
1.1 Obesity and diabetes
In the U.S., two-thirds of adults are overweight or obese, with 35.7% of them - nearly 78 million
people – obese1. What used to be a disease that only afflicted adults is now increasingly being diagnosed
in children, contributing to ever-growing obesity rates2. Furthermore, obesity is related to some of the
leading causes of preventable death such as type 2 diabetes (T2D), heart disease, and cancer1.
In particular, obesity and diabetes are closely linked, with obese people at higher risk for
developing T2D. In 2012, the total estimated cost of diabetes in the US was $245 billion3 and it is
estimated that by 2050, 1 in 3 US adults will have diabetes4. T2D accounts for 90-95% of all diabetes
cases.
The need to address obesity and T2D is critical. It is important to understand how the two
conditions are linked and what metabolic processes are involved, in order to develop treatment and
prevention strategies that will ultimately reduce the burden of T2D on healthcare costs and health
outcomes.
1.2 The insulin signaling pathway
T2D is characterized by high blood glucose levels due to insulin resistance, which occurs when
the insulin signaling pathway is impaired5. Insulin is a hormone that is secreted by the pancreas and is
responsible for maintaining normal glucose levels in the blood by increasing glucose uptake by glucose
transporter (GLUT) 4, decreasing glucose production by the liver, and increasing glycogen synthesis.
Resistance to insulin action occurs due to a defect in the insulin signaling pathway, and thus it is crucial
2
Figure 1. Key steps in the insulin signaling pathway. Insulin binds to the insulin receptor (IR), and autophosphorylation of
specific tyrosine residues results in activation of insulin receptor substrate (IRS) 1. IRS1 activation is responsible for the subsequent generation of downstream signals to phosphatidylinositol 3-kinase (PI3K), phosphatidylinositol 4,5-bisphosphate (PIP2), and phosphatidylinositol-(3,4,5)-triphosphate (PIP3). PIP3 recruits 3-phosphoinositidedependent protein kinase-1 (PDK1)
and Akt to the plasma membrane. Subsequent Akt phosphorylation results in a sequence of downstream signaling that increases the rate of glycogen synthesis and decreases the rate of gluconeogenesis in the liver. IRS1 also triggers an enzyme
phosphorylation cascade which may activate the mammalian target of rapamycin complex 2 (mTORC2).
When insulin binds to the extracellular insulin binding site on the insulin receptor (IR), the
tyrosine kinases on the receptor are activated, leading to autophosphorylation of specific tyrosine
residues6. This results in the binding of insulin receptor substrate (IRS) 1 to the IR and activation of IRS1.
The activation of IRS1 is responsible for the subsequent generation of downstream signals. IRS1 binds to
phosphatidylinositol 3-kinase (PI3K), which activates various signaling lipids7. One of these lipids is
phosphatidylinositol 4,5-bisphosphate (PIP2), a phospholipid component of the cell membrane which is
3
phosphoinositidedependent protein kinase-1 (PDK1) and Akt to the plasma membrane6. Akt, a
serine/threonine kinase, is then activated by phosphorylation at two amino acid sites, Serine473 (S473)
and Threonine308 (T308). Akt phosphorylation results in a sequence of downstream signaling that
eventually increases the rate of glycogen synthesis and decreases the rate of gluconeogenesis in the liver.
Glycogen synthase converts glucose into glycogen for storage, whereas gluconeogenesis is the process by
which glucose is produced from non-carbohydrate sources like amino acids. Fatty acid oxidation
provides the adenosine triphosphate (ATP) required to power gluconeogenesis. These two processes are
crucial for maintaining normal plasma glucose levels. IRS1 also triggers an enzyme phosphorylation
cascade which may eventually activate the mammalian target of rapamycin complex 2 (mTORC2).
mTORC2 is a complex of proteins that work together to phosphorylate Akt at S4738. When both S473
and T308 are phosphorylated, Akt is fully activated, leading to the Akt-dependent phosphorylation of
many substrates. In adipose and muscle, this results in GLUT4 translocation and glucose uptake. Many
of insulin’s other effects are regulated by Akt.
1.3 The GPAT pathway
Another pathway that has been implicated in the development of insulin resistance is the
glycerol-3-phosphate acyltransferase (GPAT) pathway9. This is the pathway by which triacylglycerol (TAG) is
synthesized from fatty acids and glycerol-3-phosphates (G3P). The reactions of the main lipid
4
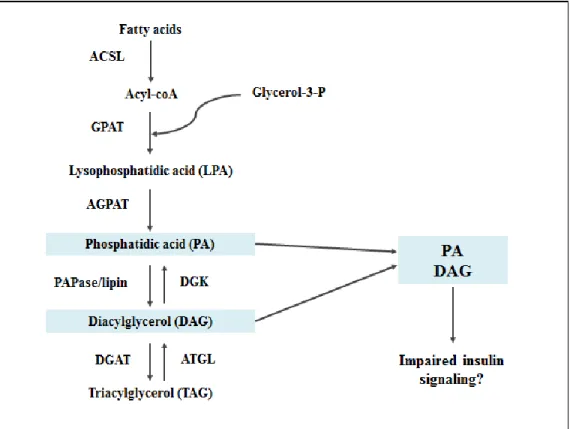
Figure 2. Enzymes and lipid intermediates of the GPAT pathway. Fatty acids enter the GPAT pathway, eventually being
converted to triacylglycerol (TAG) through several reactions catalyzed by various enzymes. Lipid intermediates in this pathway include lysophosphatidic acid (LPA), phosphatidic acid (PA), and diacylglycerol (DAG). This project focused on whether either
of two lipid intermediates, PA or DAG, impairs insulin signaling.
Initially, a fatty acid is converted to acyl-CoA by acyl-CoA synthetase (ACSL). GPAT catalyzes
the reaction of acyl-CoA and G3P to form lysophosphatidic acid (LPA). 1-acyglycerol-3-phosphate
acyltransferase (AGPAT) catalyzes the reaction of LPA and another acyl-CoA to form phosphatidic acid
(PA). Diacylglycerol (DAG) is formed from PA through the removal of a phosphate group by
phosphatidic acid phosphohydrolase (PAPase/lipin). Finally, diacylglycerol acyltransferase (DGAT)
catalyzes the reaction of DAG and a third fatty acid to form TAG. LPA, PA, and DAG are lipid
intermediates which can also act as signaling molecules in other pathways. This project focused on
5
diacylglycerol kinase (DGK), plays the antagonistic role of converting DAG back to PA with the addition
of a phosphate group.
1.4 Lipid metabolism and insulin resistance
Lipid intermediates modulate insulin signaling and have been implicated in insulin resistance.
Lipid-induced insulin resistance in human muscle has been associated with changes in DAG and certain
protein kinase C (PKC) isoforms10. DAG activates certain PKC isoforms, which could lead to serine or
threonine phosphorylation of the IR or IRS1, thus disrupting insulin signaling. PA is another important
signaling molecule which has been shown to inhibit insulin signaling to Akt by disrupting the
mTOR-rictor association8. Besides being produced by GPAT/AGPAT-catalyzed reactions, PA is also derived
from the phosphorylation of DAG by DGK. DGK can thus alter the cellular content of DAG and PA
reciprocally11. The focus of this project was to determine how lipid intermediates in the GPAT pathway,
specifically PA and DAG, are associated with signaling molecules in the insulin signaling pathway in
6
CHAPTER 2: STUDY AIMS AND HYPOTHESIS
Our project looks at how the TAG synthesis and insulin signaling pathways are linked in mouse
hepatocytes. In particular, we are studying how lipid intermediates may cause insulin resistance. In
determining how lipid intermediates in the GPAT pathway are associated with signaling molecules in the
insulin signaling pathway, we raised two main questions. These two questions are summarized in Figure
3.
1. Do the relative amounts of PA and DAG decrease Akt phosphorylation?
Since Akt phosphorylation is a key step in the insulin signaling pathway, it is important to
determine whether the relative amounts of PA and DAG decrease Akt phosphorylation.
2. What is the mechanism by which PA or DAG decreases Akt phosphorylation?
Our previous studies suggest that PA and Akt phosphorylation could be linked by mTORC28.
mTORC2 phosphorylates Akt at S473, thereby activating downstream signaling.
DGK is the enzyme that catalyzes the conversion of DAG to PA, and was used as a tool to
manipulate the cellular content of PA and DAG. We hypothesize that DGK can regulate insulin signaling
7
Figure 3. Lipid intermediates and the insulin signaling pathway. Our project looks at how the TAG synthesis and insulin
8
CHAPTER 3: MATERIALS AND METHODS
This chapter will go into detail about the methods that I participated in, followed by a summary of
methods that were crucial for data collection and that I observed but did not participate in.
3.1 Materials
Primary antibodies were from Cell Signaling Technology (MA). Secondary antibodies and
SuperSignal West Pico Chemiluminescent Substrate were from Thermo Scientific. Anti-DGKθ
antibodies were from Santa Cruz Biotechnology (CA). Anti-α-tubulin antibodies, insulin (human
recombinant), phosphatase inhibitor cocktails 1 and 2, ATP, and CHAPS were from Sigma (MO).
Inactive Akt1 was from SignalChem (British Columbia, Canada). Protease inhibitor tablets were from
Roche (CT). Cell culture media and reagents were from Invitrogen (CA).
3.2 Methods
3.2.1 DGK activity assay
The DGK activity assay used DAG/phosphatidylserine (PS)/ octyl glucoside (OG) mixed
micelles12. A cold assay buffer (40 mM Hepes, pH 7.5, 120 mM NaCl, 1 mM EDTA, 10 mM
pyrophosphate, 10 mM glycerophosphate, 50 mM NaF, 0.5 mM Na3VO4, EDTA-free protease inhibitors,
1% phosphatase inhibitor mixture 2 and 3, 0.3% CHAPS) was used to lyse the hepatocytes on ice. Cell
lysates were then centrifuged at 13,000×g for 10 min. Supernatants were transferred to new tubes, and
the reaction was initiated by adding 10 l of the cell supernatant (containing 10-30 g protein) to 90 l of
the reaction system. The reaction system contained DAG/PS/OG mixed micelles (8% mol DAG, 16%
9
mM MgCl2, 1 mM EGTA, 1 mM DTT, and 1 mM γ-32P[ATP] mix containing 2 Ci γ-32P[ATP]). The
reaction was terminated by adding 1 ml 1% perchloric acid and 1 ml chloroform. This was followed by
vortexing and washing twice with 2 ml of 1% perchloric acid. An aliquot of the lower organic phase was
removed for scintillation counting.
3.2.2 Western blot analysis
Hepatocytes were harvested in lysis buffer (20 mM Tris-HCl, pH 7.5, 0.1 mM Na3VO4, 25 mM
NaF, 25 mM glycerophosphate, 2 mM EGTA, 1 mM dithiothreitol, 0.5 mM phenylmethylsulfonyl
fluoride, and 0.3% Triton X-100). The lysates were mixed 1:1 with 2x Laemmli sample buffer and boiled
before loading onto SDS-PAGE. Gels were run at 180V for 1 h in running buffer (25 mM Tris base, 190
mM glycine, 0.1% SDS, pH 8.3) and then transferred to nitrocellulose membrane at 75V for 1 h in
transfer buffer (25 mM Tris base, 190 mM glycine, 20% methanol, pH 8.3). The membrane was blocked
with 5% milk for 30 min and incubated with primary antibodies overnight at 4°C. After primary antibody
incubation, the membrane was washed three times for 5 min each with washing buffer (20mM NaCl,
20mM Tris-Cl, 0.05% Tween-20, pH 7.6). Incubation with secondary antibodies was done for 30 min at
room temperature. After secondary antibody incubation, the membrane was washed five times for 5 min
each with washing buffer. The membrane was incubated with SuperSignal West Pico Chemiluminescent
Substrate for 5 min at room temperature. Horseradish peroxidase-conjugated secondary antibodies were
detected by exposing the gel to X-ray film. The film was converted to digital image by an Epson scanner
(Perfection 2400), and the images were cropped using Photoshop CS2.
3.3 Other methods
3.3.1 Mouse liver perfusion, hepatocyte isolation, and culture
Hepatocytes were isolated from livers of 8-15 week old wild type C57/B6J mice and cultured
overnight in William’s medium E (10% FBS, 1% penicillin/streptomycin and 4 mM glutamine).
10
glucose, 1% penicillin/streptomycin and 4 mM glutamine), followed by specific treatments according to
the experiment design.
3.3.2 cDNA cloning, lentiviral packaging, and hepatocyte infection
Lentiviral constructs for GFP and mouse DGKθ were gifts from Dr. Daniel M. Raben (The Johns
Hopkins University, Baltimore, MD). The constructs were transfected into HEK293T cells with plasmids
pCMV delta-R8.2 and PCMV-VSV-G (Addgene, Cambridge, MA). The crude lentiviruses (about
1-2×10⁸ TU/ml) produced in D/MEM (4.5 g/L glucose, 30% FBS, 0.1% penicillin/streptomycin and 4 mM
glutamine) were concentrated by 2 h ultracentrifugation at 25,000×g at 4℃; the lentivirus pellet was
reconstituted in PBS to obtain concentrated lentivirus with a titer of 1-2×10¹⁰ TU/ml. MOIs of 10 were
used for mouse hepatocyte lentiviral infection.
3.3.3 Lipid extraction and PA and DAG assays
Total cell lipid was extracted and analyzed by LC/MS. The amount of PA and DAG species in
the biological samples was calculated from the peak areas obtained using Analyst 1.5 (Applied
Biosystems). Raw peak areas were corrected and transformed into amounts of analyte using standard
curves. Glycerolipids were quantified with 0.1 nmol 17:0 LPA and 15:0 DAG as internal standards for
PA and DAG respectively. Amounts of PA and DAG were quantified and normalized to the protein
concentrations of the cellular lysates.
3.4 Statistical analysis
Values are expressed as means ± SE. Student’s t test was used to compare between groups (GFP
and DGKθ) of the same treatment (basal, or insulin-stimulated) or same lipid species (PA, or DAG). GFP
was set as the control. Data represent at least 3 independent experiments. P < 0.05 was considered
11
CHAPTER 4: RESULTS
4.1 DGKθ overexpression impaired Akt phosphorylation in mouse hepatocytes
DGK is a key enzyme which phosphorylates DAG to produce PA, thus it occupies an important
position in the modulation of DAG and PA concentrations. To investigate whether the product of DGK,
PA, plays a role in regulating insulin sensitivity, we overexpressed DGKθ in mouse primary hepatocytes.
Insulin signaling was examined by measuring the effects of DGK overexpression on Akt phosphorylation.
Western blotting showed that DGKθ was overexpressed (Figure 4A). A DGK activity assay further
confirmed a corresponding increase in DGK activity by 4-fold (Figure 4B). Western blotting also showed
that following DGKθ overexpression, there was no Akt phosphorylation at S473 and T308, representing
blocked insulin signaling (Figure 4C). These results indicate that insulin signaling is disrupted when
DGK is overexpressed in hepatocytes.
Figure 4. DGKθ overexpression impaired Akt phosphorylation in mouse hepatocytes. Mouse primary hepatocytes were
infected with EGFP or DGK lentiviruses for 24 h. Cells were (A) lysed and subjected to Western blotting; or (B) lysed for cell lysate preparations and subjected to DGK activity assay; or (C) treated with or without insulin (100 nM) for 10 min, followed by
12
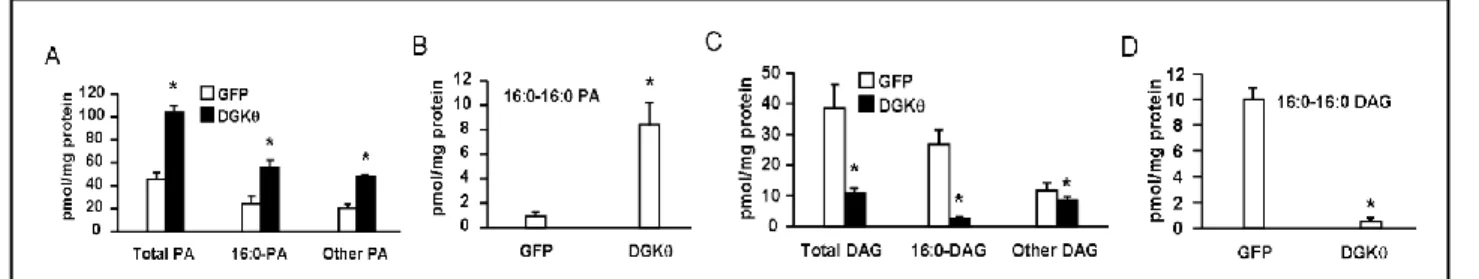
4.2 DGKθ overexpression increased cellular content of PA, and decreased cellular content
of DAG
Since DGK regulates both PA and DAG, we looked at the cellular content of PA and DAG to
find out how concentrations of lipid metabolites produced by DGK overexpression were associated with
impaired insulin signaling in mouse hepatocytes. DGKθ overexpression increased total PA, 16:0-PA, and
other PA species by 2.3 fold each, and increased 16:0-16:0-PA by 9.4 fold (Figures 5A and 5B, Table 1).
DGKθ overexpression decreased total DAG, 16:0-DAG, and other DAG species by 71.1%, 90.6%, and
27.2% respectively, and decreased 16:0-16:0-DAG by 95.4% (Figures 5C and 5D, Table 2). These results
suggest that the cellular content of PA, but not DAG, is associated with impaired insulin signaling in
mouse hepatocytes. In particular, increased 16:0-16:0-PA is strongly associated with impaired insulin
signaling.
Figure 5. DGKθ overexpression increased cellular content of PA, and decreased cellular content of DAG. Lipids from
13
Table 1. Cellular content of PA species in mouse primary hepatocytes with GFP or DGKθ overexpression (pmol/mg protein)
PA species GFP DGK
16:0-16:0 0.90 ± 0.33 8.45 ± 2.15*
16:0-18:0 1.15 ± 0.41 2.49 ± 0.33*
16:0-18:1 15.31 ± 6.10 22.70 ± 4.06
16:0-18:2 7.22 ± 0.47 22.18 ± 5.16*
18:0-18:1 5.79 ± 0.98 7.17 ± 0.86
18:0-18:2 1.53 ± 0.18 0.24 ± 0.11
18:1-18:1 12.08 ± 3.71 36.82 ± 1.54*
18:1-18:2 1.35 ± 0.23 3.53 ± 0.76*
*, P < 0.05 compared to GFP.
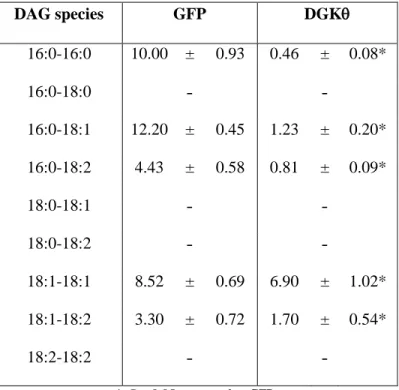
Table 2. Cellular content of DAG species in mouse primary hepatocytes with GFP or DGKθ overexpression (pmol/mg protein).
DAG species GFP DGK
16:0-16:0 10.00 ± 0.93 0.46 ± 0.08*
16:0-18:0 ˗ ˗
16:0-18:1 12.20 ± 0.45 1.23 ± 0.20*
16:0-18:2 4.43 ± 0.58 0.81 ± 0.09*
18:0-18:1 ˗ ˗
18:0-18:2 ˗ ˗
18:1-18:1 8.52 ± 0.69 6.90 ± 1.02*
18:1-18:2 3.30 ± 0.72 1.70 ± 0.54*
18:2-18:2 ˗ ˗
14
CHAPTER 5: DISCUSSION
5.1 Molecular mechanisms of insulin resistance
Many molecular mechanisms have been implicated in the development of insulin resistance,
including inflammation, endoplasmic reticulum (ER) stress, mitochondrial dysfunction, and dysfunctional
lipid metabolism.
One of the mechanisms that have been proposed to explain insulin resistance is inflammation,
which arises because of the phosphorylation of serine residues of IRS1 upon exposure of cells to elevated
levels of free fatty acids13. Inflammation has been understood to reduce the ability of IRS1 to associate
with the IR and inhibit downstream signaling of the IR. The subsequent enzyme cascade is interrupted
and propagation of the insulin signal is blocked.
Another mechanism that provides an understanding of insulin resistance is ER stress14. The ER is
crucial in the synthesis and processing of proteins, but under certain stress conditions such as obesity and
diabetes, the ER fails to fold and export proteins. ER stress leads to insulin resistance by activating
abnormal phosphorylation of IRS1, which inhibits insulin receptor signaling15. ER stress also modifies
the expression of proteins like Akt, which is involved in insulin signaling. ER stress ultimately disrupts
insulin signaling, causing insulin resistance.
Mitochondrial dysfunction is also a mechanism associated with insulin resistance and is caused
by an imbalance between energy intake and expenditure16. Oxidative stress can happen as a result of
excessive intake of nutrients, causing mitochondrial dysfunction by damaging proteins, DNA, and lipids
15 5.2 Lipid metabolism and insulin resistance
The causes of insulin resistance remain controversial, but lipid intermediates have been
implicated as playing important roles in modulating insulin signaling and contributing to insulin
resistance. Previous studies have concluded that instead of the final product TAG causing insulin
resistance, the defect could be caused by intermediates in the lipogenic pathway8. GPAT1 overexpression
induces insulin resistance, revealing an association between the insulin signaling and lipogenic pathway17.
In particular, GPAT1 overexpression leads to decreased pAkt. Thus, an important next step is to
determine whether any of the lipid intermediates inhibits insulin signaling and the mechanism by which
they function.
DAG has been reported as the link between lipid metabolism and insulin resistance because it can
activate certain PKC isoforms, which could lead to serine or threonine phosphorylation of the IR or IRS1
and disrupt insulin signaling10. However, the relationship between DAG and insulin resistance remains
unclear. In human skeletal muscle, lipid infusion reduces insulin sensitivity but does not alter
intramyocellular DAG content18. Also, while diabetic patients have higher intramyocellular TAG content,
they have similar DAG content as non-diabetic subjects19. These studies show that whether DAG
contributes to insulin resistance remains unclear.
Another lipid intermediate is PA, which inhibits insulin signaling through a variety of ways. PA
derived from GPAT or AGPAT inhibits insulin signaling to Akt by disrupting mTOR-rictor8. PA from
another source, phospholipase D (PLD)-catalyzed phosphatidylcholine (PC) hydrolysis, also inhibits
insulin signaling20. It activates mTORC1 and enhances IRS1 phosphorylation at serine sites. A third
source of PA is DAG phosphorylation by DGK11. To investigate whether PA derived from DAG
phosphorylation is involved in insulin resistance, we overexpressed DGKθ in mouse primary hepatocytes,
16 5.3 DGK
DGK is a family of enzymes that catalyzes the conversion of DAG to PA, using phosphate from
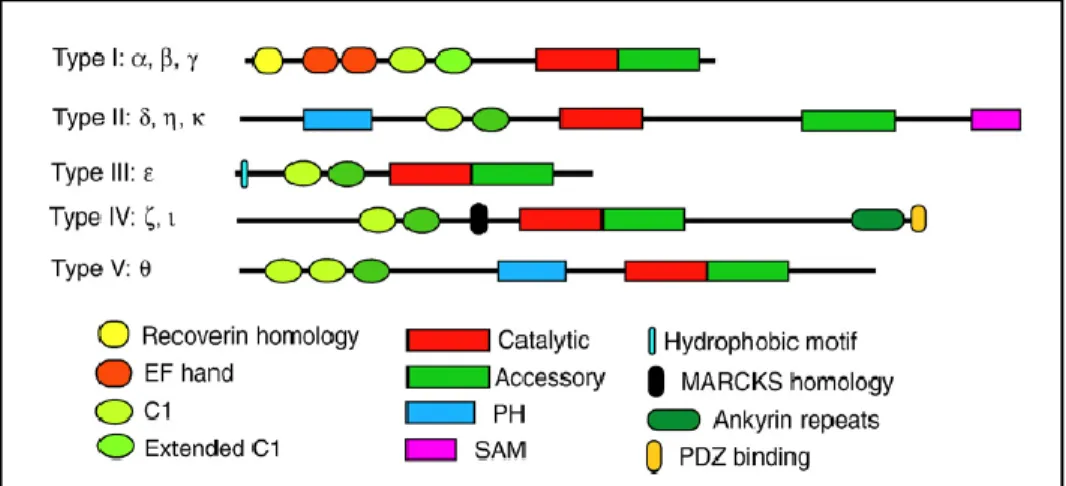
ATP11. Ten mammalian isoforms of DGK have been discovered so far, and are further classified into five
types based on their structures (Figure 6)21. Their distinct structures and subcellular localizations suggest
that each isoform performs its own specific functions22.
Figure 6. Structures of ten mammalian DGK isoforms classified into five types. DGKθ is the only type V isoform.
(Topham and Epand, 2009)
The isoform we used in our studies was DGKθ. DGKθ is the only type V isoform and its
structure begins with a proline-rich region (Figure 7)23. It has cysteine-rich domains (CRDs) and could
possibly have a Ras-associating domain (RA), in addition to a pleckstrin homology (PH) domain,
catalytic region, and two binding sites for SF-1 and RhoA23. DGKθ is a cytosolic protein whose activity
is regulated by translocation to the nucleus24 or plasma membrane25. Of the three DGK isoforms that are
expressed in the liver – δ, η, and θ – DGKθ has the highest expression26. In addition to the liver, DGKθ is
also expressed in the brain, intestine, and duodenum (Figure 8)26, 27. As the major isoform in the liver,
DGKθ may play important roles in regulating hepatic insulin sensitivity and contribute to hepatic insulin
resistance.
DGK occupies a pivotal position in cell signaling because it catalyzes the conversion of DAG to
17
study, we used DGK as a tool to manipulate DAG and PA content, in order to study whether the relative
amounts of DAG and PA inhibit insulin signaling.
Figure 7. Structural diagram of DGKθ. The structure of DGKθ begins with a proline-rich region and cysteine-rich domains
(CRDs). It could possibly have a Ras-associating domain (RA), in addition to a pleckstrin homology (PH) domain and catalytic region, as well as two binding sites for SF-1 and RhoA. (Tu-Sekine and Raben, 2009)
Figure 8. DGKθ mRNA expression in rat. DGKθ is most highly expressed in the brain, small intestine, and liver.
(Houssa et al., 1997)
5.4 DGK-derived PA is associated with impaired insulin action, but DAG is not
The results of this study showed that PA is associated with impaired insulin action in mouse
primary hepatocytes, but DAG is not. Our previous studies showed that overexpressing GPAT1 or
AGPAT2 in mouse hepatocytes inhibited insulin signaling, accompanied by increased cellular content of
both PA and DAG8. This suggested possible roles for both PA and DAG in disrupting insulin signaling.
In the current study, overexpressing DGKθ inhibited insulin signaling in mouse hepatocytes, with an
increased cellular content of total PA and 16:0-16:0 PA. DGKθ overexpression also decreased, rather
18
between insulin signaling inhibition and the cellular PA content, but not the cellular DAG content, in
mouse hepatocytes.
5.5 Limitations
A major limitation of this study is that only one DGK isoform was used, out of ten possible DGK
isoforms. These isoforms all have different structures, subcellular localizations, and tissue distributions.
Thus, while our conclusions may hold true for DGKθ, other DGK isoforms may have different effects on
PA and DAG concentrations, and affect insulin signaling differently.
Another limitation is the lack of direct evidence to support the association between impaired
insulin signaling and the cellular content of 16:0-16:0 PA. Several questions arise of whether palmitic
acid supplementation to the culture medium will impair insulin signaling in the cultured hepatocytes, or
whether palmitic acid supplementation to the diet will cause insulin resistance in mice.
In addition, hepatocytes were grown in William’s Medium E (2.0 g/L glucose), which has a
higher glucose concentration than normal physiologic fasting blood glucose levels of 0.7-1.0 g/L.
However, William’s Medium E has been recommended and widely used in hepatocyte culture for such
experiments.
5.6 Future direction
Globalization has increased access to higher caloric diets and reduced physical activity. In
combination with population growth, increased survival, and an aging population, this just means that the
trend of T2D is likely to continue increasing worldwide. T2D is closely associated with insulin resistance,
and thus many molecular mechanisms relating to insulin resistance have been implicated in the
development of T2D. A major contributor to insulin resistance appears to arise from defects in the
normal functioning of the insulin signaling pathway caused by lipid intermediates in the de novo
19
In this work, we have explored further how the elevated content of lipid intermediates is
associated with insulin resistance. By overexpressing DGKθ, we showed that insulin signaling was
impaired, accompanied by an increase in cellular content of total PA and a concomitant decrease in
cellular content of total DAG. These data suggest that PA, but not DAG, is associated with impaired
insulin action in isolated mouse hepatocytes. However, the mechanism by which PA impairs insulin
signaling is still not well understood. A possible future direction would be to elucidate the mechanism by
which PA impairs insulin signaling. We have previously reported that GPAT1-derived PA disrupts
mTOR-rictor assembly, thereby inhibiting insulin signaling. It will be important to answer the question
of how PA, and in particular 16:0-16:0 PA, interacts with mTOR or with rictor to disrupt mTOR-rictor
association, thus deepening our understanding of the lipid species that contribute to hepatic insulin
resistance and revealing the mechanism by which these lipid intermediates cause hepatic insulin
20 REFERENCES
1. Adult Obesity Facts. August 2013. Available from: http://www.cdc.gov/obesity/data/adult.html
(Accessed March 2014).
2. Childhood Overweight and Obesity. August 2013. Available from:
http://www.cdc.gov/obesity/childhood/index.html (Accessed March 2014).
3. Economic costs of diabetes in the U.S. in 2012. Diabetes Care. 2013;36(4):1033-46.
4. Diabetes, August 2011. Available from:
http://www.cdc.gov/chronicdisease/resources/publications/aag/ddt.htm (Accessed March 2014).
5. Pessin JE, Saltiel AR. Signaling pathways in insulin action: molecular targets of insulin resistance.
6. White MF. Insulin signaling in health and disease. Science. 2003;302(5651):1710-1.
7. Song G, Ouyang G, Bao S. The activation of Akt/PKB signaling pathway and cell survival. J
Cellular Mol Med. 2005;9(1):59-71.
8. Zhang C, Wendel AA, Keogh MR, Harris TE, Chen J, Coleman RA. Glycerolipid signals alter
mTOR complex 2 (mTORC2) to diminish insulin signaling. Proceedings of the National
Academy of Sciences. 109(5):1667-1672.
9. Holland WL, Knotts TA, Chavez JA, Wang L, Hoehn KL, Summers SA. Lipid Mediators of
Insulin Resistance. Nutrition Reviews. 2007;65:S39-S46.
10. Itani SI, Ruderman NB, Schmieder F, Boden G. Lipid-Induced Insulin Resistance in Human
Muscle Is Associated With Changes in Diacylglycerol, Protein Kinase C, and I B- . Diabetes.
2002;51(7):2005-2011.
11. Mérida I, Avila-flores A, Merino E. Diacylglycerol kinases: at the hub of cell signalling. Biochem
J. 2008;409(1):1-18.
12. Epand RM, Topham MK. Measurement of mammalian diacylglycerol kinase activity in vitro and
21
13. Wellen KE, Hotamisligil GS. Inflammation, stress, and diabetes. J Clin Invest.
2005;115(5):1111-9.
14. Ozcan U, Cao Q, Yilmaz E, et al. Endoplasmic reticulum stress links obesity, insulin action, and
type 2 diabetes. Science. 2004;306(5695):457-61.
15. Nakatani Y, Kaneto H, Kawamori D, et al. Involvement of endoplasmic reticulum stress in
insulin resistance and diabetes. J Biol Chem. 2005;280(1):847-51.
16. Kim JA, Wei Y, Sowers JR. Role of mitochondrial dysfunction in insulin resistance. Circ Res.
2008;102(4):401-14.
17. Nagle CA, An J, Shiota M, et al. Hepatic overexpression of glycerol-sn-3-phosphate
acyltransferase 1 in rats causes insulin resistance. J Biol Chem. 2007;282(20):14807-15.
18. Høeg LD, Sjøberg KA, Jeppesen J, et al. Lipid-induced insulin resistance affects women less than
men and is not accompanied by inflammation or impaired proximal insulin signaling. Diabetes.
2011;60(1):64-73.
19. Anastasiou CA, Kavouras SA, Lentzas Y, Gova A, Sidossis LS, Melidonis A. Diabetes mellitus
is associated with increased intramyocellular triglyceride, but not diglyceride, content in obese
humans. Metab Clin Exp. 2009;58(11):1636-42.
20. Fang Y, Vilella-bach M, Bachmann R, Flanigan A, Chen J. Phosphatidic acid-mediated
mitogenic activation of mTOR signaling. Science. 2001;294(5548):1942-5.
21. Topham MK, Epand RM. Mammalian diacylglycerol kinases: molecular interactions and
biological functions of selected isoforms. Biochim Biophys Acta. 2009;1790(6):416-24.
22. Sakane F, Imai S, Kai M, Yasuda S, Kanoh H. Diacylglycerol kinases: why so many of them?.
Biochim Biophys Acta. 2007;1771(7):793-806.
23. Tu-sekine B, Raben DM. Regulation of DGK-theta. J Cell Physiol. 2009;220(3):548-52.
24. Tabellini G, Bortul R, Santi S, et al. Diacylglycerol kinase-theta is localized in the speckle
22
25. Walker AJ, Draeger A, Houssa B, Van blitterswijk WJ, Ohanian V, Ohanian J. Diacylglycerol
kinase theta is translocated and phosphoinositide 3-kinase-dependently activated by noradrenaline
but not angiotensin II in intact small arteries. Biochem J. 2001;353(Pt 1):129-137.
26. Houssa, B., Schaap, D., van der Wal, J., Goto, K., Kondo, H., Yamakawa, A., Shibata, M.,
Takenawa, T., and van Blitterswijk, W.J. Cloning of a novel human diacylglycerol kinase (DGKθ)
containing three cysteine-rich domains, a proline-rich region, and a pleckstrin homology domain
with an overlapping Ras-associating domain. J Biol Chem. 1997:272:10422-10428.
27. van Blitterswijk WJ, Houssa B. Properties and functions of diacylglycerol kinases. Cellular