11
ABSTRACT
ROGER W. NELSON. An Analysis of Changes In Threshold Limit Values Over
Time. (Under The Direction of Dr. STEPHEN M. RAPPAPORT)
Threshold Limit Values (TLVs) for industrial chemicals have been in existence
since 1946. It has been proposed that the rate of change of TLVs over the years
reflects the rate of change of exposure within industry (Roach and Rappaport,
1990). In this paper, a detailed analysis of TLVs as a whole, industry specific
TLVs, and TLVs for known or suspected carcinogens was made to determine the
rate of change of TLVs between 1946 and 1990. It was found that the median fold
reduction for all TLVs was 2.0. For most industries in this analysis it was also
2.0-fold, and for known or suspected carcinogens it was 2.4-fold. The rate of change
for all TLVs decreased with time (21.7% reductions per year in 1951 to 13.3% per
year in 1990). For most industries the reduction rate was 13.3% reductions per
year, while for known or suspected carcinogens it was 16% per year. It is
postulated that the results of this analysis can be used to infer past exposures.
Ill
TABLE OF CONTENTS
Page
ACKNOWLEDGEMENTS
LIST OF TABLES
INTRODUCTION
BACKGROUND METHODS
Industry Specific Data
Fold Reductions
Interval Between Reductions
Carcinogens
Rate of Fold Reduction
RESULTS
Fold Reductions in TLVs
Interval Between Changes
Rate of Fold Reductions
DISCUSSION
Fold Reductions
Interval Between Changes
Rate of Fold Reductions
IV
Appendix C 147
ACKNOWLEDGEMENTS
I would like to thank Dr. Stephen M. Rappaport for his personal interest and
guidance during my study at Environmental Sciences and Engineering. I would
also like to thank Dr. Parker C. Reist and Dr. Alvis G. Turner for their positive criticism and support during the preparation of this report.
I would further like to extend my gratitude to Dr. W. Karl Seiber, Jr., NIOSH
-Cincinnati, for providing me with a copy of the NOES - based JEM which was
most instrumental in categorizing the chemicals by industry codes. Other people
who have been of tremendous help to me on this project are Daniel Wingate and
Keith Brown who wrote the SAS program to extract the necessary information
from the NOES database. I would also like to thank Nina Baird for introducing
me to this topic.
Finally, but not least, I am very grateful to the United States Air Force who made
LIST OF TABLES
VI
Table I. List of Standard Industry Codes (SIC)
Table II. List of Chemicals in the Various Industries Selected
Table III. Fold Reductions in All TLVs (For 5-year intervals from 1946) Table IV. Fold Reductions Over Time By SIC Code
Table V. Fold Reductions for All Carcinogens (For 5-year intervals from
1946)
Table VI. Interval Between Changes in All TLVs (For 5-year intervals from
1946)
Table VII. Interval Between Reductions By SIC Code
Table VIII. Interval Between Reductions for All Carcinogens (For 5-year intervals
from 1951)
Table IX. Rate of Fold Reduction for All TLVs
Rate of Fold Reduction for Known or Suspected Carcinogens
Table X. Rate of Fold Reductions Over Time By SIC Code ( For series with a
significant linear trend)
Table XI. Rate of Fold Reductions Over Time By SIC Code (For series without
a signifcant linear trend)
INTRODUCTION
Since 1946 the American Conference of Governmental Industrial Hygeinists
(ACGIH) has been setting Threshold Limit Values (TLVs) for chemicals used in
industry. The TLVs are reviewed and updated annually by a Committee of health
professionals who state that, "These values are based on the best available
information from industrial experience, from experimental studies and, when
possible, from the combination of both" (Board of Directors, ACGIH, 1990). In
addition they state that these limits are set at a level to protect "nearly all workers"
from adverse health effects over their working lifetimes (ACGIH, 1992). However,
the documentation supporting this position is scanty (ACGIH, 1976 and 1986).
What does "nearly all workers" mean? The ACGIH (1992) also states that "a small
percentage of workers may experience discomfort from substances at
concentrations at or below the threshold limit...". How small is this "small
percentage"?
In recent years there have been a number of articles criticizing the ACGIH on
their methods of arriving at the TLVs, (Castleman and Ziem, 1988; Ziem and
Castleman, 1989; Roach and Rappaport, 1990). There has also been criticism
regarding adoption of the TLVs as official limits by the Occupational Safety and
Health Administration (OSHA) and other countries around the world (Castleman
and Ziem, 1988). In addition there has been criticism that industry has played too
important a role in the setting of TLVs (Castleman and Ziem, 1988; Ziem and
Rappaport (1990) postulated that the limits were driven more by exposures in
industry rather than by strict considerations of health. Thus, as the exposures in
industry became lower, through improved technology or better work procedures,
the TLVs got lower.
If Roach and Rappaport (1990) are correct, i.e., that TLVs reflect attainable
exposures at the time they are set, then the history of the TLVs represents the
history of exposures to industrial chemicals over the last 45 years. Since exposures
have, by-and-large, been reduced during this period, analysis of the TLVs over
time allows inferences to be made regarding the rates of reduction in exposure
over time. This report will attempt to show the rate of change between 1946 and
1990 for the TLVs as a whole, for TLVs representing known or suspected
carcinogens, and for TLVs used in selected industries.
BACKGROUND
Roach and Rappaport (1990) reviewed the 1976 and 1986 Documentation of the
TLVs for Chemical Substances to determine the basis for the TLVs. Upon
evaluating the Documentation they found that the TLV Committee has
traditionally emphasized studies involving human exposures. In the 1976
Documentation, 225 of the 488 TLVs listed were at least partly based on human
experience. In the 1986 Documentation 127 of the 600 chemicals listed were at
least partly based on human experience at or below the 1986 TLV. After careful
analysis of the data available from the original references cited by the TLV
Committee, they found that 17% of employees exposed to a concentration at or
adversely affected. These results suggest an overall risk of 1 in 6-7. This finding,
according to Roach and Rappaport, clearly contradicts the official definition of
TLVs as levels to protect "nearly all workers" from adverse health effects over
their working lifetimes (ACGIH, 1992).
Roach and Rappaport (1990) also showed that the TLVs were significantly
correlated with the levels of exposure reported in the studies cited by the TLV
Committee in its documentation. From this, they concluded that the TLVs
reflected the exposure levels at the time the limits were adopted. Such a
conclusion would be consistent with the suggestion of Castleman and Zeim (1988)
that corporations unduly influenced the setting of TLVs through personal
communications with the ACGIH Committee. The ACGIH Board of Directors
responded by stating that they solicited information from all possible sources
through the Notice of Intended Changes (Board of Directors, ACGIH, 1990). They
also stated that the analysis of Roach and Rappaport (1990) was biased because it
was based on a "small nonrepresentative sample of TLVs ..." (Breysse, 1991). To
this Rappaport and Roach (1991) countered that their samples were not biased
merely because they were small. Indeed, because they had investigated all
pertinent studies cited in the Documentation they saw no reason why their results
could not be generalized to the TLVs as a whole.
In a recent paper, Rappaport (1993) studied reductions in TLVs as a function of
time for 27 substances in the "Notice of Intended Changes (for 1991 - 1992)". The
result of his analysis showed overall median fold reductions of 2.0 - 2.5 between
1946 and 1989. This investigation is intended to expand that work by analyzing
TLVs to determine the history of reductions in exposure to all 630 substances on
data will be obtained from a separate database developed by the National Institute
for Occupational Safety and Health (NIOSH).
METHODS
Industrv Specific Data
In order to show the rate of reduction of TLVs over time in various industries the
chemicals listed in the TLV booklet were classified by industry using the National
Occupational Exposure Survey-based Job Exposure Matrix (NOES-based JEM) that
was developed at NIOSH. The JEM was developed on potential exposure data collected during the 1972-1974 National Occupational Hazard Survey (NOHS). The
NOHS was intended to describe the health and safety conditions in the American
workplace and to determine the extent of workers' exposure to chemical, physical,
and biological agents. The survey sample covered non-agricultural businesses that
were under the jurisdiction of the Occupational Safety and Health Act (OSHA) of
1970 and employed more than eight employees (Seiber et al., 1991).
The NOES is classified by industry and occupation and exposures within industry
and occupation. The industries are coded using the Standard Industrial
Classification (SIC) codes and occupations are coded by 1970 Bureau of the Census
occupation codes. Included in the NOES are data on 8,342 different potential
exposure agents in facilities representing 639 SIC codes and 442 occupations.
Chemical agents are coded by the Chemical Abstracts Service (CAS) number and
Because the TLVs are also listed by CAS number, the files were merged by CAS
number. Only those agents that matched exactly by CAS numbers were analyzed. If the agent in the TLV booklet did not have a CAS number it was disregarded. The industry was classified on a broad basis by using the two digit SIC code for
those industries with 50 or more employees in the NOES database. Of these
industries, only those with the highest number of employees and highest percentage
of exposed workers (those without protection) were analyzed since it is likely that
these industries had the most influence on the development of TLVs because they
had the most to lose if they had to meet tougher standards (see Table I).
Fold Reductions
As mentioned above, a database of the agents listed in the ACGIH TLV booklet
and their corresponding TLVs was established along with their associated CAS numbers for each year from 1946 to 1992. The data was entered into an EXCEL (Microsoft Corporation) spreadsheet using an IBM - PC. Only TLVs that have been
adopted are included in this database. If a chemical was listed under the "Notice
of Intended Changes" it was not included until actually adopted. Changes of TLVs were calculated as fold reductions. This calculation was accomplished by dividing the old TLV by the new TLV in the year the change occurred. (Note: A fold
increase would be indicated by a "reduction" less than one). The number of fold
reductions, median fold change, average fold change, maximum fold change,
minimum fold change, and the predicted fold changes (for those series with a
significant linear trend (p < 0.05)) were then calculated for all TLVs, for
industry-specific TLVs, and for known or suspected carcinogens for each five year interval
between 1946 and 1990. Initially, fold reductions were calculated for each year
there were no significant distinctions between the annual fold calculations and the five-year fold reductions. Therefore, to simplify presentation of results, the analysis concentrated on changes that occurred wihtin each five year period from 1946 - 1990. If the TLV had a ceiling value it was divided by 6 to give an
approximate eight-hour time weighted average (Rappaport, 1993).
Interval Between Reductions
Values for the interval between TLV Changes in five year intervals were
calculated in the following manner. Each time a change occurred, the interval
which elapsed between changes was calculated (in years) by subtracting the year in which the existing TLV was adopted from the year in which the change occurred. This process was repeated for each consecutive change. The intervals between changes were calculated from 1951 so the first five year interval (1946 - 1950) did
not bias the results. Once the intervals between changes were calculated the
median interval between changes, average interval between changes, maximum
interval between changes, and minimum interval between changes were calculated
for all TLVs, for industry-specific TLVs, and for known or suspected carcinogens.
If there was a significant linear trend (p < 0.05) then the predicted interval between
changes was calculated as well.
Carcinogens
In trying to compare the rate of change of TLVs for chemicals that are known or suspected carcinogens with those of all TLVs, a list of these carcinogens was extracted from the TLV booklet. Values for the fold change and the interval
Rate of Fold Reduction
The rate of reductions of TLVs was determined for all TLVs, for suspect or known carcinogens, and for TLVs by SIC code in the following manner. First, the time
series of median fold reductions and median intervals were analyzed to determine
whether there was a sigificant linear trend. This was done by doing a trend test on each set of median values. To check for significance (p < 0.05) a t - test was
applied. Using the LINEST function of EXCEL to estimate regressions of median
fold change over time and median interval between changes over time the
estimated slopes and standard errors were computed as well as the degrees of freedom. The estimated slope (m) was divided by its standard error of the slope (se) and this value was compared to the critical value (CV) from the t-distribution with the (n-1) degrees of freedom (df). If the value was greater than the critical value then this set of data was considered to have a significant linear trend. Those series with significant linear trends are shown in the respective tables with predicted intervals or predicted fold reductions for each five year interval. If a
series had a significant trend in both the fold reductions and the interval between
changes then the rate of reduction was calculated using the predicted values for
both sets of data for each five year interval. If only the fold reduction or only
the interval between changes showed a significant trend then the predicted value
for the respective set of data was used in the calculation for the rate of reduction
along with the overall median value for the non-significant set of data. However,
if there were no significant trends in either the fold reductions or the interval
between changes then the overall median values for all years for both sets of data
were used to determine the rate of reduction for that series of data. The rate of
reduction, or percent reduction per year, then was calculated by dividing the
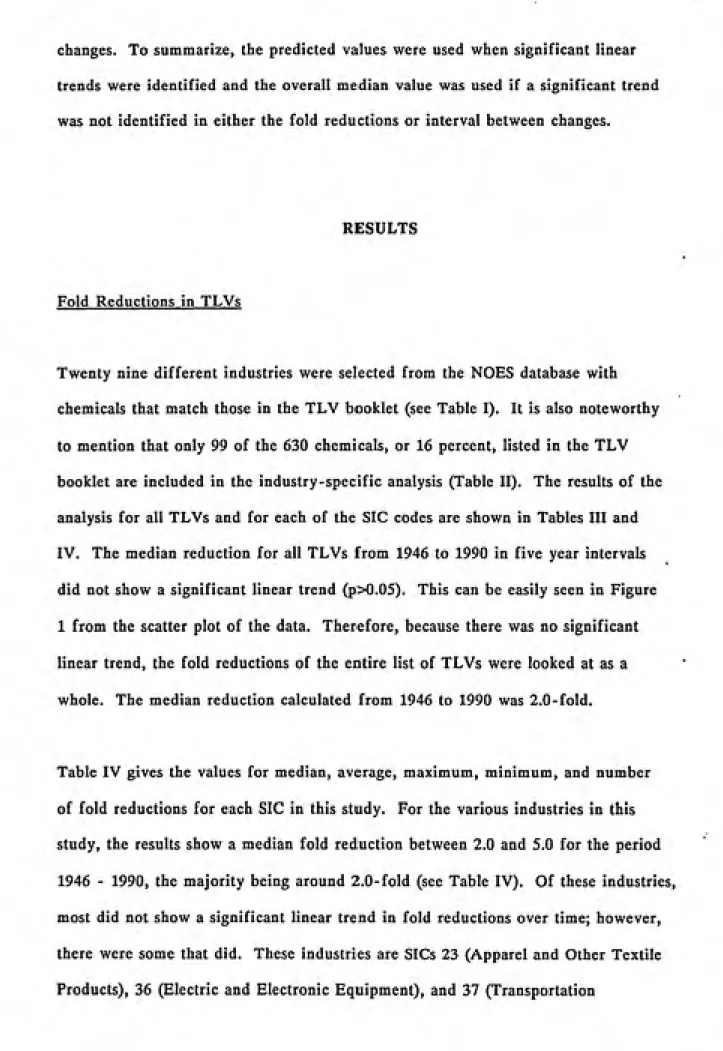
changes. To summarize, the predicted values were used when significant linear
trends were identified and the overall median value was used if a significant trend
was not identified in either the fold reductions or interval between changes.
RESULTS
Fold Reductions in TLVs
Twenty nine different industries were selected from the NOES database with
chemicals that match those in the TLV booklet (see Table I). It is also noteworthy
to mention that only 99 of the 630 chemicals, or 16 percent, listed in the TLV
booklet are included in the industry-specific analysis (Table II). The results of the analysis for all TLVs and for each of the SIC codes are shown in Tables III and
IV. The median reduction for all TLVs from 1946 to 1990 in five year intervals did not show a significant linear trend (p>0.05). This can be easily seen in Figure
1 from the scatter plot of the data. Therefore, because there was no significant
linear trend, the fold reductions of the entire list of TLVs were looked at as a
whole. The median reduction calculated from 1946 to 1990 was 2.0-fold.
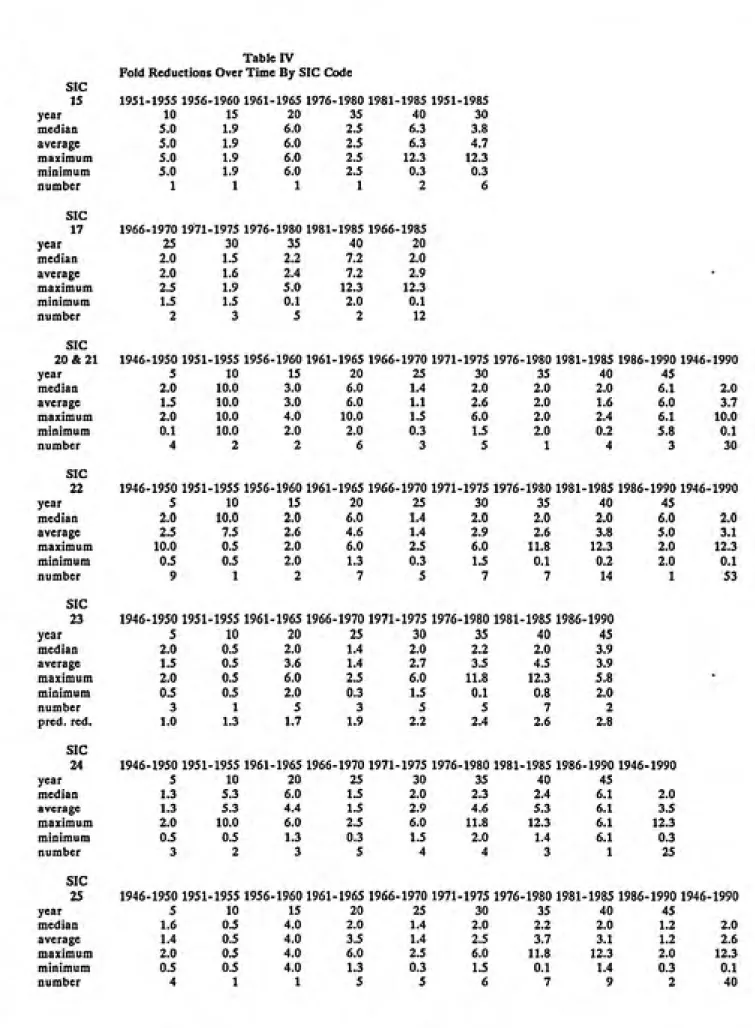
Table IV gives the values for median, average, maximum, minimum, and number of fold reductions for each SIC in this study. For the various industries in this
study, the results show a median fold reduction between 2.0 and 5.0 for the period
1946 - 1990, the majority being around 2.0-fold (see Table IV). Of these industries,
most did not show a significant linear trend in fold reductions over time; however,
there were some that did. These industries are SICs 23 (Apparel and Other Textile
Equipment), all having a positive slope with time. This indicates that as time goes
by the median fold reduction increases for the 3 industries mentioned above. Each
SIC code that did not show a significant linear trend was analysed over the whole
period in which changes occurred within that industry. (For a graphical
representation of the individual SICs look at Figures 2 through 25.) It should be pointed out that some SIC codes were combined with other SIC codes to provide enough data to be analysed. Those SICs that were combined are: SICs 20 (Food
and Kindered Products) and 21 (Tobacco Manufactures), SICS 40 (Railroad
Transportation) and 45 (Transportation by Air), and SICs 49 (Electric, Gas, and Sanitary Services), 72 (Personal Services), 73 (Business Services), and 76
(Miscellaneous Repair Services).
The fold reductions for known or suspected carcinogens did not show a significant
linear trend over time for five year intervals from 1946 - 1990. The median fold
reduction for all known or suspected carcinogens was 2.4 (see Table V). There were 112 reductions between 1946 and 1990 for this category. A plot of the fold
reductions is shown in Figure 26.
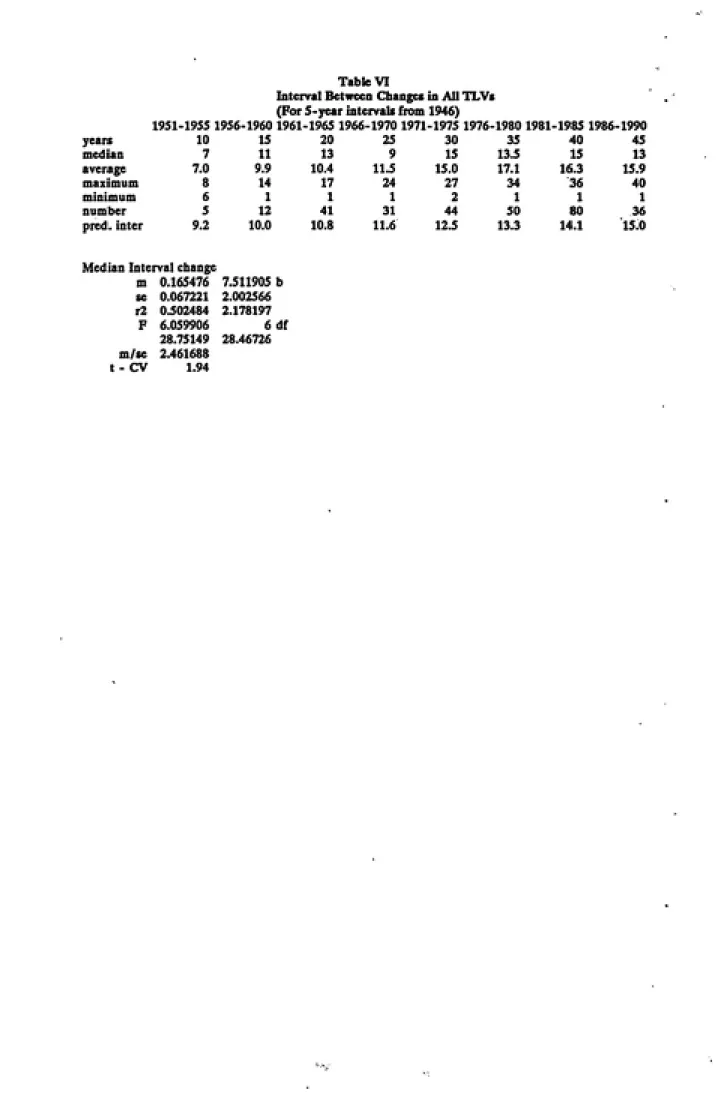
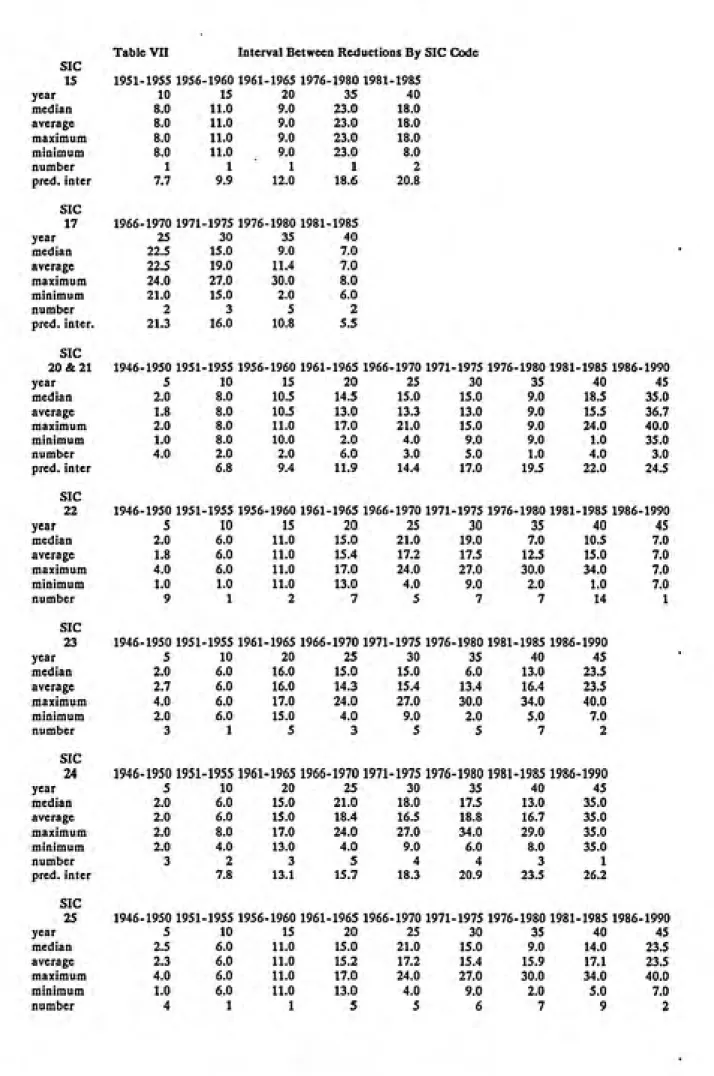
Interval Between Changes
The median interval between changes for all TLVs and for most SIC codes included in this study show definite trends. In most cases, the trend is towards
longer intervals between changes. As can be seen from Table VI, the median
interval between changes for the TLVs as a whole shows that there is a significant
linear trend. The predicted median interval between changes for all the TLVs per five year interval ranges between 9.0 and 15.0 years (see Table VI). This10
industries are generally similar to those for the entire list of TLVs. (See, for
example, SICs 15 (General Building Contractors), 20 (Food and Kindered Products) and 21 (Tobacco Manufacturers), 24 (Lumber and Wood Products), 32 (Stone Clay
and Glass Products), and 38 (Instruments and Related Products)). One industry, however, can be singled out as an exception. SIC 17 (Special Trade Contractors)
has a negative slope and ranges from 21.0 years to 5.5 years between changes (see
Table VII). This indicates that the years between changes have been decreasing
with time. Graphs for each SIC code are provided in Figures 28 through 50. The
information for the median, average, maximum, minimum, and number of intervals
between changes for all SICs and for known or suspected carcinogens can be seen
in Tables VII and VIII respectively. The median interval between changes for
known or suspected carcinogens was 15.0 years. There was not a significant linear
trend for this series of data. The graph of the median interval between changes is
shown in Figure 51.
In looking at these graphs it is interesting to note the cyclical pattern observed in each SIC code. Each SIC code showed an increase in the interval between changes
until 1966 - 1970 when there was a decrease in the interval until 1976 - 1980 when
another decrease was observed, then the interval between changes began to increase again. This cycle appears to be typical of most SIC codes in this analysis. Even the TLVs for known or suspect carcinogens follow this cycle with the exception
that the interval between changes began to decrease between 1980 and 1990.
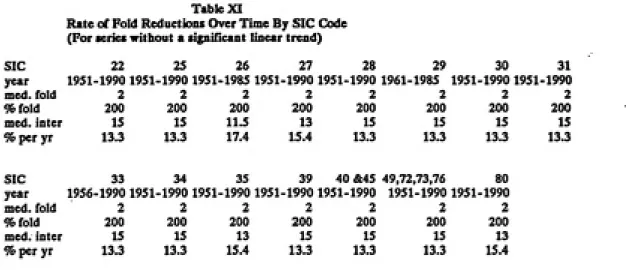
Rate of Fold Reduction in TLVs
The rates of reduction in TLVs were calculated as described in the Methods section
11
known or suspected carcinogens, and for each SIC. Since there was not a
significant linear trend in the fold reductions for all TLVs the entire list of TLVs
was treated as a whole and the overall median fold reduction was 2.0 or 200%.
The rate of reduction calculated for all TLVs ranged from 21.7 to 13.3 Percent Reduction per year between 1951 and 1990 (see Table IX). The graphical
representation of this rate is shown in Figure 52. (Note that the interval is from
1951 since the first five year interval was disregarded in the calculation for the
interval between changes.) The rate of reduction for known or suspected carcinogens was calculated using the overall interval and overall median fold
reduction since there was not a significant linear trend observed in either the fold
reductions or the interval between reductions. The rate of reduction for known or
suspected carcinogens was calculated to be 16% per year (see Table IX). The rates for SICs with significant trends were calculated as described in the Methods
section. The rates for SICs 15, 17, 20 and 21, 23, 24, 32, 36, 37, and 38 showed
significant trends in either the interval between changes or fold reduction (see
Table X). For a graphical representation of the rates of change over time for these SICs see Figures 53 through 61. The rest of the SICs in this study did not show
significant trends and so their rates of reduction was calculated using the overall
interval and the overall median fold reduction for the respective industry (see
Table XI).
As can be seen from Figure 62 for the number of changes per five year interval,
39 changes occurred during the first five years (1946 - 1950) of observation. The number then dropped to 5 and later started increasing until about 1970 before it
decreased again. Another upward cycle is characteristic of the next five year
intervals until the last five years (1985 - 1990) when the number of changes
12
of the number of changes for the entire interval from 1946 to 1990 with predicted
numbers of changes between 18 and 57 (see Figure 63).
DISCUSSION
This analysis is based upon the conjecture of Rappaport (1993) in which he
analysed 27 TLVs for fold reductions over time. In this paper all TLVs, suspect
and known carcinogens, and chemicals in selected industries were analysed to see
if there were any particular industries that had significant influences on the rate
of change of TLVs. In this effort an unbiased attempt was made to include all
TLVs in the analysis by merging the entire list of TLVs with the NOES - based
JEM database. The resultant database contained 29 SICs that used chemicals listed
in the ACGIH-TLV booklet that matched by CAS number. Subsequently, there
were only 99 chemicals from the TLV booklet that were included in this analysis
as part of specific SICs.
Fold Reductions
The results of the fold reductions for most of the SICs did not differ significantly
from the overall fold reduction for all TLVs. One possible reason for this is that
the industries selected included similar chemicals. The overall median fold
reduction for all TLVs was 2.0-fold (Table III) and most of the SICs in this study
had a 2.0-fold reduction as well (Table IV). The known or suspected carcinogens
had a slightly higher fold reduction of 2.4-fold (Table V) between 1946 and 1990
but this too was not significantly different from the overall fold reduction. In
13
fold reduction was also 2.0-fold. It is clear from these results that TLVs have been
decreasing by 2.0-fold since 1946, whenever there was a reduction. Therefore,
from these results it is unlikely that the ACGIH payed strict attention to the health effects of chemicals used in industry when setting TLVs. It is more likely
that the levels of exposures attainable within industry influenced the TLVs since, apparantly, the level of toxicity of the chemical did not play as important a role. Hence, we can say that the levels of exposure within industry has steadily
decreased with time.
From this basically constant decrease in all TLVs by a 2.0-fold reduction it seems likely that the ACGIH - TLV Committee has not changed their overall method of evaluating these chemicals in reaching exposure limits from 1946 to 1990.
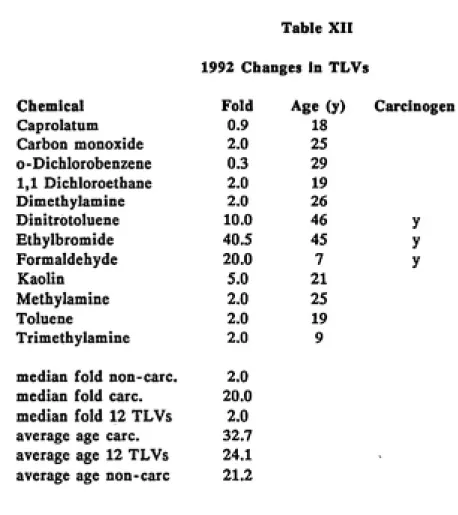
However, if we were to take a closer look at individual agents such as those
considered to be human carcinogens or potential human carcinogens we might find
a much greater fold change in more recent years (Rappaport, 1993). For instance,
in the 1992-1993 TLV booklet there were 12 new changes adopted. Of the 12
changes that were adopted those agents that were not considered to be carcinogenic
had a median change of around a 2.0-fold reduction. However, the 3 agents that
were considered to be carcinogenic had a much greater reduction namely,
dinitrotoluene had a 10.0-fold reduction, ethylbromide had a 40.5-fold reduction, and formaldehyde had a 20.0-fold reduction. The median reducton for these three carcinogenic agents is 20.0-fold (Table XII). This may be due to a more
conservative approach by the committee to assess the risks involved in working with these toxic agents and in an attempt to base their decisions more on health
effects rather than on economic reasons (Rappaport, 1993). It might be noteworthy
also to mention that the average age (the number of years since the last change
14
TLVs are considered to be carcinogens (i.e. dinitrotoluene, 46 years, and
ethylbromide, 45 years), see Table XII. This may lead us to ask how accurate the
evaluations have been in the past 46 years. It appears from the 1992-1993 TLV
changes that the committee is now placing an emphasis on greater reductions of
carcinogenic agents. The non-carcinogenic agents, however, seem to reflect thepast history of fold reductions with a median fold of around 2.0 (see Table XII).
Interval Between Changes
The results from the analysis of the interval between changes indicate that the
intervals have been increasing with time for all TLVs. The predicted intervals
ranged from 9.2 years to 15.0 years for all TLVs (see Table VI). There were 6
industries that had significant linear trends as follows: SIC 15, ranged from 7.7 to
20.8 years; SICs 20 and 21 ranged from 6.8 to 24.5; SIC 24 ranged from 7.8 to 26.2
years; SIC 32 ranged from 11.6 to 17.1 years and SIC 38 ranged from 9.7 to 19.6
years; SIC 17 decreased from 21.3 to 5.5 years. SIC 17 is Special Trade Contractors
and it seems to have a wide range of chemicals. A number of the chemicals appear
to be from welding operations and apparantly have been experiencing shorter
intervals betweeen changes. All other SIC codes in this study had overall median
intervals between 11.5 and 15.0 years, the majority being 15.0 years (see Table VII).
The median interval between changes for known or suspected carcinogens was 15.0
years (see Table VIII). This value was surprising because one would expect greater
attention would be paid to more harmful substances in an effort to reduce
exposures. However, these results seem to be contrary to that opinion. This trend
of longer intervals between changes suggest that it was much easier to reduce
exposures (and, therefore, the TLVs) in the beginning when levels of exposure were
15
contributing factor to the lower levels of exposure today making it more difficult
to reduce exposures. It is interesting to note that many SIC codes showed an
increase in the interval between changes until around 1970 when the OSH Act was passed. The passing of the Act, which required a safe environment for workers, may have contributed to the immediate decrease in the interval between changes but during the 1980's they began to increase again (see Figures 27 to 51). This pattern of events may be symbolic of the priorities of the government at the time.
Rate of Fold Reductions
As determined from this analysis the rate of reduction for all TLVs ranged from 21.7 % per year to 13.3 % per year (see Table IX). It is plain to see that the rates of reduction have been decreasing over time (see Figure 52). From the same
argument given above for the interval between changes, it is much easier to reduce
the TLVs at a faster rate in the beginning when exposures were much higher. Now that there is improved technology within the workplace and better work
procedures, it is more difficult to attain the same rate of reduction as before.
If Roach and Rappaport were correct in speculating that the TLVs reflect
exposures at the time they are set then the rate of reduction determined above is
the rate of reduction of exposure over time. Given the fact that there is little
16
CONCLUSION
It has been suggested that Threshold Limit Values reflect exposures in industry at
the time they were set (Roach and Rappaport, 1990). Therefore, the rate of
reduction of the TLVs may be a reflection of the rate of reduction in exposure.
All TLVs have been reducing by about 2.0-fold (median value) since 1946 and this
level of reduction is evidenced in the various industries selected in this report
from the NOES - based JEM database. Known and suspected carcinogens showed a
2.4 median fold reduction which is not significantly different from the overall
value for all TLVs. The median interval between changes for all TLVs has been
increasing over time and this too is evidenced in the various industries included in
this report. The median interval between changes ranged from 9.2 to 15.0 years
with most of the SIC codes being 15.0 years. The median interval between changes
for carcinogens was also 15.0 years. The rate of change for all TLVs was between
21.7 and 13.3 % reduction per year indicating a steady decrease in the rate of
exposure. The rate of exposure for the various industries in this study were
between 13.3 and 15.4 % reduction per year and the rate for known or suspected
carcinogens was 16.0 % reduction per year. These values reflect the exposure rate
in industry over time and may be used as guides for inferring historical levels of
17
REFERENCES
ACGIH, Threshold Limit Values - Discussion And Thirty-Five Year Index With
Recommendations, Vol. 9, ACGIH, Cincinati, 1984.
ACGIH, Threshold Limit Values for Chemical Substances and Workroom Environment
with Intended Changes forl980, ACGIH, Cincinnati, 1980.
ACGIH, Threshold Limit Values for Chemical Substances and Workroom Environment
with Intended Changes forl981, ACGIH, Cincinnati, 1981.
ACGIH, Threshold Limit Values for Chemical Substances and Workroom Environment with Intended Changes for 1982, ACGIH, Cincinnati, 1982.
ACGIH, Threshold Limit Values for Chemical Substances and Workroom Environment
with Intended Changes forl983-1984, ACGIH, Cincinnati, 1983.
ACGIH, Threshold Limit Values for Chemical Substances and Workroom Environment
with Intended Changes forl984-1985, ACGIH, Cincinnati, 1984.
ACGIH, Threshold Limit Values and Biological Exposure Indices for 1985-1986,
ACGIH, Cincinnati, 1985.
ACGIH, Threshold Limit Values and Biological Exposure Indices for 1986-1987,
ACGIH, Cincinnati, 1986.
ACGIH, Threshold Limit Values and Biological Exposure Indices for 1987-1988,
ACGIH, Cincinnati, 1987.
ACGIH, Threshold Limit Values and Biological Exposure Indices for 1988-1989,
ACGIH, Cincinnati, 1988.
ACGIH, Threshold Limit Values and Biological Exposure Indices for 1989-1990,
ACGIH, Cincinnati, 1989.
ACGIH, Threshold Limit Values and Biological Exposure Indices for 1990-1991,
ACGIH, Cincinnati, 1990.
ACGIH, Threshold Limit Values and Biological Exposure Indices for 1991-1992,
18
ACGIH, Threshold Limit Values and Biological Exposure Indices for 1992-1993,
ACGIH, Cincinnati, 1992.
ACGIH, Board of Directors, "Threshold Limit Values: A More Balanced Appraisal,"
Applied Occupational and Environmental Hygiene, Vol. 5(6), pp. 340-344, (June 1990).
ACGIH, Documentation of the Threshold Limit Values, 3rd ed., 3rd printing, ACGIH,
Cincinnati, 1976.
ACGIH, Documentation of the Threshold Limit Values, 5th ed., ACGIH, Cincinnati,
1986.
Breysse, P. A., "ACGIH TLVs: A Critical Analysis of the Documentation,"
American Journal of Industrial Medicine, Vol. 20, pp. 423-428, (1991).
Castleman, B. I., Zeim, G. E., "Corporate Influence on Threshold Limit Values,"
American Journal of Industrial Medicine, Vol. 13, pp. 531-559, (1988).
Zeim, G. E., Castleman, B. I., "Threshold Limit Values: Historical Perspectives and
Current Practice," Journal of Occupational Medicine, Vol. 31, pp. 910-918, (1989).
Rappaport, S. M., "Threshold Limit Values, Permissible Exposure Limits, and
Feasibility: The Bases for Exposure Limits in the United States," American Journal
of Industrial Medicine, Vol. 23, pp. 683-694, (1993).
Rappaport, S. M., Roach, S. A., "Response to ACGIH "Critical Analysis," American
Journal of Industrial Medicine, Vol. 20, pp. 429-430, (1991).
Roach, S. A., Rappaport, S. M., "But They Are Not Thresholds: A Critical Analysis
of the Documentation of Threshold Limit Values," American Journal of Industrial
Medicine,Vol 17, pp. 727-753, (1990).
Seiber, W. K. Jr., Sundin, D. S., Frazier, T. M., Robinson, C. F., "Development, Use, and Availability of a Job Exposure Matrix Based on National Occupational Hazard
19
Table I
List of Standard Industry Codes (SIC)
SIC Name
15 General Building contractors 17 Special Trade Contractors
20 Food and Kindered Products 21 Tobacco Manufacturers
22 Textile Mill Products
23 Apperel and Other Textile Products
24 Lumber and Wood Products 25 Furniture and Fixtures
26 Paper and Allied Products
27 Printing and Publishing
28 Chemicals and Allied Products
29 Petroleum and Coal Products
30 Rubber and Miscellaneous Plastic Products 31 Leather and Leather Products
32 Stone, Clay, and Glass Products
33 Primary Metal Industries
34 Fabricated Metal Products
35 Machinery, Except Electrical
36 Electrical and Electronic Equipment
37 Transportation Equipment
38 Instruments and Related Products 39 Miscellaneous Manufacturing Industries
40 Railroad Transportation 45 Transportation By Air
49 Electric, gas, and Sanitary Services
72 Personal Services
73 Business Services
76 Miscellaneous Repair Services
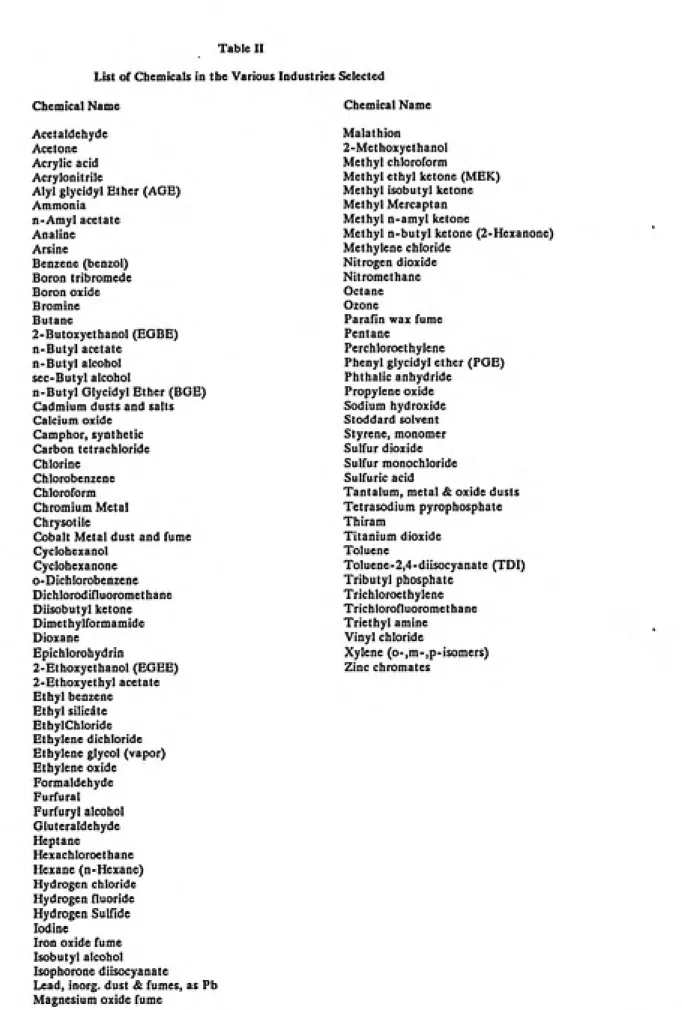
Table II
List of Chemicals in the Various Industries Selected
Chemical Name Chemical Name
Acetaldehyde
Acetone
Acrylic acid
Acrylonitrile
Alyl glycidyl Ether (AGE)
Ammonia n-Amyl acetate Analine Arsine Benzene (benzol) Boron tribromede Boron oxide Bromine Butane 2-Butoxyethanol (EGBE) n-Butyl acetate n-Butyl alcohol sec-Butyl alcohol
n-Butyl Glycidyl Ether (BGE)
Cadmium dusts and salts
Calcium oxide Camphor, synthetic Carbon tetrachloride Chlorine Chlorobenzene Chloroform Chromium Metal Chrysotile
Cobalt Metal dust and fume
Cyclohexanol Cyclohexanone o-Dichlorobenzene Dichlorodifluoromethane Diisobutyl ketone Dimethylformamide Dioxane Epichlorohydrin 2-Hthoxyethanol (EGEE) 2-Ethoxyethyl acetate Ethyl benzene Ethyl silicate EthylChloride Ethylene dichloride
Ethylene glycol (vapor) Ethylene oxide Formaldehyde Furfural Furfuryl alcohol Gluteraldehyde Heptane Hexachloroethane Hexane (n-Hexane) Hydrogen chloride Hydrogen fluoride Hydrogen Sulfide Iodine
Iron oxide fume
Isobutyl alcohol
Isophorone diisocyanate
Lead, inorg. dust & fumes, as Pb Magnesium oxide fume
Malathion
2-Methoxycthanol Methyl chloroform
Methyl ethyl ketone (MEK) Methyl isobutyl ketone
Methyl Mercaptan
Methyl n-amyl ketone
Methyl n-butyl ketone (2-Hexanone) Methylene chloride
Nitrogen dioxide
Nitromcthane
Octane Ozone
Parafin wax fume
Pentane
Perchloroethylene
Phenyl glycidyl ether (PGE)
Phthalic anhydride Propylene oxide Sodium hydroxide Stoddard solvent Styrene, monomer Sulfur dioxide Sulfur monochloride Sulfuric acid
Tantalum, metal & oxide dusts
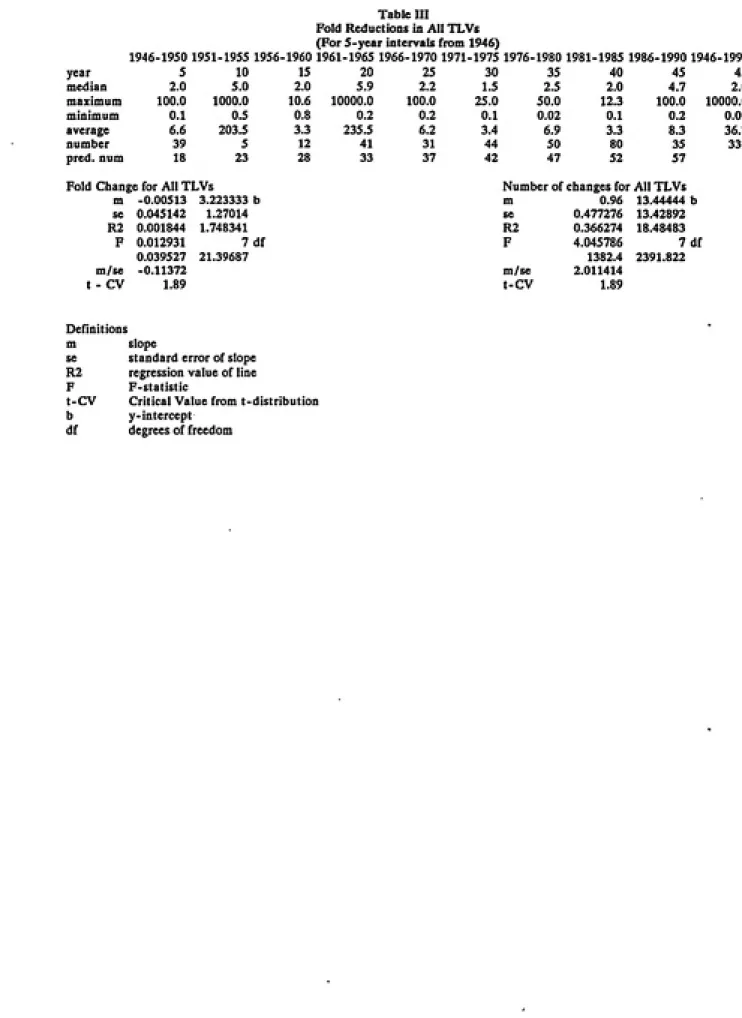
Table III Fold Reductions in All TLVs
(For 5-year intervals from 1946)
1946-1950 1951-1955 1956ͣ1960 1961-1965 1966 -1970 1971-1975 1976- 1980 1981-1985 1986-1990 1946-1990
year 5 10 15 20 25 30 35 40 45 45
median 2.0 5.0 2.0 5.9 2.2 1.5 2.5 2.0 4.7 2.0
maximum 100.0 1000.0 10.6 10000.0 100.0 25,0 50.0 12.3 100.0 10000.0
minimum 0.1 0.5 0.8 0.2 0.2 0.1 0.02 0.1 0.2 0.02
average 6.6 203.5 3.3 235.5 6.2 3.4 6.9 3.3 8.3 36.7
number 39 5 12 41 31 44 50 80 35 337
pred. num 18 23 28 33 37 42 47 52 57
Fold Changc for All TLVs Number ofchanges for AH TLVs
m -0.00513 3.223333 b m 0.96 13.44444 b
se 0.045142 1.27014 se 0.477276 13.42892
R2 0.001844 1.748341 R2 0.366274 18.48483
F 0.012931 0.039527 7 df 21.39687 F 4.045786 1382.4 7df 2391.822
m/se -0.11372 m/se 2.011414
t - CV 1.89 t-CV 1.89
Definition!
m slope
se standard error of slope
R2 regression value of line
F F-slalistic
t-CV Critical Val ue from t-distribution b y-intercept
Table IV
Fold Reductions Over Time By SIC Code
SIC
15 1951-1955 1956 1960 1961- 1965 1976 1980 1981 1985 1951 1985
year 10 15 20 35 40 30
median 5.0 1.9 6.0 2.5 6.3 3.8
average 5.0 1.9 6.0 2.5 6.3 4.7
maximum 5.0 1.9 6.0 2.5 12.3 12.3
minimum 5.0 1.9 6.0 2.5 0.3 0.3
number 1 1 1 1 2 6
SIC
17 1966-1970 1971 1975 1976- 1980 1981 1985 1966 1985
year 25 30 35 40 20
median 2.0 1.5 2.2 7.2 2.0
average 2.0 1.6 2.4 7.2 2.9
maximum 2.5 1.9 5.0 12.3 12.3
minimum 1.5 1.5 0.1 2.0 0.1
number 2 3 5 2 12
SIC
20&21 1946-1950 1951 -1955 1956 1960 1961-1965 1966-1970 1971 -1975 1976 1980 1981 1985 1986 1990 1946 1990
year 5 10 15 20 25 30 35 40 45
median 2.0 10.0 3.0 6.0 1.4 2.0 2.0 2.0 6.1 2.0
average 1.5 10.0 3.0 6.0 1.1 2.6 2.0 1.6 6.0 3.7
maximum 2.0 10.0 4.0 10.0 1.5 6.0 2.0 2.4 6.1 10.0
minimum 0.1 10.0 2.0 2.0 0.3 1.5 2.0 0.2 5.8 0.1
number 4 2 2 6 3 5 1 4 3 30
SIC
22 1946-1950 1951 -1955 1956- 1960 1961ͣ1965 1966 1970 1971ͣ1975 1976 1980 1981 1985 1986- 1990 1946 1990
year 5 10 15 20 25 30 35 40 45
median 2.0 10.0 2.0 6.0 1.4 2.0 2.0 2.0 6.0 2.0
average 2.5 7.5 2.6 4.6 1.4 2.9 2.6 3.8 5.0 3.1
maximum 10.0 0.5 2.0 6.0 2.5 6.0 11.8 12.3 2.0 12.3
minimum 0.5 0.5 2.0 1.3 0.3 1.5 0.1 0.2 2.0 0.1
number 9 1 2 7 5 7 7 14 1 53
SIC
23 1946-1950 1951-1955 1961- 1965 1966-1970 1971 1975 1976 -1980 1981 1985 1986 1990
year 5 10 20 25 30 35 40 45
median 2.0 0.5 2.0 1.4 2.0 2.2 2.0 3.9
average 1.5 0.5 3.6 1.4 2.7 3.5 4.5 3.9
maximum 2.0 0.5 6.0 2.5 6.0 11.8 12.3 5.8
minimum 0.5 0.5 2.0 0.3 1.5 0.1 0.8 2.0
number 3 1 5 3 5 5 7 2
pred. red. 1.0 1.3 1.7 1.9 2.2 2.4 2.6 2.8
SIC
24 1946-1950 1951 1955 1961- 1965 1966-1970 1971 1975 1976-1980 1981 1985 1986 1990 1946 1990
year 5 10 20 25 30 35 40 45
median 1.3 5.3 6.0 1.5 2.0 2.3 2.4 6.1 2.0
average 1.3 5.3 4.4 1.5 2.9 4.6 5.3 6.1 3.5
maximum 2.0 10.0 6.0 2.5 6.0 11.8 12.3 6.1 12.3
minimum 0.5 0.5 1.3 0.3 1.5 2.0 1.4 6.1 0.3
number 3 2 3 5 4 4 3 1 25
SIC
25 1946-1950 1951 -1955 1956 1960 1961 -1965 1966 -1970 1971 -1975 1976 -1980 1981ͣ1985 1986 -1990 1946 -1990
year 5 10 15 20 25 30 35 40 45
median 1.6 0.5 4.0 2.0 1.4 2.0 2.2 2.0 1.2 2.0
average 1.4 0.5 4.0 3.5 1.4 2.5 3.7 3.1 1.2 2.6
maximum 2.0 0.5 4.0 6.0 2.5 6.0 11.8 12.3 2.0 12.3
minimum 0.5 0.5 4.0 1.3 0.3 1.5 0.1 1.4 0.3 0.1
35 40
2.3 2.4 2.0
1.9 5.8 3.0
2.5 12.3 12.3
0.1 2.0 0.1
6 5 31
35 40 2.2 2.0 2.0 4.3 5.0 12.3 0.1 1.4 5 13 45 2.0 2.0 1.4 2.9 2.0 12.3 0.3 0.1 3 52
30 35 40
2.0 2.5 2.0
1.7 4.7 3.8
2.1 11.8 12.3 1.2 2.0 0.2
9 5 16
45 2.0 2.0 3.0 2.9 4.9 12.3 2.0 0.2 3 61 SIC
26 1946-1950 1956-1960 1961-1965 1966-1970 1971-1975 1976-1980 1981-1985 1946-1985
year 5 15 20 25 30
median 2.0 3.0 6.0 1.5 2.0
average 1.8 3.0 4.8 1.5 2.7
maximum 2.0 4.0 6.0 3.4 6.0 minimum 1.3 1.9 1.3 0.3 1.5 number 3 2 4 6 5
SIC
27 1946-1950 1951-1955 1956-1960 1961-1965 1966-1970 1971-1975 1976-1980 1981-1985 1986-1990 1946-1990
year 5 10 15 20 25 30
median 2.0 0.5 2.4 4.0 2.3 2.0
average 2,6 0.5 2.4 3.9 3.0 1.7
maximum 5.0 0.5 4.0 6.0 6.0 2.1
minimum 1.3 0.5 0.8 1.3 0.2 1.2 number 7 1 2 6 6 9
SIC
28 1946-1950 1951-1955 1956-1960 1961-1965 1966-1970 1971-1975 1976-1980 1981-1985 1986-1990 1946-1990
year 5 10 15 20 25
median 2.0 0.5 2.0 4.0 1.4
average 2.1 0.5 2.2 3.9 1.9
maximum 5.0 0.5 4.0 6.0 6.0
minimum 0.5 0.5 0.8 1.3 0.2
number 9 14 8 6
SIC
29 1946-1950 1961-1965 1966-1970 1971-1975 1981-1985 1946-1985
year 5 20 25 30 40
median 2.0 6.0 0.3 2.0 0.3 2.0
average 2.0 6.0 0.3 3.3 0.3 3.3
maximum 2.0 6.0 0.3 6.0 2.4 6.0 minimum 2.0 6.0 0.3 2.0 2.4 0.3 number 3 3 1 3 1 11
SIC
30 1946-1950 1951-1955 1956-1960 1961-1965 1966-1970 1971-1975 1976-1980 1981-1985 1986-1990 1946-1990
year 5 10 15 20 25
median 2.0 1.3 3.0 2.2 1.5
average 4.1 1.3 3.0 3.3 1.5
maximum 10.0 2.0 4.0 6.0 2.5
minimum 1.3 0.5 2.0 1.3 0.3 number 5 2 2 6 5
SIC
31 1946-1950 1951-1955 1956-1960 1961-1965 1966-1970 1971-1975 1976-1980 1981-1985 1986-1990 1946-1990
year 5 10 15 20 25 30 35 40 45
median 2.0 0.5 4.0 6.0 1.5 1.7
average 4.4 0.5 4.0 4.4 1.4 1.7
maximum 10.0 0.5 4.0 6.0 2.5 2.0 minimum 1.3 0.5 4.0 1.3 0.3 1.5 number 3 11 3 4 4
SIC
32 1946-1950 1956-1960 1961-1965 1966-1970 1971-1975 1976-1980 1981-1985 1986-1990 1946-1990
year 5 15 20 25 30
median 2.0 4.0 6.0 0.9 1.7
average 1.9 5.6 4.3 2.0 2.1
maximum 2.0 10.6 6.0 6.0 6.0 minimum 1.3 2.0 1.3 0.2 0.1 number 5 3 5 4 8
30 35 40
1.5 2.3 2.0
2.1 5.8 3.1 6.0 39.2 12.3
1.2 0.1 0.2
9 10 11
25 30 1.5 2.0 2.0 3.3 6.0 10.0 0.2 1.3 7 8 35 40 2.1 2.2 2.0 3.1 2.5 12.3 0.8 0.2 6 10 45 2.0 2.0 3.3 2.7 5.8 12.3 2.0 0.2 3 49
25 30 35 40
1.5 2.0 2.5 2.0
1.5 3.7 5.7 2.8
2.5 16.9 39.2 10.3
0.3 1.3 0.2 0.2
6 12 14 16
45 5.0 2.0 4.3 3.4 5.8 39.2 2.0 0.2 3 72
1.5 2.0 2.1 2.0
1.5 2.6 3.0 3.4
2.5 10.0 11.8 12.3 0.3 0.2 0.1 0.2
6 13 10 18
2.0 2.0 2.0 2.9 2.0 12.3 2.0 0.1 1 70 SIC
33 1946-1950 1956-1960 1961-1965 1966-1970 1971-1975 1976-1980 1981-1985 1986-1990 1946-1990
year 5 15 20
median 1.8 2.4 6.0
average 1.5 2.4 4.3
maximum 2.0 4.0 6.0
minimum 0.2 0.8 1.3 number 8 2 5
SIC
34 1946-1950 1951-1955 1956-1960 1961-1965 1966-1970 1971-1975 1976-1980 1981-1985 1986-1990 1946-1990
year 5 10 15 20
median 2.0 0.5 1.4 4.0
average 1.8 0.5 2.1 3.9
maximum 4.0 0.5 4.0 6.0 minimum 0.5 0.5 0.8 1.3 number 11 13 6
SIC
35 1946-1950 1951-1955 1956-1960 1961-1965 1966-1970 1971-1975 1976-1980 1981-1985 1986-1990 1946-1990
year 5 10 15 20 25 30 35 40 45
median 2.0 0.5 4.0 2.0
average 2.7 0.5 5.1 3.6
maximum 10.0 0.5 10.6 6.0 minimum 0.5 0.5 0.8 1.3 number 11 1 3 7
SIC
36 1946-1950 1951-1955 1956-1960 1961-1965 1966-1970 1971-1975 1976-1980 1981-1985 1986-1990
year 5 10 15 20 25 30 35 40 45
median 2.0 0.5 2.0 2.0 1.4 1.5 2.5 2.0 5.8
average 1.6 0.5 2.3 3.2 1.4 3.7 5.8 2.8 5.0
maximum 2.0 0.5 4.0 6.0 2.5 25.0 39.2 12.3 6.1 minimum 0.5 0.5 0.8 1.3 0.3 0.2 0.0 0.1 2.0 number 9 13 9 5 13 15 16 5
pred. red 0.8 1.2 1.5 1.9 2.2 2.5 2.9 3.2 3.5
SIC
37 1946-1950 1951-1955 1956-1960 1961-1965 1966-1970 1971-1975 1976-1980 1981-1985 1986-1990
year 5 10 15 20 25 30 35 40 45
median 2.0 1.4 2.0 2.2 1.5 2.0 2.5 2.0 5.0
average 14.0 4.0 6.0 12.0 7.0 20.0 22.0 31.0 9.0
maximum 10.0 10.0 4.0 6.1 5.2 25.0 39.2 12.3 6.5 minimum 0.5 0.5 0.8 1.3 0.3 0.2 0.0 0.2 0.9 number 14 4 6 12 7 20 22 31 9
pred. red. 1.3 1.6 1.8 2.0 2.3 2.5 2.8 3.0 3.3
SIC
38 1946-1950 1951-1955 1956-1960 1961-1965 1966-1970 1971-1975 1976-1980 1981-1985 1986-1990 1946-1990
year 5 10 15 20 25
median 1.8 0.5 2.4 4.0 1.4
average 2.3 0.5 2.4 3.9 1.4
maximum 10.0 0.5 4.0 6.0 2.5 minimum 0.2 0.5 0.8 1.3 0.3
number 10 1 2 6 5 SIC
39 1946-1950 1951-1955 1956-1960 1961-1965 1966-1970 1971-1975 1976-1980 1981-1985 1986-1990 1946-1990
year 5 10 15 20 25
median 1.5 0.5 2.4 6.0 0.9
average 1.5 0.5 2.4 4.3 0.9
maximum 2.0 0.5 4.0 6.0 1.4 minimum 0.5 0.5 0.8 1.3 0.3
number 7 12 5 2
30 35 40
1.7 2.5 2.0
2.1 3.0 3.3
6.0 11.8 12.3
1.2 0.1 0.8
10 12 13
45 3.9 2.0 3.9 2.7 5.8 12.3 2.0 0.1 2 61
30 35 40
1.7 2.2 2.0
2.4 4.1 2.7
6.0 11.8 10.0
1.3 0.1 0.2
6 4 9
45
2.0 2.0 2.0 2.6 2.0 11.8
2.0 0.1
SIC
40&45 1946-1950 1951 -1955 1956- 1960 1961ͣ1965 1966- 1970 1971 1975 1976 1980 1981-1985 1986 1990 1946 1990
year 5 10 15 20 25 30 35 40 45
median 2.0 0.5 1.9 6.0 1.4 1.7 2.5 2.0 4.9 2.0
average 2.5 0.5 1.7 4.5 1.9 1.9 3.3 2.5 5.0 2.8
maximum 10.0 0.5 2.0 6.0 6.0 6.0 11.8 10.0 10.3 11.8
minimum 0.5 0.5 0.8 1.3 0.2 0.2 0.1 0.1 2.0 0.1
number 12 1 5 6 7 8 10 18 5 72
SIC
49,72,73,76 1946-1950 1951 1955 1956-1960 1961 1965 1966-1970 1971 1975 1976 1980 1981 1985 1986- 1990 1946 1990
year 5 10 15 20 25 30 35 40 45
median 2.1 0.5 2.0 6.0 1.5 2.0 2.0 2.0 2.0 2.0
average 2.4 0.5 2.3 4.4 2.0 3.0 2.1 3.6 2.0 2.9
maximum 5.0 0.5 4.0 6.0 6.0 6.0 2.2 12.3 2.0 12.3
minimum 2.0 0.5 0.8 2.0 0.2 1.3 2.0 0.2 2.0 0.2
number 7 1 3 5 6 10 3 10 1 46
SIC
80 1946-1950 1951 1955 1956-1960 1961 1965 1966-1970 1971 1975 1976 1980 1981 1985 1986- 1990 1946 1990
year 5 10 15 20 25 30 35 40 45
median 2.0 0.5 2.0 6.0 1.4 2.0 2.3 2.0 2.0 2.0
average 3.1 0.5 2.5 5.4 2.0 2.4 3.2 3.6 2.0 3.1
maximum 10.0 0.5 4.0 10.0 6.0 6.0 11.8 12.3 2.0 12.3
minimum 0.1 0.5 2.0 2.0 0.2 1.5 0.1 0.2 2.0 0.1
Table V
Fold Reductions for All Carcinogens (For 5-year intervals from 1946)
1946-1950 1951-1955 1956
year 5 10
median 2.0 2.0
average 4.3 334.3
maximum 25.0 1000.0
minimum 0.2 0.8
number 11.0 3.0
9601961-1965 1966 1970 1971 1975 1976-1980 1981-1985 1986-1990 1946-1990
15 20 25 30 35 40 45
2.0 5.0 5.7 1.5 2.5 2.2 4.7 2.4
1.6 781.1 6.7 1.7 8.9 3.5 15.2 104.8
2.0 10000.0 12.8 6.0 50.0 11.1 100.0 10000.0
0.8 2.0 2.5 0.2 0.0 0.1 0.4 0.0
5.0 13.0 4.0 15.0 21.0 27.0 13.0 112
Median Fold Reductions for Carcinogens
df
m 0.029533 2.328333
se 0.042529 1.196632 R2 0.064449 1.647157
F 0.482221 7
1.308327 18.99187
m/se 0.694422
Table VI
Interval Between Changes in All TLVs (For 5-year intervals from 1946)
1951-1955 1956-1960 1961-1965 1966-1970 1971 -1975 1976-1980 1981-1985 1986 1990
years 10 15 20 25 30 35 40 45
median 7 11 13 9 15 13.5 15 13
average 7.0 9.9 10.4 11.5 15.0 17.1 16.3 15.9
maximum 8 14 17 24 27 34 36 40
minimum 6 1 1 1 2 1 1 1
number • 5 ͣ 12 41 31 44 50 80 36
pred. inter 9.2 10.0 10.8 11.6 12.5 13.3 14.1 15.0
Median Interval change
m 0.165476 7.511905
se 0.067221 2.002566 r2 0.502484 2.178197
F 6.059906 6
28.75149 28.46726
m/se 2.461688
- CV 1.94
10 15 20 25 30
8.0 10.5 14.5 15.0 15.0 8.0 10.5 13.0 13.3 13.0 8.0 11.0 17.0 21.0 15.0
8.0 10.0 2.0 4.0 9.0
2.0 2.0 6.0 3.0 5.0
35 40 45
9.0 18.5 35.0 9.0 15.5 36.7
9.0 24.0 40.0 9.0 1.0 35.0
1.0 4.0 3.0
Table VII Interval Between Reductions By SIC Code
SIC
15 1951-1955 1956-1960 1961-1965 1976-1980 1981-1985
year 10 15 20 35 40
median 8.0 11.0 9.0 23.0 18.0
average 8.0 11.0 9.0 23.0 18.0
maximum 8.0 11.0 9.0 23.0 18.0 minimum 8.0 11.0 9.0 23.0 8.0 number 11112
pred. inter 7.7 9.9 12.0 18.6 20.8 SIC
17 1966-1970 1971-1975 1976-1980 1981-1985
year 25 30 35 40
median 22.5 15.0 9.0 7.0
average 22.5 19.0 11.4 7.0
maximum 24.0 27.0 30.0 8.0
minimum 21.0 15.0 2.0 6.0
number 2 3 5 2
pred. inter. 21.3 16.0 10.8 5.5
SIC
20 & 21 1946-1950 1951-1955 1956-1960 1961-1965 1966-1970 1971-1975 1976-1980 1981-1985 1986-1990
year 5 median 2.0 average 1.8 maximum 2.0 minimum 1.0 number 4.0
pred. inter 6.8 9.4 11.9 14.4 17.0 19.5 22.0 24.5
SIC
22 1946-1950 1951-1955 1956-1960 1961-1965 1966-1970 1971-1975 1976-1980 1981-1985 1986-1990
year 5 10 15 20 25 30 35 40 45
median 2.0 6.0 11.0 15.0 21.0 19.0 7.0 10.5 7.0
average 1.8 6.0 11.0 15.4 17.2 17.5 12.5 15.0 7.0
maximum 4.0 6.0 11.0 17.0 24.0 27.0 30.0 34.0 7.0 minimum 1.0 1.0 11.0 13.0 4.0 9.0 2.0 1.0 7.0 number 9 12 7 5 7 7 14 1
SIC
23 1946-1950 1951-1955 1961-1965 1966-1970 1971-1975 1976-1980 1981-1985 1986-1990
year 5 median 2.0 average 2.7 maximum 4.0 minimum 2.0 number 3 SIC
24 1946-1950 1951-1955 1961-1965 1966-1970 1971-1975 1976-1980 1981-1985 1986-1990 year 5 median 2.0 average 2.0 maximum 2.0 minimum 2.0 number 3
pred. inter 7.8 13.1 15.7 18.3 20.9 23.5 26.2
SIC
25 1946-1950 1951-1955 1956-1960 1961-1965 1966-1970 1971-1975 1976-1980 1981-1985 1986-1990
year 5 median 2.5 average 2.3 maximum 4.0 minimum 1.0 number 4
10 20 25 30 35 40 45
6.0 16.0 15.0 15.0 6.0 13.0 23.5 6.0 16.0 14.3 15.4 13.4 16.4 23.5
6.0 17.0 24.0 27.0 30.0 34.0 40.0 6.0 15.0 4.0 9.0 2.0 5.0 7.0
1 5 3 5 5 7 2
10 20 25 30 35 40 45
6.0 15.0 21.0 18.0 17.5 13.0 35.0 6.0 15.0 18.4 16.5 18.8 16.7 35.0
8.0 17.0 24.0 27.0 34.0 29.0 35.0 4.0 13.0 4.0 9.0 6.0 8.0 35.0
2 3 5 4 4 3 1
10 15 20 25 30 35 40 45
6.0 11.0 15.0 21.0 15.0 9.0 14.0 23.5 6.0 11.0 15.2 17.2 15.4 15.9 17.1 23.5 6.0 11.0 17.0 24.0 27.0 30.0 34.0 40.0 6.0 11.0 13.0 4.0 9.0 2.0 5.0 7.0
5 15 20 2.0 U.0 15.0 2.0 11.0 15.0
2.0 11.0 15.0 2.0 11.0 15.0
3 2 4
25 30 35 40
2.5 9.0 10.0 10.5 2.5 13.7 17.3 12.0
4.0 27.0 34.0 24.0 1.0 5.0 8.0 3.0
6 5 6 5
SIC
26 1946-1950 1956-1960 1961-1965 1966-1970 1971-1975 1976-1980 1981-1985
year median average maximum minimum number SIC
27 1946-1950 1951-1955 1956-1960 1961-1965 1966-1970 1971-1975 1976-1980 1981-1985 1986-1990
year 5 median 2.1 average 1.7 maximum 2.0 minimum 1.0 number 7 SIC
28 1946-1950 1951-1955 1956-1960 1961-1965 1966-1970 1971-1975 1976-1980 1981-1985 1986-1990
year 5
median 2.0
average 1.9
10 15 20 25 30 35 40 45
6.0 11.0 15.0 10.5 15.0 6.0 10.5 19.0
6.0 11.0 15.2 11.8 16.7 14.4 14.3 22.0 6.0 11.0 17.0 24.0 27.0 30.0 34.0 40.0 6.0 11.0 13.0 3.0 5.0 2.0 3.0 7.0
1 2 6 6 9 5 13 3
10 15 20 25 30 35 40 45
6.0 11.0 15.0 12.5 16.0 26.0 17.0 9.0
6.0 10.8 15.4 12.5 19.1 21.0 16.4 11.7 6.8 11.0 17.0 22.0 27.0 30.0 34.0 19.0
6.0 10.0 13.0 3.0 9.0 9.0 1.0 7.0
1 4 3 6 9 5 16 3
5 20 2.0 15.0 2.0 15.7 2.0 17.0 2.0 15.0 3 3
25 30 40
4.0 15.0 13.0 4.0 17.0 13.0
4.0 27.0 13.0 4.0 9.0 13.0
1 3 1
maximum 4.0 minimum 1.0
number 9
SIC
29 1946-1950 1961-1965 1966-1970 1971-1975 1981-1985
year median average maximum minimum number SIC
30 1946-1950 1951-1955 1956-1960 1961-1965 1966-1970 1971-1975 1976-1980 1981-1985 1986-1990
year 5 median 1.0 average 1.4 maximum 2.0 minimum 1.0 number 5 SIC
31 1946-1950 1951-1955 1956-1960 1961-1965 1966-1970 1971-1975 1976-1980 1981-1985 1986-1990 year 5 median 2.0 average 1.7 maximum 2.0 minimum 1.0 number 3 SIC
32 1946-1950 1956-1960 1961-1965 1966-1970 1971-1975 1976-1980 1981-1985 1986-1990 year median average maximum minimum number pred. inter
10 15 20 25 30 35 40 45
6.5 10.5 15.0 21.0 15.0 8.0 13.0 19.5
6.5 10.5 14.3 17.4 17.6 12.0 13.7 19.5 7.0 ll.O 17.0 24.0 27.0 30.0 29.0 32.0
6.0 10.0 9.0 4.0 1.0 2.0 1.0 7.0
2 2 6 5 9 10 11 2
10 15 20 25 30 35 40 45
6.0 ll.O 15.0 18.0 18.0 10.0 8.0 9.0
6.0 11.0 15.0 16.0 16.5 17.0 12.4 9.0
6.0 11.0 17.0 24.0 27.0 30.0 29.0 11.0 6.0 11.0 13.0 4.0 9.0 6.0 2.0 7.0
1 1 3 4 4 5 7 2
5 15 20 25 30 35 40 45
2.0 11.0 15.5 11.5 15.0 12.5 16.0 19.0
1.8 11.7 15.5 11.8 15.1 16.0 15.7 19.0 2.0 14.0 17.0 21.0 27.0 30.0 24.0 19.0 1.0 10.0 13.0 3.0 9.0 9.0 6.0 19.0
5 3 5 4 8 4 6 1
5 15 20 25 30 35 40 45
2.0 11.0 14.5 18.0 15.0 9.0 11.0 19.0
1.9 11.0 14.8 15.5 15.0 11.3 14.4 26.0
3.0 11.0 16.0 24.0 27.0 30.0 34.0 40.0
1.0 11.0 13.0 3.0 9.0 3.0 1.0 19.0
8 2 5 7 8 6 10 3
10 15 20 25 30 35 40 45
6.0 11.0 15.0 18.5 15.0 8.5 20.0 11.0
6.0 10.3 15.2 17.8 14.3 13.3 18.2 19.3
6.0 11.0 17.0 24.0 27.0 30.0 34.0 40.0
6.0 9.0 13.0 4.0 1.0 1.0 1.0 7.0
1 3 6 6 12 14 16 3
SIC
33 1946-1950 1956-1960 1961-1965 1966-1970 1971-1975 1976-1980 1981-1985 1986-1990
year median average maximum minimum number SIC
34 1946-1950 1951-1955 1956-1960 1961-1965 1966-1970 1971-1975 1976-1980 1981-1985 1986-1990 year 5 median 1.0 average 1.6 maximum 4.0 minimum 1.0 number 11 SIC
35 1946-1950 1951-1955 1956-1960 1961-1965 1966-1970 1971-1975 1976-1980 1981-1985 1986-1990
year 5 10 15 20 25 30 35 40 45 median 1.0 6.0 11.0 15.0 18.5 15.0 8.5 8.5 7.0 average 1.6 6.0 12-0 15.4 17.8 14.9 13.0 12.9 7.0 maximum 4.0 6.0 14.0 17.0 24.0 27.0 30.0 34.0 7.0
minimum 1.0 6.0 1.0 13.0 4.0 5.0 2.0 1.0 7.0
number 11 1 3 7 6 13 10 18 1
SIC
36 1946-1950 1951-1955 1956-1960 1961-1965 1966-1970 1971-1975 1976-1980 1981-1985 1986-1990
year 5 median 2.0 average 1.8 maximum 4.0 minimum 1,0 number 9 SIC
37 1946-1950 1951-1955 1956-1960 1961-1965 1966-1970 1971-1975 1976-1980 1981-1985 1986-1990 year 5 median 1,0 average 1.5 maximum 4.0 minimum 1.0 number 14 SIC
38 1946-1950 1951-1955 1956-1960 1961-1965 1966-1970 1971-1975 1976-1980 1981-1985 1986-1990
year 5 median 2.0 average 1.9 maximum 4.0 minimum 1.0 number 10 pred. inter SIC 39 1946-1950 year 5 median 2.0 average 2,0 maximum 4,0 minimum 1,0 number 7
10 15 20 25 30 35 40 45
6,0 11.0 15.0 21.0 15.0 10.0 14.5 17.0 6.0 10.7 14.2 17.2 14.1 16.5 15.6 19.6 6.0 11.0 17.0 24.0 27.0 34.0 34.0 40.0
6.0 10,0 5.0 4.0 1.0 2.0 1.0 7.0
1 3 9 5 13 15 16 5
10 15 20 25 30 35 40 45
6.5 11,0 15.0 15.0 15.0 9.5 13.0 12.0 6.8 10.8 12.0 14.0 15.0 14.0 14.1 18.1 8.0 13.0 17.0 24.0 27.0 34.0 34.0 40.0
6,0 9.0 1.0 4.0 1.0 1.0 1.0 3.0
4 6 12 7 20 22 31 9
10 15 20 25 30 35 40 45
6.0 11.0 15.0 21.0 15.0 12.5 13.0 23.5 6.0 11.0 15.2 17.2 14.7 16.8 15.6 23.5
6.0 11,0 17.0 24.0 27.0 34.0 34.0 40.0
6.0 11.0 13.0 4.0 5.0 2.0 3.0 7.0
1 2 6 5 10 12 13 2
9.7 11.1 12.5 13.9 15.3 16.8 18.2 19.6
955 1956-1960 1961 -1965 1966-1970 1971-1975 1976 -1980 1981-1985 1986-1990
10 15 20 25 30 35 40 45
6.0 11.0 15.0 9.5 15.0 16.0 13.0 7.0 6.0 11.0 15.0 9.5 16.2 16.0 15.8 7.0 6.0 11.0 17.0 15.0 27.0 30.0 34.0 7.0
6.0 11.0 13.0 4.0 9.0 2.0 1.0 7.0
SIC
40&45 1946-1950 1951 -1955 1956 -1960 1961 -1965 1966 -1970 1971 -1975 1976 -1980 1981 -1985 1986-1990
year 5 10 15 20 25 30 35 40 45
median 1.5 6.0 11.0 15.0 19.0 15.0 16.0 15.0 9.0
average 1.7 6.0 10.8 15.6 15.4 13.1 16.5 17.6 16.4 maximum 4.0 6.0 11.0 17.0 24.0 27.0 30.0 37.0 40.0
minimum 1.0 6.0 10.0 13.0 3.0 2.0 2.0 1.0 7.0
number 12 1 5 6 7 8 10 18 5
SIC
49,72,73,76 1946-1950 1951 1955 1956 -1960 1961 -1965 1966 -1970 1971 -1975 1976 -1980 1981-1985 1986 -1990
year 5 10 15 20 25 30 35 40 45
median 2.0 6.0 11.0 15.0 17.0 15.0 6.0 10.5 19.0
average 1.7 6.0 10.7 15.6 14.3 14.3 7.0 13.8 19.0
maximum 2.0 6.0 11.0 17.0 24.0 27.0 9.0 29.0 19.0
minimum 1.0 6.0 10.0 15.0 3.0 5.0 6.0 1.0 19.0
number 7 1 3 5 6 10 3 10 1
SIC
80 1946-1950 1951 1955 1956 -1960 1961 -1965 1966 1970 1971ͣ1975 1976 -1980 1981 -1985 1986 -1990
year 5 10 15 20 25 30 35 40 45
median 2.0 6.0 11.5 14.7 19.0 15.0 5.0 7.0 13.0 average 1.8 6.0 11.3 13.6 15.4 18.3 13.1 11.6 13.0 maximum 4.0 6.0 13.0 17.0 24.0 27.0 30.0 29.0 19.0
minimum 1.0 6.0 10.0 2.0 3.0 9.0 2.0 1.0 7.0
Table VIII
Interval Between Reductions for All Carcinogens
(For 5-year intervals from 1951)
1951-1955 1956 1960 1961 -1965 1966 1970 1971-1975 1976 -1980 1981 -1985 1986 -1990 1951-1990
year 10 15 20 25 30 35 40 45
median 6.5 11.0 10.0 5.5 15.5 30.0 19.0 11.5 15.0 average 6.5 10.8 9.5 6.8 17.2 23.2 18.5 13.9 16.4
maximum 7.0 13.0 17.0 12.0 27.0 34.0 35.0 39.0 39.0 minimum 6.0 9.0 2.0 4.0 9.0 4.0 5.0 3.0 2.0 number 2.0 5.0 12.0 4.0 14.0 21.0 24.0 14.0 96
Median Interval between Reductions for Carcinogens
df
m 0.345238 4.130952
se 0.224219 6.679684
R2 0.283222 7.265514
F 2.370795 6
125.1488 316.7262
Tabic IX
Rate of Fold Reduction for all TLVs
median fold = 2 % change 200
year 10 15 20 25 30 35 40 45
pred. inter 9.2 10.0 10.8 11.6 12.5 13.3 14.1 15.0
% per yr 21.7 20.0 18.5 17.2 16.0 15.0 14.2 13.3
% reduction per year = % fold change/predicted interval example: 21.7 % per year= 200/9.2
Rate of Fold Reduction for Known or Suspected Carcinogens
median fold = 2.4
1951-1990 % change 240 total years 35
med. inter. 15.0
Table X
Rate of Hold Reductions Over Time By SIC Code (For series with a significant linear trend)
SIC 15
median fold
% change
= 3.8 380
year 10 15 20 35 40
interval 7.7 9.9 12 18.6 20.8
% per yr 49.4 38.4 31.7 20.4 18.3
SIC 17
median fold
% change
= 2 200
year 25 30 35 40
interval 22.5 15 9 7
% per yr 8.9 13.3 22.2 28.6
SIC 20, 21 median fold
% change
= 2 200
year 10 15 20 25 30 35 40 45
interval 6.8 9.4 11.9 14.4 17.0 19.5 22.0 24.5
% per yr 29.4 21.3 16.8 13.9 11.8 10.3 9.1 8.2
SIC 23
year 10 20 25 30 35 40 45
pred. fold 130 170 190 220 240 260 280 interval 15.0 15.0 15.0 15.0 15.0 15.0 15.0
% per yr 8.7 11.3 12.7 14.7 16.0 17.3 18.7
SIC 24
median fold
% change
= 2 200
year 10 20 25 30 35 40
interval 7.8 13.1 15.7 18.3 20.9 23.5 % per yr 25.6 15.3 12.7 10.9 9.6 8.5
SIC 32
median fold
% change
= 2 200
year 15 20 25 30 35 40 45
interval 11.6 12.5 13.4 14.4 15.3 16.2 17.1
% per yr 17.2 16.0 14.9 13.9 13.1 12.3 11.7
SIC 36
year 10 15 20 25 30 35 40 45
pred. fold 120 150 190 220 250 290 320 350 interval 10.6 11.5 12.4
13.3 14.1 15.0 15.9 16.8
% per yr 11.3 13.0 15.3 16.5 17.7 19.3 20.1 20.8
SIC 37
year 10 15 20 25 30 35 40 45
Pred. fold 160 180 200 230 250 280 300 330
interval 13 13 13 13 13 13 13 13
% per yr 12.3 13.8 15.4 17.7 19.2 21.5 23.1 25.4 SIC 38
median fold =
% change
= 2 200
year 10 15 20 25 30 35 40 45
interval 9.7 11.1 12.5 13.9 15.3 16.8
18.2 19.6
Table XI
Rate of Fold Reductions Over Time By SIC Code (For series without a significant linear trend)
SIC
year
1951-med. fold %fold med. inter
% per yr
SIC
year
1956-med. fold % fold med. inter
% per yr
22 25 26 27 28 29 30 31
1990 1951 -1990 1951-1985 1951 -1990 1951-1990 1961- 1985 1951-1990 1951-1990
2 2 2 2 2 2 2 2
200 200 200 200 200 200 200 200
15 15 11.5 13 15 15 15 15
13.3 13.3 17.4 15.4 13.3 13.3 13.3 13.3
33 34 35 39 40&45 49,72,73,76 80
1990 1951 1990 1951-1990 1951 -1990 1951 1990 1951-1990 1951-1990
2 2 2 2 2 2 2
200 200 200 200 200 200 200
15 15 13 15 15 15 13
Table XII
1992 Changes in TLVs
Chemical Fold Age (y) Carcinogen
Caprolatum 0.9 18
Carbon monoxide 2.0 25
o-Dichlorobenzene 0.3 29
1,1 Dichloroethane 2.0 19
Dimethylamine 2.0 26
Dinitrotolucne 10.0 46 y
Ethylbromide 40.5 45 y
Formaldehyde 20.0 7
y
Kaolin 5.0 21
Methylamine 2.0 25
Toluene 2.0 19
Trimethylamine 2.0 9
median fold non-care. 2.0
median fold care. 20.0
median fold 12 TLVs 2.0 average age care. 32.7
average age 12 TLVs 24.1
38
8
T
7 I
•I 5 i
^ I 2 4
•ͣ^ 3
Figure 1
Fold Reductions in All TLVs
(For 5-year intervals from 1946)
0 ^ 0
+
10 15 20 25
Time (y)
30 35 40
-•H
O
t 3
4 i
2 -T
1 -f
Figure 2
Fold Reductions in TLVs for SIC 15 (For 5 year intervals from 1946)
+
10 15 20 25
Time (y)
•J 5 +
i I
5 4 T
Figure 3
Fold Reductions in TLVs for SIC 17
(For 5 year intervals from 1946)
+
10 15 20 25
Time (y)
10 J
9 8 7
-en c
o 6 -ZD -o OJ (y "O 5 I I 1 3 2 -! I Figure 4
Fold reductions in TLVs for SICs 20 & 21
(For 5 year intervals from 1946)
1
-0---\----_---1---\---^---_---H
0 5 10 15 20 25 30 35 40 45
•2 5
Figure 5
Fold Reductions in TLVs for SIC 22
(For 5 year intervals from 1946)
1
0 _l----_----^
20 25
Time (y)
8 ^
7
ͣ
S 5
o
^ 4
••i 3 +
Figure 6
Fold Reductions in TLVs for SIC 23
(For 5 year intervals from 1946)
0 -0
+
-t-10 15 20 25
Time (y)
<u
o
Figure 7
Fold Reductions in TLVs for SIC 24
(For 5 year intervals from 1946)
1
0
10 15 20 25
Time (y)
8
T-t
en d
S 5
o
ID
^ 4
<v I
Figure 8
Fold Reductions in TLVs for SIC 25
(For 5 year intervals from 1946)
0 h
0 10 15 20 25
Time (y)
ͣ
B 5 -i
o
-a
a;
^ 4
-c
2 ^
Figure 9
Fold Reductions in TLVs for SIC 26
(For 5 year intervals from 1946)
10 15 20
Time (y)
8 J
7
6
-CO
i 5 -^
Z3
12 4 --o
ͣ
M 3
-1
--0
Figure 10
Fold Reductions in TLVs for SIC 27
(For 5 year intervals from 1946)
-t-0 5 1-t-0 15 2-t-0 25 3-t-0 35 4-t-0 45
O
S 5
- 3
2 ^
^T
Figure 11
Fold Reductions in TLVs for SIC 28 (For 5 year intervals from 1946)
+
10 15 20 25
Time (y)
8 -T
I
7 fͣ
S 5
^ 4
3
2
-1
^-Figure 12
Fold Reductions in TLVs for SIC 29
(For 5 year intervals from 1946)
10 15 20
Time (y)
25 30 35
- H
-S 5
o
- 4 t
•i 3
-2 T
Figure 13
Fold Reductions in TLVs for SIC 30 (For 5 year intervals from 1946)
^ t
0 I-0
+
10 15 20 25
Time (y)
8
ͣ
3 5
o
OJ
^ 4
- ^
i
1 f
Figure 14
Fold Reductions in TLVs for SIC 31
(For 5 year intervals from 1946)
0 ^
0
+ͣ
10 15 20 25
Time (y)
6 +
^ ! •S 5
-o
- 3 ͣ <i> !
2 1
i
1 +ͣ
Figure 15
Fold Reductions in TLVs for SIC 32
(For 5 year intervals from 1946)
0---\---.---1---\---——---u---.---^————+---\---•---\---1
0 5 10 15 20 25 30 35 40 45
7
-ͣ
S 5
-o 4
Figure 16
Fold Reductions in TLVs for SIC 33 (For 5 year intervals from 1946)
I
2 1
1 -L
I
0 —
0 10 15
—{---—---i--20 25
Time (y)
ͣ S 5
12 4 c
!
T
1 1
Figure 17
Fold Reductions in TLVs for SIC 34
(For 5 year intervals from 1946)
-\
10 15 20 25
Time (y)
8 J
7
Figure 18
Fold Reductions in TLVs for SIC 35
(For 5 year intervals from 1946)
00 CI
•2 5
o
^ 4
T
- ^
ͣ
-f-10 15 20 25
Time (y)
8 -r
M
Figure 19
Fold Reductions in TLVs for SIC 36
(For 5 year intervals from 1946)
ͣ
J 5
o
4 ^
3
4-2 f
+
10 15 20 25
Time (y)
8 T
a 5
o
<u
^ 4
^
-Figure 20
Fold Reductions in TLVs for SIC 37
(For 5 year intervals from 1946)
1
4-0 + +
0 10 15 20 25
Time (y)
8 T
O
- ^
Figure 21
Fold Reductions in TLVs for SIC 38
(For 5 year intervals from 1946)
10 15 20 25
Time (y)
2
o
3
-Figure 22
Fold Reductions in TLVs for SIC 39
(For 5 year intervals from 1946)
1
0 —I---K
20 25 Time (y)
7
6
-S 5
o
- ^
Figure 23
Fold Reductions in TLVs for SICs 40 & 45
(For 5 year intervals from 1946)
1
J-0 +
0 10 15 20 25
Time (y)
•
6
•2 5
o
-o
^ 4
Figure 24
Fold Reductions in TLVs for SICs 49, 72, 73, & 76
(For 5 year intervals from 1946)
1
0
10 15
—f---1— 20 25
Time (y)
30 35 40 45