SOCIAL AND ECONOMIC CHANGE AND RISING RATE OF CESAREAN SECTION DELIVIERIES IN ECUADOR
Johanna R. Jahnke
A thesis submitted to the faculty at the University of North Carolina at Chapel Hill in partial fulfillment of the requirements for the degree of Master of Arts in the Department of
Anthropology.
Chapel Hill 2016
Approved by:
Amanda L. Thompson Mark Sorensen
ABSTRACT
Johanna R. Jahnke: Social and Economic Change and Rising Rate of Cesarean Section Deliveries in Ecuador
(Under the direction of Amanda L. Thompson)
ACKNOWLEDGEMENTS
TABLE OF CONTENTS
LIST OF TABLES……… vii
LIST OF FIGURES………...…….. viii
INTRODUCTION……….. 1
INCREASED CESAREAN SECTION AND SOCIAL AND ECONOMIC CHANGE IN ECUADOR……… 3
Economic Development in Ecuador………...………… 3
Economic Development and the Health Care System………...…………. 4
Economic Incentives for Cesarean Delivery………..…… 6
Medicalization of Pregnancy and Birth………..…… 6
Medical Indication and Misrecognition……….. 8
Patient Request for Cesarean Section…………...……….. 9
DEVELOPMENTAL ORIGINS OF HEALTH AND DISEASE………..……….. 11
Developmental Origins of Health and Disease and Cesarean Section…...……….. 11
Preterm Birth and Birth Weight……… 12
Benefits of Labor for Development………..……… 13
Maternal Characteristics Shape Cesarean Section Risk and Development…………..… 15
DOHaD and the Microbiome……… 16
Breastfeeding and DOHaD………...……… 18
METHODS………..………. 19
Sample Characteristics and Complications………...…… 22
Institution of Prenatal Care………..………. 25
Number of Prenatal Care Visits……… 28
Institution of Birth………..……….. 30
Socio-Demographic Characteristics and Care Practices…………...……….………33
Motivations for Selecting Institution of Birth………..……….… 38
Subset Analysis: Primiparous Women……….…. 39
DISCUSSION……….……….. 42
Summary of Results……….. 42
The Role of Prenatal Care………..………..…. 42
Three Tiers of Care………..…………...….. 44
Socio-Demographic Characteristics Shape Care………....………..………… 44
Limitations and Future Directions……… 46
Conclusion………....……..….. 47
APPENDIX A: INSTITUTION OF PRENATAL CARE CATEGORIES ……….…… 50
APPENDIX B: INSTITUTION OF BIRTH CATEGORIES……….….. 51
APPENDIX C: EDUCATION CATEGORIES………..…….. 52
LIST OF TABLES
Table
1. Socio-Demographics and Mode of Delivery………..…… 23
2. Complications During Pregnancy and Birth, and Mode of Delivery…………....….. 24
3. Institution of Prenatal Care and Cesarean Delivery………..…….. 26
4. Socio-Demographics and Institution of Prenatal Care………...……. 26
5. Number of Prenatal Care Visits and Cesarean Delivery……….………… 29
6. Socio-Demographics and Number of Prenatal Care Visits….……… 29
7. Institution of Birth and Cesarean Delivery……….……… 31
8. Socio-Demographics and Institution of Birth…….………...…. 33
9. Complications During Pregnancy and Birth, and Mode of Delivery: Primiparous Women………40
10. Institution of Prenatal Care and Cesarean Delivery: Primiparous Women……….... 41
11. Number of Prenatal Care and Cesarean Delivery: Primiparous Women……… 41
LIST OF FIGURES
Figure 1 - Conceptual Diagram……….………..……….. 21
Figure 2 - Care Practices and Cesarean Section: Urban vs. Rural Women……….. 34
Figure 3 - Care Practices of Urban and Rural Women………...…….. 35
Figure 4 - Percent Cesarean Births: Urban vs. Rural ………...………… 35
Figure 5 - Care Practices and Cesarean Section: Castilian/Spanish vs. Indigenous Speakers………. 37
Figure 6 - Care Practices of Castilian/Spanish and Indigenous Speaking Women….…………. 37
Figure 7 - Percent Cesarean Births: Castilian/Spanish vs. Indigenous Speakers………. 38
INTRODUCTION
Birth by Cesarean section is increasing globally, particularly in countries experiencing rapid social and economic change (Villar et al. 2006). While cesarean sections can be imperative for the immediate health of mother and child, elective cesareans have been associated with increased morbidity and mortality for both mother and child (Villar et al. 2006). The maternal mortality rate for mothers who deliver by cesarean is four to ten times higher than that for mothers who deliver vaginally (Runmei et al. 2012). In addition, cesarean sections have been associated with increased fetal mortality rates (Villar et al. 2006), and they pose increased risk of low birthweight, reduced breastfeeding initiation and duration, metabolic syndrome, asthma, diabetes, gastrointestinal disease, respiratory infections, and overweight and obesity in offspring (Hyde and Modi 2012; Blustein et al. 2013; Merenstein et al. 2011). Obesity and overweight are of particular concern recently, as obesity worldwide has more than doubled since 1980 (World Health Organization 2015).
while 55% of births to women who had completed higher education and graduate school were by cesarean section (Freire et al. 2015). By socioeconomic status, 31.4% of births were by cesarean section in the poorest quintile, and 57% of births were by cesarean section in the wealthiest quintile. Despite these stark differences, rates of cesarean section are increasing at all levels of education and socioeconomic status (Freire et al. 2015). The rapid increase in cesarean delivery in Ecuador may be due in part to Ecuador’s dramatic recent social and economic change. In this context, Ecuador serves as a case study of socioeconomic changes that are affecting Latin American countries more broadly.
INCREASED CESAREAN SECTION AND SOCIAL AND ECONOMIC CHANGE IN ECUADOR
Economic Development in Ecuador
In recent decades, Ecuador has undergone dramatic economic development. Ecuador has been classified as a middle-income country, but within its own population, steep inequalities nonetheless persist. After an economic crisis in 1999, the percent of the Ecuadorian population living below the national poverty line dropped from 64.4% in 2000 to 22.5 in 2014, and the gross national income (GNI) per capita rose from $1,540 in 2000 to $6,090 in 2014 (World Bank).
This rapid economic change has likely shaped the rates of women who undergo cesarean delivery, the average profiles of women who receive cesarean sections, and the ways that
decisions are made about mode of delivery. In a study comparing cesarean section rates and maternal and neonatal mortality in low-, medium-, and high-income countries, Althabe et al. (2006) found that low-income countries generally had much lower rates of cesarean section than middle- and high-income countries, and the authors suggested that in countries with higher income, higher rates of cesarean delivery without an association to improved neonatal and maternal outcomes may demonstrate the use of unjustified cesarean deliveries in healthy
Economic Development and the Health Care System
With economic development, Ecuador has also undergone a re-structuring of its healthcare system to reduce care provided by private institutions and increase access to health care services through public and social security care. Despite this change, Ecuador’s medical system has been and remains fragmented into three separate segments: the Ministry of Health (MoH), which serves the public sector, primarily the lowest-income groups; the social security branch, including the Instituto Ecuatoriano de Seguridad Social (IESS), which serves workers and employees, and the Seguro Social Campesino (SSC), which serves rural poor families that are legally recognized members of peasant organizations; and the private sector, which serves the wealthiest individuals.
Fragmentation within Ecuador’s health system has roots in the 1980s, when Ecuadorian leaders pushed neoliberal reforms in attempts to reverse the failing economy, and public health funding was cut in order to rely on the free-market’s promise of low-cost, quality health care (Rasch and Bywater 2014). During this time, a biomedical care model that emphasized episodic, emergency-style care became entrenched in Ecuador’s health care system (Rasch and Bywater 2014). Private hospitals encouraged patient-centered care in response to pathology, and care in Ecuador increasingly ignored interventions at the population level that could promote health and prevent disease (Rasch and Bywater 2014). This model, while doing little for the health of the population, does reap vast economic reward for private hospitals, which can profit off of individuals who have not received preventative care (Navarro 2008).
National Health System, which made the national health system responsible for meeting this right, was enacted in 2003 (De Paepe et al. 2012). Despite this legislation, the health care system remained fractured, as the government enacted no social policy to coordinate the three existing sectors of healthcare.
After President Correa was elected into office in 2006, Ecuador installed a drastic overhaul of the MoH realm of the health system. First, a vastly increased budget allowed the MoH to invest in equipment, infrastructure and personnel. Second, as of April 2008, Ecuador’s new constitution guarantees access to free, high quality healthcare to all citizens (Rasch and Bywater 2014). Since then, despite the MoH’s increased budget, public institutions have had difficulty keeping up with the increased patient demand that has arisen through free healthcare reform. Meanwhile, the private sector, which includes for-profit institutions like hospitals and clinics as well as nonprofit organizations like non-governmental organizations (NGOs), has been expanding over the past few decades, and it has drawn medical staff from public institutions through higher pay (De Paepe et al. 2012).
focused on curing existing illness than preventing it. In either case, Ecuador’s fragmented health care system poses deep-rooted, structural barriers to equal and quality healthcare.
Economic Incentives for Cesarean Delivery
The privatization of hospitals has had consequences on care broadly, but also on rates of cesarean section throughout Latin America (Taljaard et al. 2009; Villar et al. 2006; Béhague 2002). Taljaard et al. (2009) found significant associations with higher risk-adjusted rates of cesarean delivery in private hospitals than public hospitals in Latin America. In a survey of maternal and perinatal health in Latin American countries, Villar et al. (2006) found that 58% of the private institutions in the sample reported economic incentives to cesarean section, while 24% of public institutions did, and only 5% of the social security hospitals did. In her work in Brazil, Béhague (2002) found that while hospitals may not be directly incentivized for
performing cesarean sections, indirectly, cesarean sections increase profits due to a decreased birthing time and the subsequent ability of the hospital to attend more births overall.
Medicalization of Pregnancy and Birth
than five, while only 63.5% of births occurred in a healthcare establishment (Freire et al. 2015). By 2012, 95.0% of women had at least one prenatal checkup, 79.5 had more than five, and 95% of births occurred in healthcare establishments (Freire et al. 2015). Over this period, the maternal mortality rate has dropped from 147 women per 100,000 live births in 1994, to 74 per 100,000 in 2012, and to 64 per 100,000 in 2015 (World Bank 2016). Infant mortality has also declined in the past two decades, dropping from 37 deaths per 1,000 live births in 1994 to 20 in 2012, and to 18 in 2015 (World Bank 2016).
The increased use of technology in care has also marked a drastic cultural shift that has made cesarean sections more acceptable, more normalized, and thus more common (Belizán et al. 1999). This shift toward a “culture of cesareans” (Béhague 2002) has been at least partially embraced by both patients and doctors, who increasingly view cesarean sections as modern and safe (Villar et al. 2006). Thus physicians’ decisions to perform cesarean sections may not be motivated purely by financial incentive, but could also be motivated by a fear of litigation in the case of poor maternal or neonatal outcomes of a vaginal delivery, which is increasingly viewed as unpredictable (Béhague 2002).
Medical Indication and Misrecognition
The decision to perform a cesarean section is the work of complex consideration of knowledge from many sources, including a patient’s personal preference, family and community influence, and medical opinion.
The primary indications for cesarean delivery are a previous cesarean delivery, breech presentation, dystocia, and fetal distress (Notzon et al. 1994). Non-medically indicated cesareans are often cited as a primary factor for the increase in cesarean deliveries globally (Penna and Arulkumaran 2003), but perceptions of medical safety and misrecognition about what medical indication truly is have complicated this issue. Increased medicalization of pregnancy and delivery over the past few decades further complicates the classification of medically indicated.
Some authors have used the concept of misrecognition to understand how women perceive birthing safety and medical indication in making decisions regarding mode of delivery. In interviews with English women, Tully and Ball (2013) found that many women who had unscheduled cesarean sections without medical indication expressed that they had, in fact, wanted to avoid a cesarean delivery, but that it had become necessary. Citing authoritative knowledge, women expressed that they underwent cesarean sections in response to their
physician’s suggestion that their labor was prolonged, non-progressing, or failed, despite the lack of indication of fetal distress (Tully and Ball 2013). In these cases, cesarean section was
In an era of increased medicalization and control over the body, birthing stands out as unpredictable. Béhague (2002) found that women in Brazil whose labors were “prolonged” or deviated from the norm self-identified their experience as problematic, and they desired to conform to biomedical expectations of standard birthing performance. Women whose labors were particularly long often suggested afterward that they should have had a cesarean delivery, and that they felt they had received poor care (Béhague 2002).
These two cases demonstrate how birthing, due largely to its unpredictability, is often misrecognized by doctors and patients as problematic. In these instances, despite no technical medical-indication, cesarean delivery is often performed to garner control over a birth.
While this misrecognition during labor may account for a piece of Ecuador’s rising cesarean rate, the WHO found that most of Ecuador’s cesarean deliveries are “elective” (Villar et al. 2006). In this paper, “elective” cesareans are planned prior to labor usually due to a
complication (Villar et al. 2006). In fact, in their survey of maternal and perinatal health in Latin American countries, Villar et al. (2006) found that less than one percent of cesarean sections are performed on maternal request with no medical indication. The most common indications for cesarean delivery are cephalopelvic disproportion, dystocia, and failure of labor to progress (Villar et al. 2006).
Patient Request for Cesarean Section
express skepticism and concern that such a large child could come out of the narrow vaginal canal without causing irreparable damage to the infant or the mother (Fenwick et al. 2010). In contrast, women expressed the predictable, safe, and controlled nature of a cesarean delivery (Béhague 2002; Fenwick et al. 2010; Tully and Ball 2013). Béhague (2002) has also suggested that in Brazil, giving birth by cesarean section increases a woman’s status through the
implication that she has the resources to afford private health care or that she is delivering a large and healthy infant.
Other studies have shown that cesarean section is not the preferred method of delivery in Brazil and elsewhere. Kasai et al. (2010) found that among a group of women in their third trimester, most expressed a preference for a vaginal delivery due to its perceived shorter recovery period. Similarly, Karlström et al. (2011) found that in a cohort of 1506 Swedish women in late pregnancy, only 7.0% reported a desire to have a cesarean section.
DEVELOPMENTAL ORIGINS OF HEALTH AND DISEASE
Developmental Origins of Health and Disease and Cesarean Section
From a biological perspective, delivery has been shown to be a critical phase in perinatal experience that shapes long-term development. Specifically, cesarean section has been associated with increased risk of low birthweight, reduced breastfeeding initiation and duration, metabolic syndrome, asthma, diabetes, gastrointestinal disease, respiratory infections, and overweight and obesity in offspring later in life (Hyde and Modi 2012; Blustein, et al. 2013; Merenstein et al. 2011; Cho et al. 2013).
The developmental origins of health and disease (DOHaD) hypothesis presents a
compelling framework to consider the long-term influences of mode of delivery on child health. This hypothesis is based on epidemiological and experimental literature documenting that fetal and neonatal environment can shape the occurrence of disease risk throughout the life course (Barker 2004). The DOHaD phenomenon can be considered a subset of developmental plasticity, the process by which an individual adapts to its environment throughout the life course
(Gluckman et al. 2007). It is thought that through integrated epigenetic changes, individuals take cues from the environment and adjust development, and thus adult phenotype, to be better suited for the predicted future environment (Gluckman et al. 2007). Several pathways have been
vaginal delivery, posing consequences for development. Cesarean section may also alter the foundational gut microbiome in infants, causing a lasting dysbiosis between infant and gut bacteria that may alter development (Goulet 2015). After birth, cesarean delivery shapes
breastfeeding practices that affect infant early nutrition, another crucial pathway to healthy early development.
Preterm Birth and Birth Weight
Preterm labor poses a challenge for practitioners, since preterm birth has been associated with increased risk for fetal and neonatal morbidity and mortality (Goldenberg et al. 2008). Though the optimal mode of delivery for women in preterm labor is still contested (Alfirevic et al. 2013), many practitioners opt for cesarean section, which has been associated with improved neonatal outcomes in some studies (Werner et al. 2012; Lee and Gould 2006; Högberg and Holgren 2007). This practice is based on the assumption that preterm birth can be accurately diagnosed and intervened upon with cesarean section very early in labor or even prior to labor, which is not usually the case (Alfirevic et al. 2013). In fact, often mothers thought to be in preterm labor do not give birth until many weeks later (Alfirevic et al. 2013). As a result, intervening with cesarean section on signs of preterm labor may actually increase rates of preterm birth and low birth weight.
Planned cesarean deliveries also increase risk for preterm and low birth weight, since often a cesarean is scheduled for a date a few weeks before an infant’s due date. Typically
Thus, increased rates of cesarean delivery, both planned and in response to signs of preterm labor, increase rates for preterm and low birth weight, each of which poses a separate suite of developmental risks. Preterm birth has been associated with insulin resistance (Hofman et al. 2004), and low birth weight has been associated with metabolic and cardiovascular diseases, obesity, and non-insulin dependent diabetes (Godfrey 1998).
It remains unclear whether the associations between disease risk and preterm birth are caused by early exposure to postnatal environment itself, by a stressful intrauterine environment that initiates a preterm birth, or by a combination of these two (Gluckman et al. 2005).
Nonetheless, both prematurity and impaired fetal growth may be symptoms of an unfavorable intrauterine environment and cannot then be understood as entirely distinct form one another (Gluckman et al. 2005).
Benefits of Labor for Development
The experience of birth through labor may be critical to a neonate’s development, and several authors have proposed that cesarean delivery interferes with the physiologically and immunologically beneficial experience of labor (Thilaganathan et al. 1994; Cho et al. 2013).
Authors have consistently found an association between cesarean section and the
(Gerten et al. 2005), the leading cause of admission to neonatal intensive care units (Zupancic and Richardson 1998) and the second leading cause of neonatal mortality in the US (Gerten et al. 2005). When survived, RDS poses developmental consequences throughout life, and it has been associated with asthma diagnosis in children (Smith et al. 2004). These results imply a protective effect of labor itself for the development of lung function.
Immunologically, altered levels of stress hormones at birth may alter immune response in infants born vaginally or by cesarean. During a vaginal birth, both contractions of the uterus and fetal hypoxia stimulate a measurable stress response in neonates, showing increased
catecholamine and cortisol concentrations after birth (Lagercrantz 1996). Elevated circulating cortisol in neonates is an indicator of hypothalamic-pituitary-adrenal (HPA) axis activation (Gitau et al. 2001) and is associated with increased maturation of organs (Siggers et al. 2008). In response to physical or psychological stressors, HPA axis activation increases levels of
corticosteroids, which serve as both the central component of physiological response to stress and as suppressors of immune response (McDade 2005). Thus, the HPA axis and corticosteroids are both key mediators of stress and immune function (McDade 2005). Infants delivered by cesarean do not experience this stress response at birth (Lagercrantz and Slotkin 1986), and therefore they develop poorer HPA axis activation and a less mature immune system (Cho et al. 2013). Some authors have proposed that another mechanism that may contribute to a
Maternal Characteristics Shape Cesarean Section Risk and Development
Maternal characteristics that increase a woman’s risk of cesarean section may also increase risk of disease development in offspring, serving as confounders for the relationship between cesarean section and development of disease.
Maternal pre-pregnancy overweight and obesity has shown moderate associations with unplanned cesarean section rates (Vahratian et al. 2005). In their meta-analysis of maternal obesity and risk of cesarean delivery, Chu et al. (2007) estimated that obese and severely obese women are two and three times more likely, respectively, to give birth by cesarean section than normal weight women. The mechanism for this association is not well understood (Dietz et al. 2005). Many authors have suggested that obesity affects risk of cesarean section by increasing risk of other pregnancy complications, especially the risk of gestational diabetes (Yang et al. 2002; Greene and Solomon 2005), though Chu et al.’s (2007) meta-analysis as well as other authors (Kaiser and Kirby 2001; Ray et al. 2001; Linne 2004) have found that obesity is an independent risk factor for cesarean delivery. Others have suggested that obesity may narrow a mother’s pelvic soft tissue, narrowing the birth canal, and increasing risks associated with dystocia (Crane et al. 1997; Schmid et al. 2004; Kaiser and Kirby 2001) or cephalopelvic disproportion (Witter et al. 1995). Still others propose that obese women may have more difficulty with labor progression or oxytocin administration, leading to cesarean section (Vahratian et al. 2004).
Maternal obesity is also associated with many of the developmental conditions associated with cesarean section, such as asthma in childhood (Forno et al. 2014), obesity, metabolic
obesity serves as a confounder in the relationship between cesarean delivery and disease development in offspring.
DOHaD and the Microbiome
The development of the infant gut microbiome is a key pathway that links early environment to future risk of disease (Edwards and Parrett 2002), and it is shaped by prenatal events, mode of delivery, infant feeding, postnatal environment, and antibiotic use (Goulet 2015). Most microbial species develop a symbiotic relationship with their host, promoting healthy development that educates the immune system, supports the development of gut function, regulates intestinal barrier function, protects against infection, and promotes food tolerance (Goulet 2015). However, unfavorable changes in the composition of gut microbiota, termed dysbiosis, may contribute to disease risk for obesity, metabolic disease, autoimmune disease and allergy, and intestinal inflammation (Cho et al. 2013; Goulet 2015). Dysbiosis early in life can be considered to be a part of the larger phenomenon of DOHaD.
A few mechanisms have been proposed to link cesarean section to increased adiposity, BMI, and metabolic disease in offspring later in life, including the proposal that mode of
delivery differentially shapes the foundational gut microbiome in infants, which may alter energy harvesting and contribute to increased risk of obesity and overweight (Ajslev, et al. 2011). Mode of delivery introduces critical microbiota that rapidly colonize the infant intestine through ingestion (Guarner and Malagelada 2003). Since mammals are born with otherwise sterile intestines, this interaction is crucial to laying down initial microbiota.
(Dominguez-Bello, et al. 2010). As a result, infants born vaginally exhibit a bacterial
composition similar to that of their mothers’ vaginal and intestinal microbiota (Goulet 2015). Cesarean delivery disrupts the natural acquisition of these gut microbiota and introduces novel microbiota from other sources. During a C-section (with no rupture of the membrane) the infant is not exposed to vaginal microbes at birth (Kabeerdoss, et al. 2013). Instead, the infant is exposed to epithelial bacteria that colonize the infant gut microbiome (Dominguez-Bello, et al. 2010). Studies have also shown increased levels of Clostridium difficile, a species of gut
microflora that has been associated with the development of asthma, in infants born by cesarean (van Nimwegen, et al. 2011). Notably, the microbiota of infants born by cesarean section does not exhibit bifidobacteria, a bacteria that has been associated with reduced risk for allergic disease (Björkstén, et al. 2001) and excessive weight gain (Kalliomäki, et al. 2008; Dogra, et al. 2015), and the infant’s microbiome may not be colonized by bifidobacteria for up to six months after birth (Biasucci et al. 2008).
It is important to note that antibiotic treatment may confound some of these results. A mother delivering by cesarean and her infant are more likely to be treated with antibiotics around the time of birth than a mother delivering vaginally. Antibiotic treatment can disturb intestinal microflora with effects lasting years (Jernberg et al. 2007; Jakobsson et al. 2010), and thus antibiotics may be the root cause of some associations found between cesarean section and changes in the microbiome, not the cesarean section itself. Nonetheless, as antibiotic treatment and cesarean section are tightly linked, antibiotic treatment may be considered another
Breastfeeding and DOHaD
Breastfeeding is another key determinant of DOHaD, and studies have shown that mode of delivery differentially shapes both breastfeeding practices and breast milk composition itself. Many studies have shown that breastfeeding is protective against obesity (Dewey 2003; Dietz 2001). Differences in breastfeeding practices have been shown to be strongly associated with mode of delivery, showing delayed breastfeeding (Prior et al. 2012) and worse breastfeeding outcomes for mothers who delivered by cesarean (Hyde and Modi 2012). Mothers report a variety of obstacles to breastfeeding after a cesarean, including difficulty with mobility, incision pain, positioning difficulties, and the need for rest and recovery from surgery (Tully and Ball 2014).
While differential breastfeeding practices are critical to differences in infant gut microbiota, breast milk composition itself may be responsible for some differences in gut microbiota between infants born via cesarean section and infants born vaginally. One study showed that breast milk from mothers who delivered by cesarean section exhibits higher microbial diversity but reduced frequency of beneficial bifidobacteria (Khodayar-Pardo, et al. 2014). Differences in both breastfeeding practices and breast milk composition between mothers who deliver vaginally and mothers who deliver by cesarean may alter infant growth and
METHODS
Quantitative data from Ecuador’s nationally-representative demographic health survey, Encuesta Nacional de Salud y Nutrición (ENSANUT), were analyzed to examine how
sociodemographic factors and care shape cesarean section prevalence. The surveys contain demographic information and data on maternal and child health, breastfeeding, infant health, risk factors for adults and children, and nutrition. The following datasets were used for the analysis: Información General, Mujeres en edad fértil (MEF), and Salud en la Niñez. Specifically, socio-demographic data are from the Información General dataset. Data on place of birth and
complications during pregnancy and birth are from Sección III: Servicios asociados a la salud marterna of the MEF dataset. Data on prenatal care are from Sección II: Control Prenatal of the Salud en la Niñez dataset. Data on mode of delivery is from Sección III: Atención del Parto of the Salud en la Niñez dataset, and birth weight and preterm birth data are from Sección IV: Atención al recien nacido of the Salud en la Niñez dataset.
This analysis is limited to women ages 12 to 49 who reported having a live birth in the period between July 2007 and June 2012 (n=6,929). A subset of analyses further limited the sample to women who have only ever had one live birth (n=2,252), in order to analyze
primiparous women whose mode of delivery would not be affected by that of a previous birth, since performing a vaginal delivery after cesarean section (VBAC) is rare in Ecuador.
establishment visited for the last prenatal care visit, the number of prenatal care visits, and the establishment where the birth occurred. Logistic regressions were used to estimate odds ratios (ORs) with 95% confidence intervals (CIs) for the relationships between the care variables and mode of delivery. In addition, I calculated chi-squared tests to measure the association between socio-demographic variables and care experience. Separate analyses were run for the full sample (all women between the ages 12 to 49 who reported having a life birth in the period between July 2007 and June 2012) and for the subset of primiparous women.
Responses regarding institution of care, both prenatal and during birth, were divided into three categories: public, social security, and private (see Appendix A and Appendix B for detailed categorization). Those who did not receive care at any of these institutions, including those who sought care at home, with a midwife, or elsewhere, were excluded (n= 52 excluded from prenatal care analysis; n=885 excluded from birth care analysis). These excluded groups accounted for less than one percent of the total population in the analysis for prenatal care and less than 13% of the population for care during birth. The number of prenatal care visits was divided into five categories: 1-3, 4-6, 6-9, and more than 10. The WHO recommends at least four prenatal visits, and the MSP of Ecuador recommends at least five (Freire et al. 2015). In our analyses, these recommendations are both met within the same category (4-6 visits).
The socio-demographic characteristics that were considered in this analysis include area (urban vs. rural), maternal age, primary language, self-identified ethnicity, literacy, level of education, marital status, weekly work, and income. For primary language, responses
For details on education categorization, see Appendix C. Monthly gross income was recorded in US dollars, and was divided into quartiles in this analysis. Categories for monthly gross income include: ≤$50, >$50 and ≤$160, >$160 and ≤$300, and >$300.
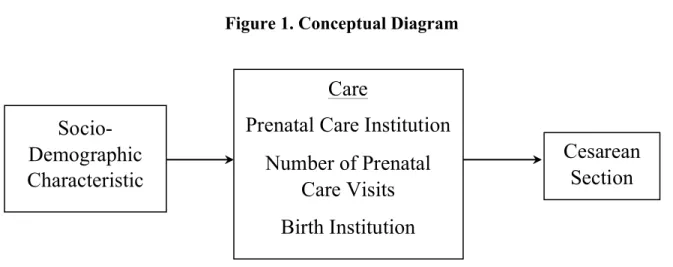
This analysis was constructed to reflect our hypothesis about the pathways to cesarean section. Figure 1 represents this model. After the initial analysis, two socio-demographic characteristics, area (urban vs. rural) and primary language, were analyzed in greater depth to elucidate a better picture of cesarean section rates and access to care.
Figure 1. Conceptual Diagram
Socio-Demographic
Characteristic
Care
Prenatal Care Institution
Number of Prenatal
Care Visits
Birth Institution
RESULTS
Sample Characteristics and Complications
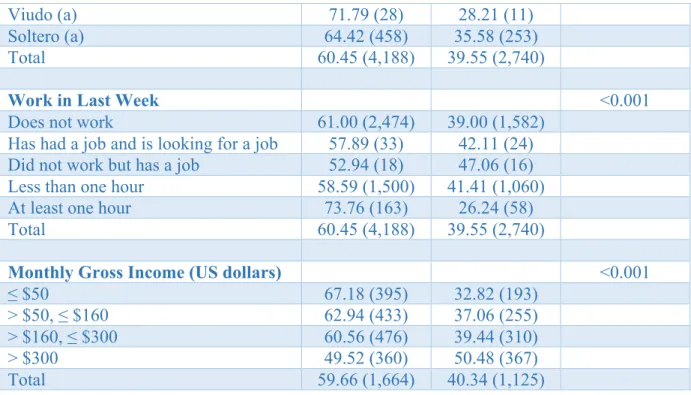
The full sample of women between the ages 12 to 49 who reported having a live birth in the period between July 2007 and June 2012 included 6,929 women. Table 1 summarizes socio-demographic characteristics with cesarean delivery, showing that region, age, primary language, self-identified ethnicity, level of education, marital status, hours worked, and gross income were all significantly associated with cesarean delivery. Notably, literacy was not significantly
associated with cesarean delivery.
Table 2 summarizes complications during pregnancy and birth with cesarean delivery, which may provide context for which medical complications may determine a medically indicated cesarean section. The following complications during pregnancy were each
significantly associated with cesarean delivery: swelling of hands and feet; dizziness, nausea, and vomiting; fever; preeclampsia and eclampsia; urinary tract infection (UTI); and bleeding or hemorrhage. During birth, the following complications were associated with increased risk of cesarean delivery: lack of pain or contractions; the birth was early; the baby was badly
Socio-Demographic Characteristic Vaginal Birth
% (N)
C-Section % (N)
P-Value
Area <0.001
Urban 55.49 (2,419) 44.51 (1,940)
Rural 68.87 (1,770) 31.13 (800)
Total 60.46 (4,189) 39.54 (2,740)
Age (Mean ± deviation) 27.60 ± 6.81 29.09 ± 7.08 <0.001
Primary Language <0.001
Indigenous 81.47 (255) 18.53 (58)
Castilian/ Spanish 59.47 (3,926) 40.53 (2,676)
Total 60.46 (4,181) 39.54 (2,734)
Self-Identified Ethnicity <0.001
Indigenous 82.50 (575) 17.50 (122)
Afroecuatoriano 65.04 (80) 34.96 (43)
Negro(a) 71.05 (54) 28.95 (22)
Mulato (a) 63.30 (69) 36.70 (40)
Montubio (a) 41.95 (86) 58.05 (119)
Mestizo (a) 58.29 (3,261) 41.71 (2,333)
Blanco (a) 47.66 (51) 52.34 (56)
Otro (a) 70.59 (12) 29.41 (5)
Total 60.45 (4,188) 39.55 (2,740)
Literacy 0.240
Can read and write 60.36 (4,113) 39.64 (2,701)
Cannot read and write 65.79 (75) 34.21 (39)
Total 60.45 (4,188) 39.55 (2,740)
Level of Education <0.001
None 72.15 (57) 27.85 (22)
Primary School 68.24 (1,330) 31.76 (619)
Secondary School 59.75 (1,590) 40.25 (1,071)
Superior/Postgrado 51.50 (926) 48.50 (872)
Total 60.17 (3,903) 39.83 (2,584)
Marital status <0.001
Casado (a) 58.22 (1,608) 41.78 (1,154)
Unido (a) 63.11 (1,726) 36.89 (1,009)
Separado (a) 54.47 (335) 45.53 (280)
Divorciado (a) 50.00 (33) 50.00 (33)
Viudo (a) 71.79 (28) 28.21 (11)
Soltero (a) 64.42 (458) 35.58 (253)
Total 60.45 (4,188) 39.55 (2,740)
Work in Last Week <0.001
Does not work 61.00 (2,474) 39.00 (1,582)
Has had a job and is looking for a job 57.89 (33) 42.11 (24) Did not work but has a job 52.94 (18) 47.06 (16)
Less than one hour 58.59 (1,500) 41.41 (1,060)
At least one hour 73.76 (163) 26.24 (58)
Total 60.45 (4,188) 39.55 (2,740)
Monthly Gross Income (US dollars) <0.001
≤ $50 67.18 (395) 32.82 (193)
> $50, ≤ $160 62.94 (433) 37.06 (255)
> $160, ≤ $300 60.56 (476) 39.44 (310)
> $300 49.52 (360) 50.48 (367)
Total 59.66 (1,664) 40.34 (1,125)
Complication Vaginal Birth
% (N)
C-Section % (N)
P-value
Complications During Pregnancy
Swelling of hands and feet 56.09 (1,911) 43.91 (1,496) <0.001
Fainting 58.54 (514) 41.46 (364) 0.210
Severe or permanent headache 59.22 (1,487) 40.78 (1,024) 0.109
Convulsions 63.55 (197) 36.45 (113) 0.265
Severe belly aches 61.93 (1,472) 38.07 (905) 0.077
Dizziness, nausea, vomiting 59.34 (2,698) 40.66 (1,849) 0.007
Fever 57.01 (610) 42.99 (460) 0.011
Preeclampsia or Eclampsia 49.06 (494) 50.94 (513) <0.001
UTI 57.72 (2,427) 42.28 (1,778) <0.001
Bleeding or Hemorrhage 54.24 (544) 45.76 (459) <0.001
Complications During Birth
Did not have pains or contractions 53.29 (908) 46.71 (796) <0.001 Delivery took longer than normal 62.06 (849) 37.94 (519) 0.300
The birth was early 40.75 (454) 59.25 (660) <0.001
shoulder, buttocks, feet)
Narrow hips 34.95 (404) 65.05 (752) <0.001
Heavy bleeding 70.83 (806) 29.17 (332) <0.001
Generalized infection/Sepsis 53.32 (249) 46.68 (218) 0.001
Twins or multiple births 27.27 (15) 72.73 (40) <0.001
The baby was not moving 52.49 (306) 47.51 (277) <0.001
Cord wrapped around the baby’s neck
44.79 (288) 55.21 (355) <0.001
Low birth weight 55.1 (162) 44.9 (132) 0.039
Preterm 36.57 (313) 63.43 (543) <0.001
Institution of Prenatal Care
Logistic regression was used to analyze the relationship between the institution of prenatal care and cesarean delivery. Table 3 shows that women who last attended prenatal care appointments at social security institutions or private institutions were at significantly increased risk of having a cesarean delivery than those who attended prenatal care at public institutions, with private institutions posing the highest risk.
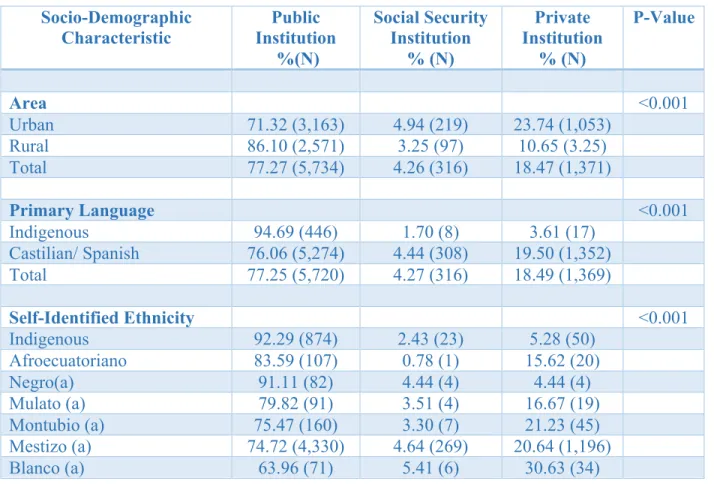
Table 4 elaborates on this relationship, demonstrating the association between the socio-demographic factors that influence where a woman receives prenatal care. Results show that a woman’s region, primary language, self-identified ethnicity, literacy status, level of education, marital status, weekly work, and gross monthly income are each significantly associated with the type of institution where she received prenatal care. Notably, a much smaller proportion of rural women attend prenatal care in private institutions than the proportion of urban women, and the reverse holds for attending care at a public institutions. Similarly, the proportion of indigenous speakers that receives care in private institutions is much smaller than the proportion of Castilian and Spanish speakers. By ethnicity, indigenous and black women account for the largest
level of education increases. This holds true, but to a lesser degree, for social security care. Socioeconomic status, measured by gross monthly income, is also associated with where women receive prenatal care. Though the proportion of women in the lowest quartile who receive care at a private institution is slightly higher than in the proportion in the second quartile, generally, as income increases, the proportion of women who receive care in private institutions also
increases.
OR p-value 95% CI
Social Security 2.29 ≤ 0.001 1.81 – 2.90
Private 2.68 ≤ 0.001 2.37 – 3.03
Note: The reference group is public institutions.
Socio-Demographic
Characteristic Institution Public
%(N)
Social Security Institution
% (N)
Private Institution
% (N)
P-Value
Area <0.001
Urban 71.32 (3,163) 4.94 (219) 23.74 (1,053)
Rural 86.10 (2,571) 3.25 (97) 10.65 (3.25)
Total 77.27 (5,734) 4.26 (316) 18.47 (1,371)
Primary Language <0.001
Indigenous 94.69 (446) 1.70 (8) 3.61 (17)
Castilian/ Spanish 76.06 (5,274) 4.44 (308) 19.50 (1,352)
Total 77.25 (5,720) 4.27 (316) 18.49 (1,369)
Self-Identified Ethnicity <0.001
Indigenous 92.29 (874) 2.43 (23) 5.28 (50)
Afroecuatoriano 83.59 (107) 0.78 (1) 15.62 (20)
Negro(a) 91.11 (82) 4.44 (4) 4.44 (4)
Mulato (a) 79.82 (91) 3.51 (4) 16.67 (19)
Montubio (a) 75.47 (160) 3.30 (7) 21.23 (45)
Mestizo (a) 74.72 (4,330) 4.64 (269) 20.64 (1,196)
Table 3. Institution of Prenatal Care and Cesarean Delivery
N = 6762, p-value ≤ 0.001
Otro (a) 77.27 (17) 9.09 (2) 13.64 (3)
Total 77.26 (5,732) 4.26 (316) 18.48 (1,371)
Literacy 0.001
Can read and write 77.03 (5,613) 4.32 (315) 18.65 (1,359) Cannot read and write 90.15 (119) 0.76 (1) 9.09 (12) Total
Level of Education <0.001
None 87.23 (82) 1.06 (1) 11.70 (11)
Primary School 89.06 (1,979) 2.61 (58) 8.33 (185)
Secondary School 76.52 (2,131) 3.59 (100) 19.89 (554) Superior/Postgrado 60.73 (1,115) 8.17 (150) 31.10 (571)
Total 76.50 (5,307) 4.45 (309) 19.04 (1,321)
Marital status <0.001
Casado (a) 72.41 (2,192) 6.05 (183) 21.54 (652)
Unido (a) 82.35 (2,384) 2.49 (72) 15.16 (439)
Separado (a) 77.76 (500) 4.67 (30) 17.57 (113)
Divorciado (a) 66.67 (44) 4.55 (3) 28.79 (19)
Viudo (a) 91.30 (42) 0.00 (0) 8.70 (4)
Soltero (a) 76.82 (570) 3.77 (28) 19.41 (144)
Total 77.26 (5,732) 4.26 (316) 18.48 (1,371)
Work in Last Week <0.001
Does not work 80.48 (3,464) 2.46 (106) 17.05 (734)
Has had a job and is looking for a job
70.00 (42) 10.00 (6) 20.00 (12)
Did not work but has a job 64.86 (24) 13.51 (5) 21.62 (8) Less than one hour 72.23 (1,992) 7.07 (195) 20.70 (571)
At least one hour 80.77 (210) 1.54 (4) 17.69 (46)
Total 77.26 (5,732) 4.26 (316) 18.48 (1,371)
Monthly Gross Income (US dollars)
<0.001
≤ $50 82.48 (593) 2.50 (18) 15.02 (108)
> $50, ≤ $160 86.76 (1.74) 1.74 (13) 11.50 (86) > $160, ≤ $300 72.67 (601) 7.01 (58) 20.31 (168)
> $300 50.07 (367) 15.55 (114) 34.38 (252)
Number of Prenatal Care Visits
Table 5 shows the odds ratios for the number of prenatal care visits a woman attends and cesarean delivery. Results show that the number of prenatal care visits was significantly
associated with mode of delivery, and that the more prenatal visits a woman attended, the higher her risk of delivering by cesarean section. The odds ratios presented in Table 5 compare the odds of cesarean section to a group of women who attended 1 – 3 prenatal care visits.
Table 6 elaborates on the socio-demographic characteristics that influence the number of prenatal visits that a woman attends. Results show that a woman’s region, primary language, self-identified ethnicity, literacy status, level of education, marital status, weekly work, and gross monthly income are each significantly associated with the number of prenatal visits a woman attends. Notably, the greatest proportions of both urban and rural women attend 7-9 prenatal care visits. The greatest proportion of indigenous speakers attend 4-6 visits, while the greatest
OR p-value 95% CI 4 – 6 visits 1.54 ≤ 0.001 1.25 – 1.89 7 – 9 visits 1.97 ≤ 0.001 1.62 – 2.41 ≥10 visits 3.09 ≤ 0.001 2.44 – 3.91 Note: The reference group is public institutions.
Socio-Demographic Characteristic 1-3 Visits %(N) 4-6 Visits % (N) 7-9 Visits
% (N) ≥10 Visits % (N)
P-Value
Area <0.001
Urban 7.59 (339) 27.30 (1,220) 51.91 (2,320) 13.20 (590) Rural 13.97 (419) 33.17 (995) 46.10 (1,383) 6.77 (203) Total 10.15 (758) 29.66 (2,215) 49.58 (3,703) 10.62 (793)
Primary Language <0.001
Indigenous 28.78 (137) 40.13 (191) 28.78 (137) 2.31 (11) Castilian/ Spanish 8.86 (618) 28.95 (2,020) 51.05 (3.562) 11.14 (777) Total 10.13 (755) 29.67 (2,211) 49.63 (3,699) 10.57 (788)
Self-Identified Ethnicity <0.001
Indigenous 24.53 (234) 35.43 (338) 35.43 (338) 4.61 (44) Afroecuatoriano 6.15 (8) 26.15 (34) 52.31 (68) 15.38 (20)
Negro(a) 8.89 (8) 20.00 (18) 57.78 (52) 13.33 (12)
Mulato (a) 13.04 (15) 26.09 (30) 49.57 (57) 11.30 (13) Montubio (a) 6.13 (13) 25.47 (54) 58.02 (123) 10.38 (22) Mestizo (a) 7.94 (463) 29.15 (1,700) 51.37 (2,996) 11.56 (673)
Blanco (a) 9.82 (11) 33.04 (37) 50.00 (56) 7.14 (8)
Otro (a) 22.73 (5) 18.18 (4) 54.55 (12) 4.55 (1)
Total 10.14 (757) 29.66 (2,215) 49.58 (3,702) 10.62 (793)
Literacy <0.001
Can read and write 9.96 (730) 29.54 (2,166) 49.75 (3,648) 10.75 (788) Cannot read and write 20.00 (27) 36.30 (49) 40.00 (54) 3.70 (5) Total 10.14 (757) 29.66 (2,215) 49.58 (3,702) 10.62 (793)
Level of Education <0.001
None 19.79 (19) 37.50 (36) 39.58 (38) 3.12 (3)
Primary School 14.34 (320) 33.96 (758) 45.97 (1,026) 5.73 (128) Secondary School 9.20 (258) 28.46 (798) 50.46 (1,415) 11.88 (333)
Table 5. Number of Prenatal Care Visits and Cesarean Delivery
N = 6780, p-value ≤ 0.001
Superior/Postgrado 5.31 (98) 24.80 (458) 53.22 (983) 16.68 (308) Total 9.96 (695) 29.37 (2,050) 49.61 (3,462) 11.06 (772)
Marital status <0.001
Casado (a) 8.78 (267) 26.97 (820) 51.28 (1,559) 12.96 (394) Unido (a) 10.38 (303) 30.16 (880) 50.62 (1,477) 8.84 (258) Separado (a) 11.42 (74) 30.56 (198) 49.54 (321) 8.49 (55) Divorciado (a) 7.35 (5) 35.29 (24) 45.59 (31) 11.76 (8)
Viudo (a) 10.87 (5) 30.43 (14) 45.65 (21) 13.04 (6)
Soltero (a) 13.79 (103) 37.35 (279) 39.22 (293) 9.64 (72) Total 10.14 (757) 29.66 (2,215) 49.58 (3,702) 10.62 (793)
Work in Last Week <0.001
Does not work 9.62 (416) 29.62 (1,281) 51.47 (2,226) 9.29 (402) Has had a job and is
looking for a job
6.67 (4) 38.33 (23) 40.00 (24) 15.00 (9)
Did not work but has a
job 5.41 (2) 29.73 (11) 40.54 (15) 24.32 (9)
Less than one hour 10.35 (288) 29.57 (823) 47.50 (1,322) 12.58 (350) At least one hour 17.94 (47) 29.39 (77) 43.89 (115) 8.78 (23) Total 10.14 (757) 29.66 (2,215) 49.58 (3,702) 10.62 (793)
Monthly Gross Income
(US dollars) <0.001
≤ $50 16.35 (119) 32.83 (239) 42.58 (310) 8.24 (60) > $50, ≤ $160 12.73 (96) 32.10 (242) 45.76 (345) 9.42 (71) > $160, ≤ $300 9.34 (78) 28.98 (242) 50.06 (418) 11.62 (97) > $300 5.56 (41) 24.42 (180) 49.66 (366) 20.35 (150) Total 10.94 (334) 29.57 (903) 47.12 (1,439) 12.38 (378)
Institution of Birth
Table 7 shows that women who gave birth in social security institution or a private institution were at significantly higher risk of delivering by cesarean than women who delivered in a public establishment, with birth in a private institution posing the highest risk.
birth. Table 8 shows that a higher proportion of urban women give birth in private institutions than the proportion of rural women, and in reverse, a higher proportion of rural women give birth in public institutions than the proportion of urban women. The proportion of indigenous speakers that give birth in a private institution is much smaller than the proportion of Castilian or Spanish speakers that do, and a higher proportion of indigenous speakers give birth in public institutions than Castilian or Spanish speakers. By ethnicity, the proportion of women who give birth in public institutions is highest for indigenous and black women. The proportion of women who give birth in private institutions is highest for white and Mestiza women. As level of education increases, the proportion of women who give birth in public institutions decreases, and the proportion of women who give birth in private institutions increases. In terms of socioeconomic status, generally as gross monthly income increases, the proportion of women who give birth in public institutions decreases, and the proportion of women who give birth in private institutions decreases. Notably, like for the institution where women receive prenatal care, this trend does not hold true for the first quartile, in which the proportion of women who receive care in a private institution is higher than that of the second quartile. Nonetheless, for the most part, women who both receive prenatal care and give birth in the same type of institution. In fact, only 52% of women who give birth in a private institution attended their last prenatal care visit in a private institution, and 45% of those who gave birth in a private institution received prenatal care at a public institution.
Note: The reference group is public institutions.
OR p-value 95% CI
Social Security 3.24 ≤ 0.001 2.60 – 4.05
Private 4.26 ≤ 0.001 3.79 – 4.80
Table 7. Institution of Birth and Cesarean Delivery
Table 8. Socio-Demographics and Institution of Birth Socio-Demographic Characteristic Public Institution %(N) Social Security Institution % (N) Private Institution % (N) P-Value Area <0.001
Urban 66.66 (2,901) 5.61 (244) 27.73 (1.207)
Rural 78.11 (1,995) 4.11 (105) 17.78 (454)
Total 70.89 (4,896) 5.05 (349) 24.05 (1,661)
Primary Language <0.001
Indigenous 91.86 (282) 3.91 (12) 4.23 (13)
Castilian/ Spanish 69.93 (4,604) 5.12 (337) 24.95 (1,643)
Total 70.90 (4,886) 5.06 (349) 24.03 (1,656)
Self-Identified Ethnicity <0.001
Indigenous 89.88 (622) 3.90 (27) 6.21 (43)
Afroecuatoriano 82.64 (100) 4.96 (6) 12.40 (15)
Negro(a) 89.47 (68) 5.26 (4) 5.26 (4)
Mulato (a) 73.87 (82) 7.21 (8) 18.92 (21)
Montubio (a) 54.11 (112) 3.38 (7) 42.51 (88)
Mestizo (a) 68.73 (3,831) 5.24 (292) 26.03 (1,451)
Blanco (a) 68.68 (66) 4.67 (5) 33.64 (36)
Otro (a) 82.35 (14) 0.00 (0) 17.65 (3)
Total 70.89 (4,895) 5.05 (349) 24.06 (1,661)
Literacy <0.001
Can read and write 70.60 (4,793) 5.14 (349) 24.26 (1,647) Cannot read and write 87.93 (102) 0.00 (0) 12.07 (14)
Total 70.89 (4,895) 5.05 (349) 24.06 (1,661)
Level of Education <0.001
None 87.50 (70) 0.00 (0) 12.50 (10)
Primary School 80.43 (1,562) 3.24 (63) 16.32 (317)
Secondary School 69.69 (1,846) 3.89 (103) 26.43 (700) Superior/Postgrado 58.54 (1,052) 9.74 (175) 31.72 (570)
Total 70.04 (4,530) 5.27 (341) 24.69 (1,597)
Marital status <0.001
Casado (a) 65.74 (1,813) 7.61 (210) 26.65 (735)
Unido (a) 74.61 (2,033) 2.72 (74) 22.68 (618)
Socio-Demographic Characteristics and Care Practices
General trends identified in this analysis may inform how women shape their care practices during pregnancy and birth. Typically, women who are rural, indigenous, and have lower education and incomes receive more public care, and less antenatal care specifically, than women who are urban, white or Mestiza, and have higher education and income. Two socio-demographic variables, region and primary language, may be able to increase our understanding of these care differences, as they may representative of these larger trends.
Figure 2, Figure 3, and Figure 4 show how region influences care. Figure 2 shows the number of urban and rural women who receive certain types of care and the number of those women who deliver by cesarean section for each care type. Notably, there are many more urban than rural women, and a larger proportion of urban women deliver by cesarean section in every category.
Total 70.89 (4,895) 5.05 (349) 24.06 (1,661)
Work in Last Week <0.001
Does not work 72.83 (2,941) 3.00 (121) 24.17 (976)
Has had a job and is looking for a job
60.34 (35) 8.62 (5) 31.03 (18)
Did not work but has a job 58.82 (20) 11.76 (4) 29.41 (10) Less than one hour 67.66 (1,728) 8.38 (214) 23.96 (612)
At least one hour 77.38 (171) 2.26 (5) 20.36 (45)
Total 70.89 (4,895) 5.05 (349) 24.06 (1,661)
Monthly Gross Income (US dollars)
<0.001
≤ $50 76.71 (448) 2.40 (14) 20.89 (122)
> $50, ≤ $160 81.51 (560) 1.60 (11) 16.89 (116) > $160, ≤ $300 67.64 (531) 8.28 (65) 24.08 (189)
> $300 50.48 (367) 17.88 (130) 31.08 (230)
Figure 3 elaborates, showing this relationship in terms of the percentage of urban and rural women that receive a particular type of care. Figure 3 shows that most women, whether urban or rural, receive prenatal and birth care in public institutions; however a larger proportion of urban women use private care services than rural women, and a larger proportion of rural women use public care services than urban women. Notably, the majority of both rural and urban women attend 7-9 prenatal care appointments. Despite this, overall larger proportions of rural women attend fewer visits, while larger proportions of urban women attend more visits.
Figure 4 shows the percentage of women of a particular region and type of care who deliver by cesarean section. For example, Figure 4 shows that 38.11% of urban women who utilize public prenatal care deliver by cesarean section, while only 28.94% of rural women who utilize public prenatal care deliver by cesarean. Figure 4 shows that in every category of care, a larger percentage of urban women have cesarean sections.
Figure 2. Care Practices and Cesarean Section: Urban vs. Rural Women
0 500 1000 1500 2000 2500 3000 3500
U rb an Ru ral U rb an Ru ral U rb an Ru ral U rb an Ru ral U rb an Ru ral U rb an Ru ral U rb an Ru ral U rb an Ru ral U rb an Ru ral U rb an Ru ral
Public SS Private 1 2 3 4 Public SS Private Prenatal Care Number Prenatal Visits Birth Care
Num
be
r of
W
om
en
Cesarean
Figure 3. Care Practices of Urban and Rural Women
Figure 4. Percent Cesarean Births: Urban vs. Rural 0
10 20 30 40 50 60 70 80 90 100
U rb an Ru ral U rb an Ru ral U rb an Ru ral U rb an Ru ral U rb an Ru ral U rb an Ru ral U rb an Ru ral U rb an Ru ral U rb an Ru ral U rb an Ru ral
Public SS Private 1 2 3 4 Public SS Private Prenatal Care Number Prenatal Visits Birth Care
%
W
om
en
0 10 20 30 40 50 60 70 80
U rb an Ru ral U rb an Ru ral U rb an Ru ral U rb an Ru ral U rb an Ru ral U rb an Ru ral U rb an Ru ral U rb an Ru ral U rb an Ru ral U rb an Ru ral
Public SS Private 1 2 3 4 Public SS Private Prenatal Care Number Prenatal Visits Birth Care
% Ce sa re an B irt hs
Note. Number of Prenatal Visit categories: 1: 1-‐3 visits, 2: 4-‐6 visits, 3: 7-‐9 visits, 4: 10 or more visits
Region addresses a broad characteristic that may shape care practices. An analysis of the women who differ based on primary language provides a narrower snapshot of women who may be even more remote than those captured in the rural category above, given that the number of women who speak indigenous languages is much smaller than the number of rural women in this analysis. This will provide a clearer picture of who is delivering by cesarean section, and it may also elucidate a better understanding of limits in access to care. Figures 5 – 7 address how primary language is associated with care practices and cesarean delivery rates.
Figure 5 shows that there are many more Castilian and Spanish speakers than indigenous language speakers, and that the proportion of Castilian and Spanish speaking women who deliver by cesarean section is larger than the proportion of indigenous speakers in every care category.
Figure 6 shows that a greater percentage of indigenous speakers seek prenatal and birth care at public institutions than Castilian and Spanish speakers. The opposite also holds, that a greater percentage of Castilian and Spanish speakers than indigenous speakers seek care at private institutions. The graph also shows that a larger percentage of indigenous speakers receive only 1-3 prenatal care visits, while a larger percentage of Castilian and Spanish speakers receive ten or more visits.
Figure 5. Care Practices and Cesarean Section: Castilian/Spanish vs. Indigenous Speakers
Figure 6. Care Practices of Castilian/Spanish and Indigenous Speaking Women 0
1000 2000 3000 4000 5000 6000
C/Sp Indi
g
C/Sp Indi
g
C/Sp Indi
g
C/Sp Indi
g
C/Sp Indi
g
C/Sp Indi
g
C/Sp Indi
g
C/Sp Indi
g
C/Sp Indi
g
C/Sp Indi
g
Public SS Private 1 2 3 4 Public SS Private Prenatal Care Number Prenatal Visits Birth Care
Num
be
r of
W
om
en
Cesarean
Vaginal
0 10 20 30 40 50 60 70 80 90 100
C/Sp Indig C/Sp Indig C/Sp Indig C/Sp Indig C/Sp Indig C/Sp Indig C/Sp Indig C/Sp Indig C/Sp Indig C/Sp Indig Public SS Private 1 2 3 4 Public SS Private
Prenatal Care Number Prenatal Visits Birth Care
%
W
om
en
Note. Number of Prenatal Visit categories: 1: 1-‐3 visits, 2: 4-‐6 visits, 3: 7-‐9 visits, 4: 10 or more visits
Figure 7. Percent Cesarean Births: Castilian/Spanish vs. Indigenous Speakers
Motivations for Selecting Institution of Birth
Figure 8 summarizes the motivations that women voiced for selecting the establishment where they delivered their child. Women were able to select more than one motivation. Results show that the primary consideration for giving birth in a public institution was economic, with 49.65% of women citing economic factors. The primary reason for giving birth in a social
security institution (73.93%) was that it was affiliated or covered, and the primary motivation for giving birth in a private institution was confidence in the staff (35.28%).
0 10 20 30 40 50 60 70
C/Sp Indig C/Sp Indig C/Sp Indig C/Sp Indig C/Sp Indig C/Sp Indig C/Sp Indig C/Sp Indig C/Sp Indig C/Sp Indig Public SS Private 1 2 3 4 Public SS Private
Prenatal Care Number Prenatal Visits Birth Care
%
Ce
sa
re
an
B
irt
hs
Figure 8. Motivation for Selection of Birth Establishment
Subset Analysis: Primiparous Women
A subset analysis of exclusively primiparous women was run to assess the influence that a previous cesarean section may have had on the risk of cesarean in the full sample. This analysis was limited to 2,252 women. Table 9 summarizes complications during pregnancy and birth with cesarean delivery, analyzing medical indication for cesarean section. Unlike in the full sample, severe headaches during pregnancy were associated with cesarean section, and neither
“dizziness, nausea, and vomiting,” nor fever during pregnancy were. In this subset, unlike the full sample, the complications “generalized infection or sepsis” and “the baby was not moving” were not significant. The dataset only analyzed women who had only ever had one child, so the complication “multiple births” was irrelevant, since any woman having twins or triplets would be excluded from this subset.
0 10 20 30 40 50 60 70 80 Economic factors
Confidence in the staff Good service Emergency It is close It is safe Trained professional staff It is affiliated or covered It accepts private insurance Other
Percent
Public
Social Security
Complication Vaginal Birth
% (N) C-Section % (N) P-value
Complications During Pregnancy
Swelling of hands and feet 54.03 (570) 45.97 (485) <0.001
Fainting 58.58 (140) 41.42 (99) 0.652
Severe or permanent headache 55.35 (362) 44.65 (292) 0.004
Convulsions 56.96 (45) 43.04 (34) 0.562
Severe belly aches 59.33 (391) 40.67 (268) 0.709
Dizziness, nausea, vomiting 58.94 (847) 41.06 (590) 0.190
Fever 55.07 (152) 44.93 (124) 0.075
Preeclampsia or Eclampsia 44.01 (125) 55.99 (159) <0.001
UTI 56.05 (727) 43.95 (570) <0.001
Bleeding or Hemorrhage 50.00 (139) 50.00 (139) <0.001
Complications During Birth
Did not have pains or contractions 51.06 (289) 48.94 (277) <0.001 Delivery took longer than normal 60.49 (274) 39.51 (179) 0.922
The birth was early 44.44 (160) 55.56 (200) <0.001
Baby badly positioned (crossed
shoulder, buttocks, feet) 23.37 (68) 76.63 (223) <0.001
Narrow hips 34.68 (163) 65.32 (307) <0.001
Heavy bleeding 70.72 (227) 29.28 (94) <0.001
Generalized infection/Sepsis 52.63 (70) 47.37 (63) 0.079
The baby was not moving 53.59 (82) 46.41 (71) 0.081
Cord wrapped around the baby’s neck 33.18 (73) 66.82 (147) <0.001
Low birth weight 71.82 (79) 28.18 (31) 0.005
Preterm 39.25 (104) 60.75 (161) <0.001
Like the full sample, women who most frequently received prenatal care at social security institutions and private institutions were associated with a higher risk of delivering by cesarean (Table 10), and the number of prenatal care visits that a woman attended was significantly associated with risk for cesarean section, with the most visits posing the highest risk for cesarean delivery (Table 11). Similarly, logistic regression showed that women who gave birth in social security institutions or private institutions had a higher risk of cesarean section than those who
and care during the delivery, the OR for care at a social security institution was higher than the OR for care in a private institution. Overall, this subset analysis did not differ drastically from the analysis of the full sample.
OR p-value 95% CI
Social Security 2.93 ≤ 0.001 1.79 – 4.78
Private 2.52 ≤ 0.001 2.06 – 3.08
OR Std. Error z-score p-value 95% CI
4 – 6 visits 2.41 0.52 4.04 ≤ 0.001 1.57 – 3.69
7 – 9 visits 2.75 0.58 4.81 ≤ 0.001 1.82 – 4.14
≥10 visits 5.19 1.23 6.97 ≤ 0.001 3.27 – 8.25
OR p-value 95% CI
Social Security 5.12 ≤ 0.001 3.21 – 8.16
Private 4.60 ≤ 0.001 3.76 – 5.62
Table 10. Institution of Prenatal Care and Cesarean Delivery Primiparous Women
Table 11. Number of Prenatal Care and Cesarean Delivery Primiparous Women
Table 12. Institution of Birth and Cesarean Delivery Primiparous Women
N = 2125, p-value ≤ 0.001
DISCUSSION
Summary of Results
Our findings indicate that the number of prenatal visits, which may serve as an indicator of how medicalized a woman’s pregnancy is, is an important predictor of cesarean delivery. Findings also showed that both the institution where a woman receives prenatal care and the institution where she gives birth are important indicators of the type of delivery she will have. Last, it seems that the type and frequency of care are both mediators between socio-demographic variables and mode of delivery. Analysis of these socio-demographic characteristics
demonstrates that there may be barriers in access to care, which contributes to our understanding of how Ecuadorian women are navigating the re-structured health care system.
The Role of Prenatal Care
While prenatal care is ultimately beneficial to the health of both mother and child, the number of prenatal care visits, independent of the care provider, is significantly associated with risk of cesarean delivery. The increased medicalization of pregnancy and birth in recent decades likely plays a crucial role in this relationship. The Law of Free Maternity and Child Care
their pregnancies, beginning the first trimester (Freire et al. 2015). Since this legislation was passed, maternal and infant mortality have dropped dramatically (World Bank 2006).
Nonetheless, the number of prenatal care visits may be an indicator for how medicalized a pregnancy is. Increased medicalization increases the use of technology throughout pregnancy, making medical technologies, including cesarean section, more normalized and more common (Belizán et al. 1999). Increased medicalization of pregnancy, and an increased number of prenatal care visits, also provides more opportunity for the technologies of prenatal care to influence the mode of delivery. Ultrasounds, used at many prenatal care appointments, may indicate a badly positioned fetus or that the umbilical cord is wrapped around the fetus’ neck. Despite the fact that these circumstances may change by delivery, diagnostics before birth influence both the patient’s and the doctor’s assumptions that cesarean section may be best (Béhague 2002).
Another explanation for the trend that an increased number of prenatal care visits
increases risk of cesarean section could be that a woman who has concerns about her pregnancy schedules more prenatal visits. In this case, the medical concerns of eventual cesarean delivery may be influencing care behavior.
Three Tiers of Care
Attending prenatal care at a social security or private institution significantly and dramatically increases a woman’s risk of delivering by cesarean section. These results are consistent with the results of a WHO study on maternal and perinatal health in Latin America, which showed that cesarean deliveries are most common in private centers, followed by social security centers, and least common in public institutions throughout Latin America (Villar et al. 2006). The WHO study also found that characteristics of institutions, such as whether they are public or private or receive economic incentive for cesarean deliveries, explained 48% of the variability among risk-adjusted rates of cesarean section (Taljaard et al. 2009). Our results also echo Béhague’s (2002) findings in Brazil, that wealthier women, who can afford private care, are more likely to undergo an unnecessary, costly, and risky cesarean section, while the women who are most likely to need one do not have one. While Ecuador has recently adopted universal healthcare coverage, neoliberal structures, specifically private health care providers, persist from the 1980s and 1990s and still wield great influence on Ecuador’s health care system.
Socio-Demographic Characteristics Shape Care
Ecuador’s fragmented health care system poses deep-rooted, structural barriers to equal, quality healthcare. For each care variable analyzed (place of prenatal care, number of prenatal care visits, and place of birth), socio-demographic variables (a woman’s region, primary
language, self-identified ethnicity, literacy status, level of education, marital status, weekly work, and gross monthly income) were significantly associated with care.