“Why Should I Trust You?”
Explaining the Predictions of Any Classifier
Marco Tulio Ribeiro University of Washington
Seattle, WA 98105, USA [email protected]
Sameer Singh University of Washington
Seattle, WA 98105, USA [email protected]
Carlos Guestrin University of Washington
Seattle, WA 98105, USA [email protected]
Abstract
Despite widespread adoption in NLP, machine learning models remain mostly black boxes. Understanding the reasons behind predictions is, however, quite important in assessing trust in a model. Trust is fundamental if one plans to take action based on a prediction, or when choosing whether or not to deploy a new model. In this work, we describe LIME, a novel expla-nation technique that explains the predictions of any classifier in an interpretable and faith-ful manner. We further present a method to explain models by presenting representative in-dividual predictions and their explanations in a non-redundant manner. We propose a demon-stration of these ideas on different NLP tasks such as document classification, politeness de-tection, and sentiment analysis, with classifiers like neural networks and SVMs. The user inter-actions include explanations of free-form text, challenging users to identify the better clas-sifier from a pair, and perform basic feature engineering to improve the classifiers.
1 Introduction
Machine learning is at the core of many recent ad-vances in natural language processing. Unfortunately, the important role of humans is an oft-overlooked as-pect in the field. Whether humans are directly using machine learning classifiers as tools, or are deploying models into products that need to be shipped, a vital concern remains:if the users do not trust a model or a prediction, they will not use it. It is important to differentiate between two different (but related) defi-nitions of trust: (1)trusting a prediction, i.e. whether
a user trusts an individual prediction sufficiently to take some action based on it, and (2)trusting a model, i.e. whether the user trusts a model to behave in rea-sonable ways if deployed “in the wild”. Both are directly impacted by how much the human under-stands a model’s behavior, as opposed to seeing it as a black box. Recent resurgence of neural networks has resulted in state-of-art models whose working is quite opaque to the user, exacerbating this problem. A common surrogate for ascertaining trust in a model is to evaluate accuracy on held-out annotated data. However, there are several ways this evaluation can go wrong. Data leakage, for example, defined as the unintentional leakage of signal into the training (and validation) data that would not occur in the wild (Kaufman et al., 2011), potentially increases accu-racy. Practitioners are also known to overestimate the accuracy of their models based on cross validation (Patel et al., 2008), as real-world data is often signifi-cantly different. Another particularly hard to detect problem is dataset shift (Candela et al., 2009), where training data is different than test data. Further, there is frequently a mismatch between that metrics that we can compute and optimize (e.g. accuracy) and the actual metrics of interest such as user engagement and retention. A practitioner may wish to choose a less accurate model for content recommendation that does not place high importance in features related to “clickbait” articles (which may hurt user reten-tion), even if exploiting such features increases the accuracy of the model in cross validation.
In this paper, we describe a system thatexplains
why a classifier made a prediction by identifying useful portions of the input. It has been observed
that providing an explanation can increase the ac-ceptance of computer-generated movie recommen-dations (Herlocker et al., 2000) and other automated systems (Dzindolet et al., 2003), and we explore their utility for NLP. Specifically, we present:
• LIME, an algorithm that can explain the predic-tions ofanyclassifier, by approximating it locally with an interpretable model.
• SP-LIME, a method that selects a set of representa-tive explanations to address the “trusting the model” problem, via submodular optimization.
• A demonstration designed to present the benefits of these explanation methods, on multiple NLP classification applications, classifier algorithms, and trust-related tasks.
2 Explaining Predictions and Models
By “explaining a prediction”, we mean presenting vi-sual artifacts that provide qualitative understanding of the relationship between the instance’s components (e.g. words in text) and the model’s prediction. Ex-plaining predictions is an important aspect in getting humans to trust and use machine learning effectively, provided the explanations are faithful and intelligible. We summarize the techniques here; further details and experiments are available in Ribeiro et al. (2016).
Local Interpretable Model-Agnostic Explanations
We present Local Interpretable Model-agnostic Ex-planations (LIME). The overall goal of LIME is to identify an interpretable model over the inter-pretable representationthat islocally faithfulto pre-dictions ofany classifier. It is important to distin-guish between features and interpretable data repre-sentations, the latter is a representation that is under-standable to humans, regardless of the actual features used by the model. A possibleinterpretable represen-tationfor text is a binary vector indicating the pres-ence or abspres-ence of a word, even though the classifier may use more complex (and incomprehensible) fea-tures such as word embeddings. We denotex∈Rd as the original instance, andx0 ∈ {0,1}d0
to denote a binary vector for its interpretable representation.
Formally, we define an explanation as a model
g ∈ G, where G is the class of linear models,
such thatg(z0) = wg·z0 Note thatgacts over ab-sence/presence of theinterpretable components, i.e. we can readily present it to the user with visual ar-tifacts. We letΩ(g)be a measure ofcomplexity(as opposed tointerpretability) of the explanationg∈G. For text classification, we set a limitKon the number of words included, i.e.Ω(g) =∞1[kwgk0 > K].
Let the model being explained be denotedf, i.e.
f(x)is the probability (or a binary indicator) thatx
belongs to a certain class. We further useΠx(z)as a proximity measure between an instanceztox, so as to define locality aroundx. Finally, letL(f, g,Πx) be a measure of how unfaithfulgis in approximat-ingf in the locality defined by Πx. We use the lo-cally weighted square loss asL, as defined in Eq. (1), where we let Πx(z) = exp(−D(x, z)2/σ2) be an exponential kernel on cosine distanceD.
L(f, g,Πx) =
X
z,z0∈Z
Πx(z) f(z)−g(z0)2 (1)
In order to ensure both interpretabilityand local fidelity, we minimizeL(f, g,Πx)while havingΩ(g) be low enough to be interpretable by humans.
ξ(x) =argming∈G L(f, g,Πx) + Ω(g) (2) We approximate L(f, g,Πx) by drawing samples, weighted by Πx. Given a sample z0 ∈ {0,1}d0 (which contains a fraction of the nonzero elements ofx0), we recover the sample in the original repre-sentationz∈Rdand obtainf(z), which is used as a
labelfor the explanation model. Given this datasetZ
of perturbed samples with the associated labels, we optimize Eq. (2) to get an explanationξ(x)by first selectingKfeatures with Lasso (Efron et al., 2004), forward selection or some other method, and then learning the weights via least squares.
Submodular Pick for Explaining Models
explanations humans are willing to look at a bud-getB, i.e. given a set of instancesX, we selectB
explanations for the user to inspect. We construct ann×d0 explanation matrixW that represents the local importance of the interpretable components for each instance, i.e. for an instancexi and explana-tion gi = ξ(xi), we set Wi = |wgi|. Further, for
each componentjinW, we letIj denote theglobal importance,Ij =pPni=1Wij.
While we want to pick instances that cover the im-portant components, the set of explanations must not be redundant in the components they show the users, i.e. avoid selecting instances with similar explana-tions. We formalize this non-redundant coverage intuition in Eq. (3), where coverageC, givenW and
I, computes the total importance of the features that appear in at least one instance in a setV.
C(V,W, I) = d 0
X
j=1
1[∃i∈V:Wij>0]Ij (3)
The pick problem thus consists of finding the set
V,|V| ≤Bthat achieves highest coverage.
P ick(W, I) =argmaxV,|V|≤BC(V,W, I) (4) The problem in Eq. (4) is maximizing a weighted cov-erage function, and is NP-hard (Feige, 1998). Due to submodularity, a greedy algorithm that iteratively adds the instance with the highest coverage gain of-fers a constant-factor approximation guarantee of 1−1/eto the optimum (Krause and Golovin, 2014).
3 Demo Outline
Using this explanation system that is capable of providing visual explanations for predictions of any classifier, we present an outline for a demon-stration using different NLP tasks, models, and user interactions. The complete source code and documentation for installing and running the demonstration is available at https://github. com/uw-mode/naacl16-demo, which uses the code for explaining classifiers available as an open-source python implementation athttps:// github.com/marcotcr/lime.
Applications
We explore three NLP classification tasks, which dif-fer in the types of text they apply to and predicted
cat-egories: politeness detection for sentences (Danescu-Niculescu-Mizil et al., 2013), multi-class content classification for documents (20 newsgroups data), and sentiment analysis of sentences from movie re-views (Socher et al., 2013). We explore classifiers for these tasks that vary considerably in their underlying representation, such as LSTMs (Wieting et al., 2015), SVMs, and random forests, trained on bag of words or on word embeddings.
We will outline the specific user interactions using a running example of the 20 newsgroups dataset, and the interfaces for the other applications will look simi-lar. In particular, we focus on differentiating between “Christianity” from “Atheism”, and use an SVM with an RBF kernel here. Although this classifier achieves 94%held-out accuracy, and one would be tempted to trust it based on this, the explanation for an instance shows that predictions are made for quite arbitrary reasons (words “Posting”, “Host” and “Re” have no connection to either Christianity or Atheism).
3.1 Explaining Individual Predictions
The first part of the demo focuses on explaining in-dividual predictions. Given an instance that the user either selects from the dataset or writes their own piece of text, we provide the set of words that are im-portant for the prediction according to the classifier of their choosing. The interface for the user is shown in Figure 1, which embedded in an iPython notebook. For most datasets and classifiers, our current system can produce an explanation in under three seconds, and some simple further optimizations can be used to produce near-instant explanations.
3.2 Explaining and Comparing Models
For the second part of the demonstration, we provide explanations of different models in order to compare them, based on explanations of a few selected in-stances. The interface presents the explanations one at a time, similar to that in Figure 1. By default the in-stances are selected using our submodular approach (SP-lime), however we also allow users to write their own text as well, and produce explanations for the classifiers for comparison.
3.3 Improving Classifiers
Figure 1: Example explanation for an instance of document classification. The bar chart represents the importance given to the most relevant words by the classifier, also highlighted in the text. Color indicates which class the word is important for (orange for “Christianity”, blue for “Atheism”).
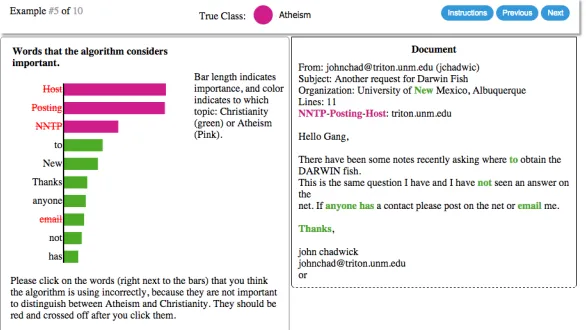
Figure 2: Interface forfeature cleaning, a simple version of feature engineering where users select words to remove from the model by clicking on them (indicated by red, struck-out text). Here, green bars indicate importance of the word for “Christianity”, and magenta “Atheism”.
each user with a classifier trained usingallfeatures, including both noisy and correct ones. We then show explanations of the classifier to the users, and ask them to select which words to remove from the clas-sifier (see Figure 2 for the interface). Given this feedback, we retrain the classifier and provide the users with a score of how well their classifier per-formed on a hidden set, along with aleader boardof the accuracy of all the participants.
4 Conclusions
We argue that trust is crucial for effective human interaction with machine learning based NLP sys-tems, and that explaining individual predictions is important in assessing trust. We present a demonstra-tion for LIME, a modular and extensible approach to faithfully explain the predictions ofanymodel in
an interpretable manner, and SP-LIME, a method to select representative and non-redundant explanations, providing a global view of the model to users. The user interactions on multiple applications and clas-sifiers span a variety of trust-related tasks: getting insights into predictions, deciding between models, and improving untrustworthy models.
Acknowledgments
[image:4.612.160.453.228.393.2]References
J. Quiñonero Candela, M. Sugiyama, A. Schwaighofer, and N. D. Lawrence. 2009.Dataset Shift in Machine Learning. MIT.
Cristian Danescu-Niculescu-Mizil, Moritz Sudhof, Dan Jurafsky, Jure Leskovec, and Christopher Potts. 2013. A computational approach to politeness with applica-tion to social factors. InProceedings of ACL.
Mary T. Dzindolet, Scott A. Peterson, Regina A. Pom-ranky, Linda G. Pierce, and Hall P. Beck. 2003. The role of trust in automation reliance. Int. J. Hum.-Comput. Stud., 58(6).
Bradley Efron, Trevor Hastie, Iain Johnstone, and Robert Tibshirani. 2004. Least angle regression. Annals of Statistics, 32:407–499.
Uriel Feige. 1998. A threshold of ln n for approximating set cover. J. ACM, 45(4), July.
Jonathan L. Herlocker, Joseph A. Konstan, and John Riedl. 2000. Explaining collaborative filtering recommenda-tions. InConference on Computer Supported Coopera-tive Work (CSCW).
Shachar Kaufman, Saharon Rosset, and Claudia Perlich. 2011. Leakage in data mining: Formulation, detection,
and avoidance. In Knowledge Discovery and Data Mining (KDD).
Andreas Krause and Daniel Golovin. 2014. Submodu-lar function maximization. InTractability: Practical Approaches to Hard Problems. Cambridge University Press, February.
Kayur Patel, James Fogarty, James A. Landay, and Bev-erly Harrison. 2008. Investigating statistical machine learning as a tool for software development. InHuman Factors in Computing Systems (CHI).
Marco Tulio Ribeiro, Sameer Singh, and Carlos Guestrin. 2016. “Why should I trust you?”: Explaining the pre-dictions of any classifier. CoRR, abs/1602.04938. Richard Socher, Alex Perelygin, Jean Wu, Jason Chuang,
Christopher D. Manning, Andrew Y. Ng, and Christo-pher Potts. 2013. Recursive deep models for semantic compositionality over a sentiment treebank. In Pro-ceedings of the 2013 Conference on Empirical Methods in Natural Language Processing, pages 1631–1642, Stroudsburg, PA, October. Association for Computa-tional Linguistics.