MBoC
|
ARTICLE
Superresolution microscopy of the
β
-carboxysome reveals a homogeneous matrix
ABSTRACT Carbon fixation in cyanobacteria makes a major contribution to the global carbon cycle. The cyanobacterial carboxysome is a proteinaceous microcompartment that protects and concentrates the carbon-fixing enzyme ribulose-1,5-bisphosphate carboxylase/oxygen-ase (RuBisCO) in a paracrystalline lattice, making it possible for these organisms to fix CO2
from the atmosphere. The protein responsible for the organization of this lattice in beta-type carboxysomes of the freshwater cyanobacterium Synechococcus elongatus, CcmM, occurs in two isoforms thought to localize differentially within the carboxysome matrix. Here we use wide-field time-lapse and three-dimensional structured illumination microscopy (3D-SIM) to study the recruitment and localization of these two isoforms. We demonstrate that this su-perresolution technique is capable of distinguishing the localizations of the outer protein shell of the carboxysome and its internal cargo. We develop an automated analysis pipeline to analyze and quantify 3D-SIM images and generate a population-level description of the carboxysome shell protein, RuBisCO, and CcmM isoform localization. We find that both CcmM isoforms have similar spatial and temporal localization, prompting a revised model of the internal arrangement of the β-carboxysome.
INTRODUCTION
RuBisCO (ribulose-1,5-bisphosphate carboxylase/oxygenase), the primary enzyme of carbon fixation, is ubiquitous in autotrophic organisms. However, it is notoriously inefficient and readily partici-pates in energetically wasteful side reactions with O2 (Andersson
and Backlund, 2008). Many organisms that rely on RuBisCO to
acquire inorganic carbon tune the enzyme’s local microenvironment to achieve sufficient levels of carbon fixation. While plants can do this within membrane barriers, many single-celled organisms have evolved a strategy of proteinaceous compartmentalization.
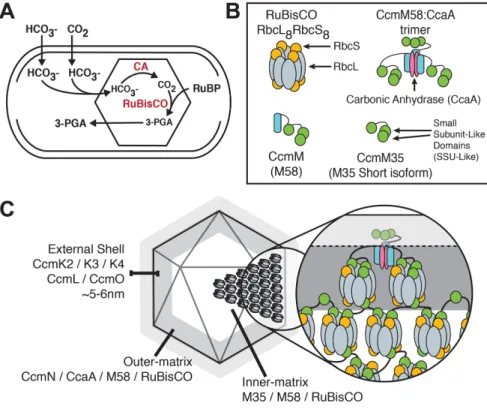
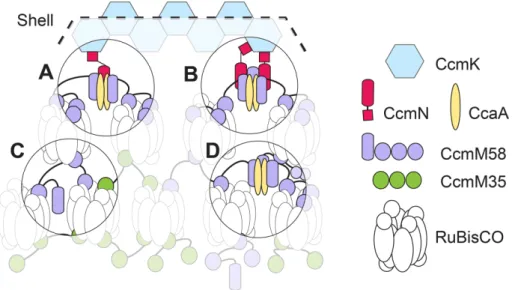
The carboxysome is a bacterial microcompartment found in cyanobacteria and prokaryotic chemoautotrophs. Composed of thou-sands of individual subunits, the carboxysome encapsulates RuBisCO and carbonic anhydrase (CA) within an icosahedral shell, making sur-vival possible at atmospheric levels of CO2 (Figure 1A; Badger and Price, 2003; Rae et al., 2012, 2013; Kerfeld and Melnicki, 2016).
While evolutionarily distinct carboxysomes share many similar structural features, the RuBisCO in the beta-type carboxysome (β -carboxysome) of the freshwater cyanobacterium Synechococcus elongatus PCC7942 is organized into a paracrystalline lattice (Kaneko et al., 2006; Rae et al., 2013). The structural protein CcmM has been implicated in connecting individual RuBisCO enzymes into an ordered matrix, resulting in the observed dense crystalline pack-ing (Long et al., 2007, 2010; Cot et al., 2008; Cameron et al., 2013). The full-length 58-kDa CcmM protein of PCC7942 is characterized by an N-terminal CA binding domain and three repeating domains toward the C-terminal end that have sequence homology to the small subunit of RuBisCO (Figure 1B; Price et al., 1993). Owing to an internal ribosomal entry site (IRES), CcmM is translated as two
Monitoring Editor Benjamin S. Glick University of Chicago
Received: Jan 30, 2017 Revised: Jul 26, 2017 Accepted: Aug 2, 2017
This article was published online ahead of print in MBoC in Press (http://www .molbiolcell.org/cgi/doi/10.1091/mbc.E17-01-0069) on August 9, 2017.
A previous version of this article was posted to BioRxiv (https://doi.org/10.1101/ 086090).
†Present address: Department of Biology, Department of Genetics, Curriculum in
Genetics and Molecular Biology, and Integrative Program for Biological and Genome Sciences, The University of North Carolina at Chapel Hill, Chapel Hill, NC 27599. *Address correspondence to: Jessica K. Polka ([email protected]).
© 2017 Niederhuber et al. This article is distributed by The American Society for Cell Biology under license from the author(s). Two months after publication it is available to the public under an Attribution–Noncommercial–Share Alike 3.0 Unported Creative Commons License (http://creativecommons.org/licenses/by-nc-sa/3.0). “ASCB®,” “The American Society for Cell Biology®,” and “Molecular Biology of
the Cell®” are registered trademarks of The American Society for Cell Biology.
Abbreviations used: 3D-SIM, 3D-structured illumination microscopy; B-ccmM-N, mTagBFP2-ccmM-mNeonGreen; CA, carbonic anhydrase; CUDA, Compute Unified Device Architecture; HCR, high CO2 requirement; IPTG, isopropyl β-d
-1-thiogalactopyranoside; IRES, internal ribosomal entry site; K4, CcmK4; M35, CcmM35; M58, CcmM58; RIH, reconstructed intensity histogram; RuBisCO, ribulose-1,5-bisphosphate carboxylase/oxygenase; SSU, small subunit domain; WT, wild type.
Matthew J. Niederhubera,b,†, Talley J. Lambertc, Clarence Yappd, Pamela A. Silvera,b, and Jessica K. Polkaa,b,*
aDepartment of Systems Biology, cDepartment of Cell Biology, and dImage and Data Analysis Core, Harvard
Medical School, Boston, MA 02115; bWyss Institute for Biologically Inspired Engineering, Harvard University,
fusions does not disrupt carboxysome function (Long et al., 2007; Cameron et al., 2013). Loss of either isoform of CcmM produces cells that have a high CO2 requirement (HCR) for growth (Woodger
et al., 2005; Long et al., 2010). However, complementation of such mutants with tagged copies of CcmM has been shown to rescue this phenotype (Long et al., 2007; Cameron et al., 2013).
Here we show the successful complementation of a ∆ccmM mutant with a dually fluorescently tagged integration of ccmM. This dual-tagging strategy does not significantly impair carboxysome formation, morphology, or function. In our time-lapse fluorescence microscopy data, we find that M58 may accumulate less rapidly than M35 during initial assembly but that the long isoform is pres-ent from the earliest points of detectable carboxysome assembly. Using superresolution three-dimensional structured illumination microscopy (3D-SIM), we examined the relative localization of car-boxysome shell, CcmM, and RuBisCO proteins. Our 3D-SIM data do not support a model of carboxysome internal organization in which M58 is limited to a layer just beneath the external protein shell. These data support a revised model of carboxysome internal structure in which M35 and M58 isoforms are both integrated deep within the core of the carboxysome and are both involved with the early steps of carboxysome assembly.
RESULTS
Fluorescent fusions to CcmM complement a deletion of the wild-type gene
We constructed a fluorescently tagged copy of ccmM by fus-ing a blue fluorescent protein (mTagBFP2) to the N-terminus
and a yellow-green fluorescent protein (mNeonGreen) to the C-terminus to make mTagBFP2-ccmM-mNeonGreen ( B-ccmM-N). We subsequently integrated this construct, which is under the control of the isopropyl β-d-1-thiogalactopyranoside
(IPTG) inducible promoter Ptrc, into the genome of an S. elongatus PCC7942 ∆ccmM::HygR mutant strain (Figure 2A), and verified expression by Western blot analysis (Figure 2B). This strategy allowed us to visually separate full-length M58 from truncated M35 by blue fluorescence. We found that Ptrc was sufficiently active to produce protein without induction. Consequently we never induced the ∆ccmM + B-ccmM-N strain, including for Western blot analysis, unless otherwise noted. We blotted lysates of wild-type (WT), ∆ccmM, and ∆ccmM + B-ccmM-N strains for the presence of CcmM (Figure 2B). In WT 7942 cells, we detected two bands at ∼60 and ∼40 kDa corresponding to the two native CcmM isoforms M58 and M35. In the ∆ccmM strain, these bands were absent. In the ∆ccmM + B-ccmM-N gene complement, we detected two bands at ∼140 and ∼70 kDa corresponding to expected molecular weight shifts of ∼60 (both fluorescent tags) and ∼30 kDa (mNeonGreen alone). The observed weight shift of the tagged CcmM demon-strates that the CcmM IRES is not impaired by the presence of N- and C-terminal tags isoforms, a full-length protein (M58) and a 35-kDa truncated version
(M35) that consists of only the three small subunit-like (SSU-like) do-mains (Long et al., 2007, 2010).
The current model of β-carboxysome internal structure suggests that the SSU-like domains of CcmM displace some of the small sub-units of the RbcL8RbcS8 RuBisCO holoenzyme and tether multiple enzymes together into a dense network (Figure 1C; Long et al., 2007, 2010; Rae et al., 2013; Kerfeld et al., 2016). Copurification and yeast two-hybrid experiments have shown that RuBisCO readily com-plexes with both isoforms of CcmM in PCC7942 (Long et al., 2007; Cot et al., 2008). In addition, fluorescence-tagging experiments have demonstrated that M35 alone is capable of nucleating an assembly of tagged RuBisCO if at least two of the SSU-like domains are pres-ent. However, M35 is not sufficient to cause encapsulation by recruit-ing shell components in the absence of M58 (Cameron et al., 2013). Densitometry analyses of Western blot experiments have found im-balanced ratios of RbcS to RbcL (∼5:8) in PCC7942 cell lysates, sug-gesting that some RbcS binding sites in the complex may instead be occupied by CcmM SSU-like domains (Long et al., 2011). These find-ings have supported a model of carboxysome architecture and step-wise assembly in which M35 nucleates a core of RuBisCO. In this model, M58 is limited to a layer beneath the shell where it can inter-act with CcmN, CA, and shell components. While this model predicts that the CcmM isoforms are differentially localized, these predictions have yet to be directly tested.
To test this model, we fluorescently tagged CcmM to visualize its assembly and the localization of CcmM isoforms in vivo. Previous work has shown that completely replacing CcmM with tagged
FIGURE 1: Current model of the cyanobacterial carboxysome internal structure. (A) S. elongatus uses the carboxysome to concentrate and protect its RuBisCO enzymes. Through a multistep process, bicarbonate passes into the carboxysome, is converted to CO2 by CA, and is then fixed by RuBisCO to form 3-phosphoglyceric acid (3-PGA). (B) Legend of
Our tagged ccmM complement grew at a rate comparable to WT at atmospheric levels of CO2 (Figure 2C). We grew WT 7942, the ∆ccmM mutant, and the ∆ccmM + B-ccmM-N complement in ambi-ent air and 2% CO2 conditions, measured optical density at 750 nm (OD750), and calculated doubling times between the 0- and 18-h
time points (see Materials and Methods). Approximate doubling times were calculated with these early time points to minimize po-tential impacts of self-shading. Both WT and ∆ccmM cells grew well when cultured with 2% CO2 flowed through the incubator
head-space, with doubling times of 7.7 ± 0.6 h (n= 5, error = SD) and 15.4 ± 9.2 h (n= 6, error = SD), respectively. As expected, ∆ccmM mutant growth was dependent on supplemented CO2 (Long et al., 2010); these cells showed no growth under conditions of atmo-spheric levels of CO2. In contrast, the ∆ccmM + B-ccmM-N comple-ment grew well in air with no supplecomple-mented CO2, with a doubling
time of 17.8 ± 2.3 h (n= 6, error = SD). This growth rate is similar to that of WT cells grown with atmospheric levels of CO2, which had a
doubling time of 14.1 ± 2.3 h (n= 6, error = SD), indicating that our engineered strain is capable of fixing carbon and that carboxysome function is not severely impaired by the dual-fusion ccmM comple-ment. Because both the M58 and M35 isoforms of CcmM are required for growth without CO2 supplementation (Long et al., 2010), our data indicate that both isoforms produced by our dual fusion are functional.
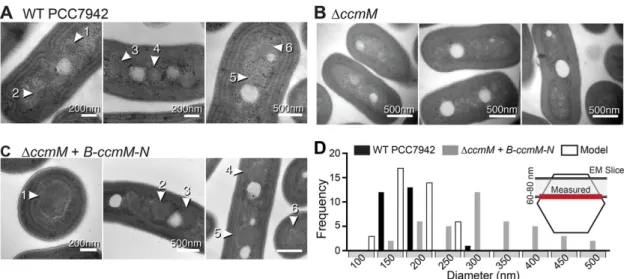
Carboxysomes formed in the ∆ccmM + B-ccmM-N complement were structurally like those of WT cells. Using transmission electron microscopy (TEM), we imaged ultrathin sections of fixed cells from WT 7942, ∆ccmM, and ∆ccmM + B-ccmM-N strains (Figure 3). Car-boxysomes in WT PCC7942 cells had an average maximum width of 179 ± 33 nm (n = 26, error = SD; Figure 3A). Carboxysomes in ∆ccmM + B-ccmM-N cells generally had a normal appearance and shape with visibly angled facets and often clear hexagonal geome-try, but were noticeably larger, with an average maximum diameter of 319 ± 92 nm (n= 41, error = SD; Figure 3C). This is not unex-pected; it has been previously reported that His-tagged ccmM com-plements increase carboxysome size (Long et al., 2007). Measured carboxysome diameters in WT and ∆ccmM + B-ccmM-N cells were found to have notably different frequency distributions (Figure 3D). Importantly, the section thickness used for TEM is narrower (∼70 nm) than the diameter of a typical carboxysome (∼150–250 nm), mean-ing that measured diameters likely underestimate true size. We compared the distribution we observed in WT to that of a theoreti-cal model that theoreti-calculated diameter based on slices through a spheri-cal object and found the frequency distribution (n= 40, mode = 150 nm) to be similar to that of WT (n= 26, mode = 200 nm; Figure 3D). Occasionally, dense masses at the cell poles were observed in ∆ccmM + B-ccmM-N micrographs, most likely indicating protein aggregation. Because we were using this strain without induction and no effective repressors exist, we cannot know whether reducing expression would prevent aggregate formation. However, IPTG- induced cells observed with 3D-SIM display a dramatic increase in polar protein aggregation, often filling a large portion of the cell, confirming that overexpression of this construct leads to aggrega-tion (Supplemental Figure S2).
The two CcmM isoforms have similar dynamics during carboxysome assembly
The two CcmM isoforms M35 and M58 displayed similar dynamics during carboxysome biogenesis, though mTagBFP2 and mNeon-Green fluorophores differed in their rate of accumulation, particu-larly during early stages of assembly. Using wide-field fluorescence microscopy, we imaged the ∆ccmM complement (B-ccmM-N) at and that both long and short CcmM isoforms are translated. We
also made a reciprocally tagged version of the CcmM comple-ment (mNeonGreen-CcmM-mTagBFP2) but did not use it for fur-ther analysis, because Western blotting showed the presence of protein degradation (Supplemental Figure S1).
The dual-fusion B-ccmM-N transgene produced different relative abundances of each CcmM isoform compared with bands detected in WT (Figure 2B). A greater amount of the shorter M35 than full-length M58 isoform was detected in WT cells, matching expecta-tions based on previously reported ratios (Long et al., 2007). In cells expressing the dual-fusion B-ccmM-N transgene, we observed a reduction in M35 levels relative to M58, though M35 remained more abundant. A similar effect on isoform levels has been observed previously upon tagging CcmM (Long et al., 2007, see Discussion). Thus carboxysomes formed with dual-tagged CcmM are inherently perturbed from WT in their protein composition.
FIGURE 2: Fluorescently tagged ccmM integrated into the genome of a ∆ccmM knockout produces both CcmM isoforms and restores growth in atmospheric air conditions. (A) Diagram of fluorescently tagged ccmM. N- and C-terminal fusion of mTagBFP2 and mNeonGreen produces short and long isoforms with different fluorescence characteristics. This construct was integrated into a
∆ccmM background to yield the ∆ccmM + mTagBFP2-ccmM-mNeonGreen (B-ccmM-N) strain. (B) Anti-CcmM Western blot of WT,
∆ccmM, and B-ccmM-N. Full-length M58 isoform of CcmM is ∼58 kDa, while the truncated M35 is ∼35 kDa. The fluorescent fusions of mTagBFP2-M58-mNeonGreen and M35-mNeonGreen have expected molecular weights of ∼113 and 63 kDa, respectively. (C) Growth curves of WT 7942 (n= 6 for atmospheric air, n= 5 for 2% CO2),
∆ccmM (n= 6 for atmospheric air and 2% CO2), and the B-ccmM-N
blue particles before green. Consequently the more rapid accumula-tion observed of mNeonGreen signal cannot, in the majority of ana-lyzed assembly events, be due to M35-N accumulating in the ab-sence of the full-length B-M58-N isoform.
For verification that this apparent bias toward detecting blue fluo-rescent particles was not due to poor signal from the green channel, the average maximum intensities of particle tracks were compared between the channels. As expected from the reported brightness of mNeonGreen, tracks from the green channel were found to have significantly higher maximum intensities on average (41.5 ± 11.2 a.u.) compared with mTagBFP2 (33.6 ± 8.7 a.u.) (Wilcoxon signed-rank test, p < 0.0001, n= 24, error = SD). Furthermore, due to differences in maturation times between mTagBFP2 and mNeonGreen (∼24 and <10 min, respectively), signal from mNeonGreen-tagged proteins was expected to be detectable at least as rapidly as signal from mTagBFP2 (Oksana et al., 2011; Shaner et al., 2013). A slower mTag-BFP2 maturation time could also account for the observed faster ac-cumulation of mNeonGreen. Together these data and analysis do not support a model of carboxysome assembly in which the short CcmM isoform M35 coordinates the RuBisCO lattice entirely in the absence of M58, suggesting instead that M58 may be involved in the early stages of organizing the inner carboxysome matrix.
M58 is not confined to a subshell layer in the carboxysome
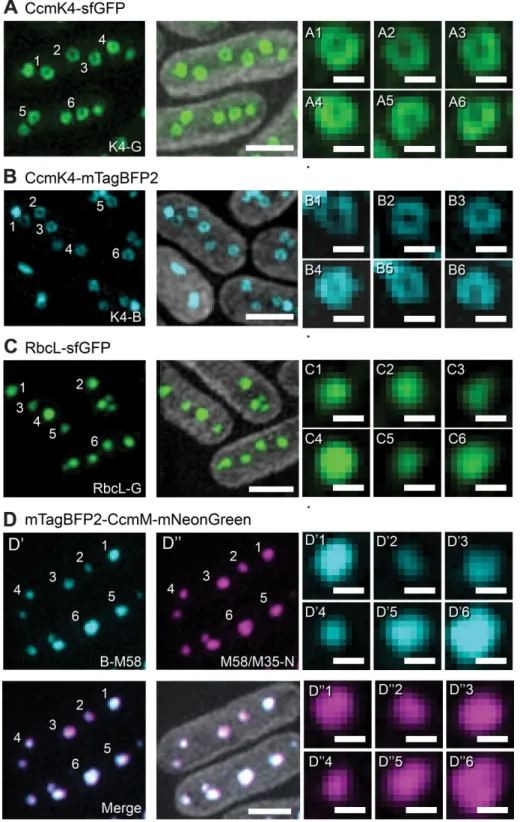
Superresolution microscopy of dual-tagged CcmM suggests that M58 and M35 are indistinguishable in their distribution in the car-boxysome. We used 3D-SIM to acquire superresolution images of the ∆ccmM + B-ccmM-N strain, RuBisCO tagged with a superfolder green fluorescent protein (RbcL-sfGFP), and two fluorescently tagged versions of the shell protein CcmK4 (mTagBFP2 and CcmK4-sfGFP) in PCC7942. The 3D-SIM images of strains with both GFP- and BFP-tagged CcmK4 laterally resolved the external carboxysome shell as a hollow ring (Figure 5, A and B), demonstrating that 3D-SIM provides sufficient resolution to visualize peripherally localized pro-teins in the carboxysome. To confirm these rings were not an artifact of 3D-SIM reconstruction, we imaged a strain of PCC7942 integrated 10-min intervals and quantified changes in fluorescence intensity
during carboxysome assembly (Figure 4A). Assembly times were es-timated based on the time it took a particle to go from the first spot in the automatically detected track that was ≥50% of its maximum intensity to the first value ≥95% of its maximum intensity. Automated particle tracking revealed that both CcmM isoforms assembled slowly, with a significantly different average assembly time of 15.09 ± 4.82 h (n= 24, error = SD) for green particles representing M58-mNeonGreen and M35-M58-mNeonGreen, and 13.29 ± 5.48 h (n= 24, error = SD) for blue particles representing mTagBFP2-M58 (Wilcoxon signed-rank test, p= 0.0174; Figure 4B). The measured assembly time is longer than the ∼6- to 7-h assembly time previously reported for RuBisCO (Chen et al., 2013), perhaps because of differences in temperature or light levels during imaging, or because carboxy-somes in this strain are larger than WT.
The current model of carboxysome assembly and structure suggests that the smaller M35 CcmM isoform may assemble a pcarboxysome matrix of RuBisCO, before M58 assembly and shell re-cruitment. To assess whether CcmM isoforms from the B-ccmM-N strain had different temporal recruitment during the development of new carboxysomes, we compared the timing at which blue and green particles reached the first time point at ≥50%, 75%, and 95% of their maximum intensity in each particle track (Figure 4C). We found that, on a track-by-track basis, green particles tended to reach 50% of their maximum intensity 1.67 ± 2.74 h sooner than blue particles during the same carboxysome assembly. This difference was found to be statistically significant when tested against a hypothetical difference of zero (Wilcoxon signed-rank test p= 0.008, n= 24, error = SD). This is reflected as an increased difference between the time at 50%-max intensity of the blue signal and time at 50%-max intensity of the green signal on the plot (Figure 4C). No significant difference was found between the timing of blue and green particles reaching a point ≥75% (−0.22 ± 4.29 h) or ≥95% (−0.13 ± 3.78 h) of their maxi-mum intensities during each assembly event (Wilcoxon signed-rank test, p= 0.715 and p= 0.994, respectively, n= 24, error = SD). In 22 of 24 tracked carboxysome assemblies, automatic tracking detected
FIGURE 3: Transmission electron micrographs show the formation of carboxysomes in ∆ccmM cells complemented with fluorescently tagged ccmM. (A, 1–6) Carboxysomes (numbers and white arrows) in WT PCC7942 cells show
with a GFP-labeled copy of the large subunit of RuBisCO (RbcL-sfGFP). This strain has been previously used successfully to study RuBisCO assembly and spacing (Savage et al., 2010; Chen et al., 2013). 3D-SIM of RbcL-sfGFP (RbcL-G) showed no ringlike struc-tures, producing only solid, regularly spaced particles (Figure 5C).
To test whether M58 was in fact limited to a subshell layer, we imaged the ∆ccmM + B-ccmM-N gene complement with 3D-SIM. Both CcmM isoforms predominantly pro-duced solid objects similar to those ob-served with the RbcL-G strain (Figure 5D). Though infrequent, some large fluorescent particles with minor dips of intensity near their centers were observed by eye when imaging both isoforms (Figure 6, D and E). These qualitative results suggested that the tagged M58 isoform of CcmM was not sig-nificantly excluded from integration into the carboxysome core as would be expected if the protein was only present as a thin layer just beneath the exterior shell. To check that variations in signal intensity between experi-ments and cyanobacterial strains did not lead to poor signal-to-noise ratios and con-sequent artifacts, we verified the reconstruc-tion quality of each 3D-SIM data set by the reconstructed intensity histogram (RIH) score from the SIMcheck ImageJ plug-in (Ball et al., 2015). RIH scores for all condi-tions and data sets were of similar quality (Supplemental Table S1).
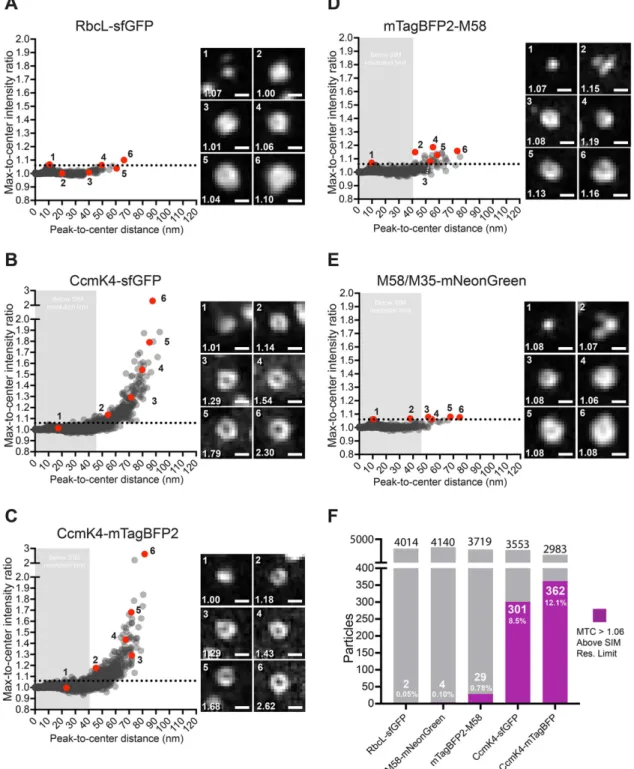
We developed an automated image analysis pipeline and a metric to quantify the degree to which fluorescently labeled pro-teins were localized at the perimeter of the carboxysome versus uniformly distributed throughout the matrix. The max-to-center intensity (MTC) ratio is calculated for each particle as the peak intensity of a polynomial curve fitted to an interpolated average radial profile, divided by the intensity at the particle centroid. A perfectly uniform protein distri-bution would result in the peak particle in-tensity near that of the particle centroid and yield an MTC ratio of ∼1. Higher MTC values result from particles with decreased intensity at their centers, indicating a more ringlink appearance and a depletion of fluorescently labeled protein closer to the particle center (Figure 6). An estimate of particle size was calculated for each analyzed particle by taking the distance from the particle cen-troid to the peak intensity of the polynomial function fitted to the average radial profile. For objects with peak fluorescence at their centroid, this distance is 0. It should be noted that the “true” size of solid objects measured by the centroid-to-peak metric
FIGURE 4: CcmM isoforms coassemble at the site of new carboxysomes. (A) Merged montage of carboxysome biogenesis in the ∆ccmM + B-ccmM-N gene complement strain shows simultaneous colocalization of both blue (mTagBFP2-M58) and green (M58-mNeonGreen/M35-mNeonGreen) particles. White arrows indicate the new carboxysome. White asterisk indicates the parent carboxysome. (B) Plot of carboxysome assembly times. Particle tracking during carboxysome assembly was used to determine changes in normalized blue and green particle intensities during assembly. Plots represent the time from the first point at which mTagBFP2 (BFP) and mNeonGreen (mNG) particle intensities were ≥50% to the point ≥95%. (C) Plot of temporal differences between normalized BFP and mNG intensities during carboxysome assembly. Plot depicts the difference in hours it took BFP and mNG particles to reach 50%, 75%, and 95% of their maximum intensity
during a specific assembly event. Spots are color coded by carboxysome assembly event. Gray triangles correspond to the assembly event depicted in A. Gray diamonds
on the Abbe resolution criterion for each fluorescent tag, below which we would not expect 3D-SIM to resolve even a “true” ring-like object (see Materials and Methods). Dif-fraction-limited peak-to-center distances were defined as 44.89, 45.51, and 39.96 nm for sfGFP, mNeonGreen, and mTagBFP2, re-spectively (Figure 6, shaded areas).
Analysis of variance (ANOVA) testing confirmed that mean MTC values were sig-nificantly heterogeneous between all the labeled carboxysome proteins (Welch’s ANOVA, F4, 8302.6= 103.90, p < 0.001). A
Games-Howell test with qcritical (k= 5, df= ∞, α = 0.001) = 5.484 was then used to make further pairwise comparisons of la-beled carboxysome protein MTC values (Supplemental Table S2). This automated analysis of RbcL-G and CcmK4-sfGFP (K4-G) images confirmed our initial observa-tions that carboxysomes appear funda-mentally different between these strains (Games-Howell test, MD = 0.02, q= 17.65); similar results were obtained from the com-parison of RbcL-G and CcmK4-mTagBFP2 (K4-B) (Games-Howell test, MD = 0.02, q= 21.09). RbcL-G particles had an average MTC ratio of 1.008 ± 0.011, with a maxi-mum MTC ratio of 1.10 (n= 4014, error = SD). An upper MTC ratio threshold was set at 1.06, which is the 99.9th percentile of the RbcL-G MTC ratio scores, below which objects are more likely to be uniform and non-ringlike. This threshold is denoted on MTC ratio versus peak-to-center distance plots as a horizontal dotted line (Figure 6). Particles with MTC ratios greater than 1.06 were only counted as rings if the distance from centroid to the point of maximum in-tensity was greater than the fluorophore-specific 3D-SIM resolution limit. We found that a subset of carboxysomes with MTC >1.06 were measured with peak-to-center distances below the theoretical 3D-SIM resolution limit in both K4-G cells (14 sub-resolution rings) and K4-B cells (29 subres-olution rings). Manual inspection of these subresolution rings revealed that they fre-quently had misidentified centroids, often due to rotationally asymmetrical fluores-cence intensity (Supplemental Figure S3). Centroid misidentification may result in un-derestimation of particle size, as the cen-troid will be called inappropriately close to the point of maximum intensity in the par-ticle average radial profile. While subreso-lution rings were not counted as true rings, their measured sizes were on average very near their respective 3D-SIM resolution lim-its. K4-G subresolution rings had an average radius of 41.1 ± 4.5 nm, near the 44.89 nm limit (n= 14, error = SD). Similarly, K4-B subresolution rings had an average radius of 35.0 ± 4.8 nm, which would likely be underestimated, but their ringlike character would
not be. Because the theoretical 3D-SIM resolution limit depends on fluorophore wavelength, particle size cutoffs were calculated based
able to resolve rings very near the ∼110-nm theoretical lateral res-olution limit of 3D-SIM (at 520-nm wavelength; Gustafsson, 2000; Gustafssonet al., 2008) and can reliably resolve fluorescent points less than 200 nm apart, which is well below the average diameter is near the mTagBFP2 resolution limit of 39.96 nm (n= 29, error =
SD). On the basis of the small number of subresolution rings, their close proximity to the 3D-SIM resolution limit, and the marked in-creased in MTC scores past this limit, we conclude that we were
predominantly solid, like those observed in the strain with labeled RuBisCO.
DISCUSSION
Dual fluorescent tagging of CcmM alters relative isoform abundance
The dual-fusion B-ccmM-N transgene effectively produced both long and short CcmM isoforms. Though M35 remained more abundant than M58, we observed a reduced level of M35 expres-sion in the transgenic line relative to levels in WT cells. It is important to note that this change in the relative amount of each isoform may have had an impact on the assembly and structure of the carboxysomes produced in these cells, as suggested by their larger average size. It is possible that a more equivalent ratio of M35 to M58 may result in a situation in which the cell must use more M58 to organize the internal RuBisCO matrix than it would under normal conditions. Despite this change in isoform ratio, tagged CcmM iso-forms can still assemble functional carboxysomes that support growth at atmospheric levels of CO2. If internal protein organization
is significantly abnormal in carboxysomes of these cells, their rela-tively normal functionality suggests that the carboxysome structure is highly flexible to changes in CcmM abundance. This raises the question of to what extent CcmM isoform expression may regulate carboxysome size, number, and internal protein organization.
The carboxysome can support the addition of large foreign proteins via direct fusion to CcmM
The function of CcmM and other components of the carboxysome are robust to the addition of large protein fusions, further support-ing a taggsupport-ing strategy as a means to localize foreign cargo to the carboxysome for engineering applications. Previous work has shown that tagged CcmM gene complements can rescue the HCR pheno-type of CcmM mutants without significant impairment of carboxy-some function compared with WT cells (Long et al., 2010; Cameron et al., 2013). We find that such complementation is also possible when fluorescent tags are fused to both ends of CcmM, significantly increasing the size of both the M58 and M35 isoforms. These results suggest that heterologous proteins could be simultaneously fused to multiple loci in the matrix, opening the door for localizing multi-part enzymatic pathways inside the carboxysome.
M35 and M58 assemble simultaneously during early carboxysome biogenesis in the dual-fusion CcmM strain
M35 has been hypothesized to coordinate the organized paracrys-talline cargo assembly of RuBisCO, with M58 limited to a peripheral subshell layer (Long et al., 2007, 2010, 2011; Cot et al., 2008; Rae et al., 2013). Current models of carboxysome biogenesis have pro-posed a primarily cargo-centric assembly pathway, in which RuBisCO and internal structural components form before shell encapsulation (Cameron et al., 2013; Chen et al., 2013). On the basis of fluores-cence recovery after photobleaching imaging of carboxysomes that suggests matrix components are relatively static (Chen et al., 2013), we hypothesized that M35 would be present in pre-carboxysome assemblies before M58, with M58 appearing later during shell for-mation. Indeed, we do observe a significant difference in fluoro-phore dynamics early on in carboxysome assembly, with mTagBFP2 fluorescence, specific to the long M58 isoform, accumulating more slowly than that of mNeonGreen. This difference becomes insignifi-cant later in the assembly. The slower accumulation of blue fluores-cence during carboxysome assembly in the ∆ccmM + B-ccmM-N cells, specifically marking the M58 isoform, raises the possibility that M35 may play a more central role than M58 during the initial stages of carboxysomes found in the B-ccmM-N strain as measured by
TEM (∼319 nm).
In contrast to RbcL, we found that fluorescently labeled shell pro-teins produced high MTC ratios. Compared with RbcL-G, K4-G par-ticles had a significantly greater average MTC ratio of 1.023 ± 0.073 (n = 3553, error = SD; Figure 6B). In cells with K4-G– labeled carboxysomes 8.5% (301 of 3553) of particles had MTC ratios >1.06 above the sfGFP 3D-SIM resolution limit, denoting a decrease in fluorescently labeled protein toward the particle center (Figure 6F). This was also true for cells with K4-B–labeled carboxysomes, which produced particles with a significantly different mean MTC ratio of 1.030 ± 0.080 compared with RbcL-G (n= 2983, error = SD; Figure 6C). In the K4-B strain, 12.1% of particles (362 of 2983) had MTC scores >1.06 and had measured radii above the mTagBFP2 3D-SIM resolution limit.
The mean MTC ratios of labeled carboxysomes in K4-B and K4-G cells were also found to be significantly different (Games-Howell test, α = 0.01, MD = 0.007, q= 4.884). This corresponded to a greater number of rings identified in K4-B cells compared with K4-G (12.1% vs. 8.5%, respectively). This difference may be the result of an improvement in resolution due to the shorter wave-length of blue versus green fluorophores (Figure 6F). Together the comparative analysis of carboxysomes with fluorescently labeled RbcL or CcmK4 shell proteins verified that 3D-SIM could resolve the carboxysome shell as a hollow ring and that such rings were absent in cells with fluorescently labeled RuBisCO.
Analysis of the ∆ccmM + B-ccmM-N gene complement identi-fied a small number of fluorescently tagged M58 particles as ringlike (Figure 6D). Our analysis found only 0.78% (29 of 3719) of the mTag-BFP2-M58 (B-M58) particles had MTC ratios >1.06 and were above the 3D-SIM resolution limit, an ∼11-fold decrease in percent com-pared with K4-G and a 16-fold decrease comcom-pared with K4-B, with an average MTC ratio of 1.009 ± 0.014 (p < 0.01, error = SD; Figure 6D). We found a significant difference in the MTC ratios of B-M58 particles versus both shell-labeled K4-B (Games-Howell test, MD = 0.020, q= 19.49) and K4-G (Games-Howell test, MD = 0.014, q= 15.74). This supported qualitative observations that particles of the labeled M58 strain did not appear as ringlike as those in the strains with labeled carboxysome shells.
The maximum MTC score found in B-M58 particles was only 1.19 compared with 2.30 in K4-G and 2.62 in K4-B particles. In fact, 37% of K4-G and 27% of K4-B ringlike particles (MTC >1.06) were scored above the max B-M58 score. B-M58 particles also had significantly different MTC ratios compared with RbcL-G particles (Games-Howell test, MD = 0.002, q= 7.49). Taken together, these test results indicate that, though B-M58–labeled carboxysomes have a small number of MTC ratios ≥1.06 with radii above the 3D-SIM resolution limit, and thus have resolvable dips of intensity to-ward their centers, this dip is frequently not as large as that of many (∼30%) shell-labeled carboxysomes.
nantly as solid objects, with only a minor population (0.8%) showing dips in fluorescence intensity at their centers. Consequently we do not find strong evidence by superresolution microscopy to support a model of carboxysome structure in which M58 is strictly excluded from the carboxysome core, suggesting that the internal carboxy-some structure contains a mixed population of both M35 and M58 coordinating with RuBisCO. We cannot rule out, however, the pos-sibility that there are distinct layers of M35 and M58 deeper within the carboxysome interior, below the 3D-SIM resolution limit. Fur-thermore, because there is strong evidence indicating that M58 is required to directly recruit shell proteins, it may likely be locally en-riched near the shell. Such enrichment would not have been detect-able with the experimental design we employed in this study. While it is also possible that fluorescently tagging these proteins may per-turb their natural organization, the lack of a major growth defect in our tagged strain suggests that, if there are differences in organiza-tion, they are not essential to carboxysome function.
Though 3D-SIM provides lateral and axial resolution doubling, our method does have its limitations. Like conventional microscopy, axial resolution in 3D-SIM is worse than lateral resolution. Carboxysomes are three-dimensional icosahedra with a diameter (∼200 nm) that is above the lateral 3D-SIM resolution limit (∼110 nm) but below the axial resolution limit (∼340 nm). Thus we would expect slightly decreased contrast, noisier measurements, and reduced ability to resolve the true “dip” in intensity in the hollow interior of a carboxy-some than with a true two-dimensional ring of fluorescence. In our method, we averaged radial intensities across five 0.5-pixel subsam-pled z-planes around the centroid and then took an average of these when analyzing particle intensity. While increasing the robustness of the method, this may have also increased the minimum resolvable shell diameter. Nonetheless, the effective resolution of this method was sufficient to demonstrate differences in distribution of CcmK4, RuBisCO, M58, and M35. Even with the limitations of 3D-SIM, we have demonstrated that this technique, coupled with computational analysis, can provide a powerful tool for studying protein organization in large multi-protein structures. The finding that M58 may be present throughout the carboxysome core raises questions about the compart-ment’s internal structure. For example, CcmM has been reported to interact with other carboxysome components (such as CcaA, CcmN, and CcmK) in yeast two-hybrid and pull-down experiments (Long et al., 2007; Cot et al., 2008; Kinney et al., 2012), although the strength of these interactions is unknown. CcmN is essential for shell recruit-ment and assembly (Kinney et al., 2012) and thus is thought to localize at the carboxy-some periphery (Rae et al., 2013). In addi-tion, crystal structures of CcmM from Ther-mosynechococcus elongatus have revealed a homotrimer complex (Peña et al., 2010). Thus CcmM may be involved in multiple structural and functional roles throughout the carboxysome (Figure 7).
Our findings also raise new questions about the structure and biogenesis of car-boxysomes. For example, M58 is thought to play a role in recruitment of shell compo-nents (Cot et al., 2008; Long et al., 2011; Kinney et al., 2012; Cameron et al., 2013). of RuBisCO organization. However, mNeonGreen was detected
only before mTagBFP2 in 2 of 24 analyzed carboxysome assemblies, despite mNeonGreen having higher particle intensities. Thus, within the temporal limitations of this experiment it is unlikely that the ob-served difference in accumulation rates is representative of M35 co-ordinating early carboxysome assembly in the absence of M58. Rather, because both isoforms appear to always be present together to some degree, it is more likely that a faster accumulation of green fluorescence is due to both long and short mNeonGreen-labeled isoforms assembling simultaneously. Consequently, though these findings do not directly contradict the current models of carboxy-some assembly, in which cargo-centric assembly is driven by M35, these experiments suggest that both M35 and M58 are integrally involved in the structuring of the internal matrix during carboxy-some assembly. Assuming that the carboxycarboxy-some core grows by ad-dition of material to the outside of a stable paracrystalline RuBisCO assembly (Chen et al., 2013), these results also suggest that M58 does not assemble as a separate layer around a preexisting M35/ RuBisCO core.
M58 is not exclusive to a subshell layer in the ∆ccmM,
mTagBFP2-ccmM-mNeonGreen strain
The 3D-SIM experiments and quantitative analysis do not support a model of carboxysome internal structure in which M58 is exclusively limited to a subshell localization. The preexisting model described earlier proposes that M58 is not present within the primary M35-RuBisCO matrix. This is logical, because M35, which does not con-tain the N-terminal domain, presumably can achieve denser packing of RuBisCO enzymes.
We expected that, if M58 was in fact limited to a subshell layer ∼5–6 nm beneath the outer surface, it would appear as a ring, similar to CcmK4, by 3D-SIM (Kaneko et al., 2006). While 3D-SIM imaging of CcmK4 did reveal the expected ringlike distribution, carboxy-somes with fluorescently labeled M58 (B-M58) appeared
predomi-FIGURE 7: Model of possible structural and functional roles of CcmM in the S. elongatus
shaking at 150 rpm in an INFORS Multitron 2 incubator, which fea-tures digital CO2 control. WT 7942 and knockout complements were grown with ambient air conditions. Mutant ∆ccmM::HygR cultures were supplemented with 2% CO2 flowed through the incubator headspace and 25 µg/ml hygromycin B. Strains with fluo-rescently labeled carboxysome components, carrying kanamycin or spectinomycin resistance genes, were grown with 25 µg/ml kanamy-cin or 25 µg/ml spectinomykanamy-cin, respectively. For the CcmM comple-ment strain, ∆ccmM + B-ccmM-N, cultures were grown with 5 µg/ml kanamycin and 25 µg/ml hygromycin B. For growth-curve experi-ments, biological replicates were made by isolating colonies grown on BG11 agar with 1 g/l HEPES, 50 mM HCO3−, and 1 mM Na
2S2O3.
Two independent growth experiments were performed starting on different days, with three replicates in each experiment for a total of six biological replicates. One replicate of WT 7942 grown in 2% CO2
group was excluded due to significant evaporation in the culture. Isolates were screened by PCR to confirm the presence or absence of the WT ccmM gene. Growth-curve cultures were prepared by washing starter cultures in fresh BG11 pH 8.5 media, then diluting to OD750 of ∼0.1 in 40 ml BG11 in 250-ml flat-bottom flasks. To calcu-late approximate strain-doubling times (d), we used the formula d=t * log 2 / (log ODf / log ODo) with OD750 measurements from 0 to 18 h. A log transformation of growth data verified that measure-ments at these times were approximately linear with later time points, indicating these were not in a lag phase of growth (Supple-mental Figure S4).
Image acquisition
For both conventional fluorescence and 3D-SIM experiments, 5 µl of either mid-log cells (OD750= 1–2) for time-lapse experiments or early-log cells (OD750= 0.5–1.2) for 3D-SIM were spotted on 2%
agarose BG11 pads. Agarose pads were placed sample-side down in MatTek 35-mm glass-bottom microwell dishes with No. 1.5 cover-slips. Sterile water was spotted within the dish to mitigate dehydra-tion of the agarose pad, and the dish was sealed with parafilm. Though strains expressing labeled CcmM were under the control of the IPTG-inducible promoter Ptrc, no induction was used with these cells due to adequate basal expression. Cells expressing RbcL-G were imaged on BG11 agarose pads with the addition of 50 µM IPTG following previously reported protocols (Savage et al., 2010). 3D-SIM of uninduced RbcL-G cells also produced solid particles, but these were not as bright as those seen with induced cells and pro-duced several false positives in our analysis pipeline (Supplemental Figure S5). For time-lapse experiments, samples were recovered for more than 1 h at 34–35°C, under ∼1000 lm/m2, and in ambient air before being imaged using a Nikon TE2000 and a 100× oil objec-tive. Cells were kept at 30°C under ∼800 lm/m2 light intensity during time lapse and imaged every 10 min.
The 3D-SIM data were collected on a DeltaVision OMX V4 Blaze system (GE Healthcare) equipped with a 60×/1.42 NA Plan-Apo oil-immersion objective lens (Olympus) and three Edge 5.5 sCMOS cameras (PCO). mTagBFP2 fluorescence was excited with a 405-nm laser and collected with a 477/35 emission filter, mNeonGreen with a 514-nm laser and 541/22 emission filter, and sfGFP with a 488-nm laser and a 528/48 emission filter. z-Stacks of ∼2 microns were acquired with a z-step of 125 nm and with 15 raw images per plane (five phases, three angles). Spherical aber-ration was minimized using immersion-oil matching (Hiraoka et al., 1990). Superresolution images were computationally recon-structed from the raw data sets with a channel-specific measured optical transfer function and a Wiener filter constant of 0.001 us-ing Compute Unified Device Architecture (CUDA) accelerated However, shell proteins are recruited to carboxysomes only late in
their assembly process (Chen et al., 2013). Therefore, if M58 is present even at the early stages of carboxysome assembly, other factors must be responsible for delaying shell recruitment. Further-more, as our data indicate that CcmM58 is present deep within the carboxysome, it is possible that this protein is interacting with the CA CcaA throughout the internal matrix of RuBisCO (Figure 7D). The nature of these factors is a promising avenue for future work.
MATERIALS AND METHODS
Western blot analysis
For SDS–PAGE, log-phase (OD750= 1.0) cultures of cyanobacterial strains were pelleted and frozen at −20°C. Frozen pellets were thawed in B-PER Bacterial Protein Extraction Reagent (ThermoSci-entific), without DNase or Lysozyme, and normalized by wet pellet mass. Resuspended cells were mixed directly with SDS loading buf-fer and boiled. Boiled samples were run on a 4–20% Tris-glycine NuPAGE gel (Invitrogen) at 120 V. SDS–PAGE–separated proteins were transferred to a nitrocellulose membrane with an iBlot2 trans-fer device (ThermoScientific).
The membrane was blocked with 5% skim milk in TBST (50 mM Tris, 150 mM NaCl, 0.1% Tween 20), then probed with 1:10,000 of anti-CcmM primary antibody (serum derived from rabbit, a gift of Ben Long, Australian National University), followed by a horseradish per-oxidase–conjugated goat anti-rabbit secondary antibody (Agrisera AS09 602). The membrane was incubated with SuperSignal West Dura Extended Duration chemiluminescent substrate (ThermoScien-tific) and imaged with the Bio-Rad ChemiDoc system.
Western blotting for CcmM in WT, mutant, and transgenic cya-nobacterial strain was replicated in two separate experiments, per-formed on different days, with independently collected culture samples (Supplemental Figure S1).
TEM
For TEM experiments, mid–log cultures (1 ml) were pelleted (6000 rpm, 5 min) and concentrated 2× in sterile dH2O. The cells were then mixed 1:1 with fixative (1.25% formaldehyde, 2.5% glutaralde-hyde, 0.03% picric acid, 0.1 M sodium cacodylate buffer, pH 7.4), incubated at room temperature for 30 min, and then pelleted and stored in fixative at 4°C overnight. Fixed cells were embedded in Epon resin and cut into ultrathin sections (∼60–80 nm). Sections were stained with uranyl acetate and lead citrate, then imaged on a Tecnai G2 Spirit Bio TWIN TEM.
Carboxysome diameter was measured manually in ImageJ. For estimating how a section thickness less than the width of a typical carboxysome would influence this measurement, a model distribu-tion of carboxysome diameter was generated. A theoretical sample of 50 objects with diameters between 150 and 250 nm were gener-ated. The observed widths of these objects were calculated based on randomly selected points, representing a slice through a car-boxysome, that were less than or equal to each object’s full diame-ter. This point was then used to calculate the measured width of the object slice. Measurements less than 100 nm were judged to be too small to have been considered true carboxysomes in the TEM data and were excluded from the model.
Cell culture
frame gap of 2. Tracks were manually checked for gaps and incor-rect splitting. False splits and gaps were manually corincor-rected. Par-ticle tracks were corrected for photobleaching by dividing intensi-ties by an average of seven reference particles, normalized to the first frame of the time lapse, in each channel. Reference particles were objects observed to be relatively stable compared with par-ticles that lost or gained fluorescence due to carboxysome bio-genesis. The same reference particles were used for correction in both channels. Bleach-corrected tracks were normalized to their maximum intensity. To quantify and compare differences in assem-bly dynamics between blue and green fluorescence signals, we selected reference points at 50%, 75%, and 95% of maximum in-tensity for each fluorophore in each assembly track. The percent assembly reference point was selected as the first point in the track that was greater than or equal to that reference point. Tracks that began with intensities greater than 50% of their maximum intensity in either channel were judged to be incomplete or false-assembly events and were discarded. For generation of the time-lapse montage, brightness and contrast values were manu-ally adjusted separately in each channel to enhance visibility in the figure.
Cloning and strain construction
Plasmids used for S. elongatus strain construction were made by Gibson assembly and sequence verified. Tagged CcmM plasmids were cloned by inserting the ccmM gene, along with mNeonGreen and mTagBFP2 coding sequences with additional flexible linker se-quences, into the previously described pDFS21 neutral site II (NS2) integration plasmid downstream of the IPTG-inducible Ptrc pro-moter (Savage et al., 2010). The ccmM gene was obtained directly from the S. elongatus PCC7942 genome via PCR with Phusion poly-merase (NEB). The ccmK4 gene for cloning shell fusion plasmids was obtained as a synthesized gBlock (IDT) and cloned into the pDFS21 integration plasmid (Supplemental Tables S3 and S4). An-notated plasmid sequences have been provided as Supplemental Files.
The S. elongatus strains were transformed with integration plas-mids by incubating approximately fivefold concentrated OD750 1–2 culture with 10–100 ng plasmid at 30°C in the dark overnight; this was followed by plating of transformants on selective BG11 agar (Clerico et al., 2007). The mutant ∆ccmM strain was made by integrating a hygromycin B resistance gene into the native ccmM ORF; this was followed by selective plating and screening (Sachdeva, 2014). 3D-SIM reconstruction code based on Gustafsson et al. (2008).
TetraSpeck beads (Thermo Fisher) or a nano-grid control slide were used to measure axial and lateral chromatic misregistration, and multichannel data sets were registered using the image reg-istration function in softWoRx. The 3D-SIM data sets of each strain used for quantitative analysis were acquired in two independent experiments that were performed with samples prepared on dif-ferent days.
Image analysis
3D-SIM data sets were imported into MATLAB (MathWorks) using the bioformats reader, followed by thresholding and background subtraction. The threshold value was empirically determined and assessed by visualizing the resultant centroid position and mask in MATLAB and Imaris (Bitplane AG), respectively. Segmented objects were further analyzed if they met a cutoff for volume, surface area, sphericity, major–minor axis ratio, and mean radius.
We calculated the MTC (max to center) ratio for each object. From the centroid, the radially averaged intensity for each sub-sampled (0.5 pixels) radius was measured. This was done at the particle centroid and one 0.5-pixel subsampled z-plane above and below for five total planes. Radial profiles were averaged across z-planes. A polynomial curve was fitted to the averaged radial pro-file of each segmented object in MATLAB. The most suitable poly-nomial fit (up to sixth order) was selected based on meeting the Bayesian information criterion. Then the first and second deriva-tives of each fitted curve were calculated to find the root with the global maximum. The intensity at this root was calculated and di-vided by the intensity at the centroid to obtain particle MTC ratios. An estimation of particle size was also made by taking the distance from the global max of the fitted polynomial to the particle troid. For subdiffraction objects with peak intensities at their cen-ters, this resulted in a distance of 0 nm. After polynomial fitting, a small number of particles (<0.4%) in each strain were calculated to have MTC ratios <0.4. While many particles have MTC ratios be-tween 0.9 and 1, these were the only ones found to have scores less than 0.9. Visual analysis revealed that these were artifacts of curve fitting in which small local maxima were generated that fell well below the particle centroid intensity. All particles with MTC <0.4 had MTC ratios of 1 when the max of the initial averaged ra-dial profile was used instead of the fitted polynomial. To correct for this, these particles were forced to an MTC ratio of 1.0 with a dis-tance to peak intensity of 0. Importantly, complete exclusion of these particles does not alter our conclusions or the statistical test results. The 3D-SIM resolution limits were calculated for each fluo-rophore using the Abbe criterion divided by a factor of 2 to ac-count for the twofold increase in lateral resolution with 3D-SIM: (0.5 ×λem)/(2 × NA1.42) (λem = emission wavelength, NA = numeri-cal aperture; Pédelacq et al., 2006; Oksana et al., 2011; Shaner et al., 2013).
Time-lapse data of ∆ccmM + B-ccmM-N were processed with ImageJ (FIJI) (Schindelin et al., 2012). Time-lapse data from two sequential acquisitions of the same field of view were imported into FIJI with the Bio-Formats Import plug-in with autoscaling, concatenated, and separated by channel. Channels were regis-tered using rigid registration in the StackReg FIJI plug-in, then background subtracted with a 50-pixel-radius rolling ball. Particle tracking was performed in FIJI with the TrackMate plug-in using the LoG detector (Laplacian of Gaussian filter) with 0.5-µm esti-mated blob diameter, 0.5 threshold, and subpixel localization (Tinevez et al., 2017). Tracks were generated with a maximum link-age and gap-closing distances of 0.5 µm and with a maximum
ACKNOWLEDGMENTS
REFERENCES
Andersson I, Backlund A (2008). Structure and function of Rubisco. Plant Physio Biochem 46, 275–291.
Badger MR, Price GD (2003). CO2 concentrating mechanisms in cyanobac-teria: molecular components, their diversity and evolution. J Exp Bot 54, 609–622.
Ball G, Demmerle J, Kaufmann R, Davis I, Dobbie IM, Schermelleh L (2015). SIMcheck: a toolbox for successful super-resolution structured illumina-tion microscopy. Sci Rep 5, 15915.
Cameron JC, Wilson SC, Bernstein SL, Kerfeld CA (2013). Biogenesis of a bacterial organelle: the carboxysome assembly pathway. Cell 155, 1131–1140.
Chen AH, Robinson-Mosher A, Savage DF, Silver PA, Polka JK (2013). The bacterial carbon-fixing organelle is formed by shell envelopment of preassembled cargo. PLoS ONE 8, e76127.
Clerico EM, Ditty JL, Golden SS (2007). Specialized techniques for site-directed mutagenesis in cyanobacteria. Methods Mol Biol 362, 155–171.
Cot SS, So AK, Espie GS (2008). A multiprotein bicarbonate dehydration complex essential to carboxysome function in cyanobacteria. J Bacteriol 190, 936–945.
Gustafsson MGL (2000). Surpassing the lateral resolution limit by a fac-tor of two using structured illumination microscopy. J Microsc 198, 282–87.
Gustafsson MGL, Shao L, Carlton PM, Wang CJR, Golubovskaya IN, Cande WZ, Agard DA, Sedat JW (2008). Three-dimensional resolution dou-bling in wide-field fluorescence microscopy by structured illumination. Biophys J 94, 4957–4970.
Hiraoka Y, Sedat JW, Agard DA (1990). Determination of three-dimensional imaging properties of a light microscope system. Partial confocal behavior in epifluorescence microscopy. Biophys J 57, 325–333. Kaneko Y, Danev R, Nagayama K, Nakamoto H (2006). Intact carboxysomes
in cyanobacterial cell visualized by Hilbert differential contrast transmis-sion electron microscopy. J Bacteriol 188, 805–808.
Kerfeld CA, Melnicki MR (2016). Assembly, function and evolution of cyanobacterial carboxysomes. Curr Opin Plant Biol 32, 66–75.
Kinney JN, Salmeen A, Cai F, Kerfeld CA (2012). Elucidating essential role of conserved carboxysomal protein CcmN reveals common feature of bacterial microcompartment assembly. J Biol Chem 287, 17729– 17736.
Long BM, Murray BR, Whitney SM, Price GD (2007). Analysis of car-boxysomes from Synechococcus PCC7942 reveals multiple Rubisco complexes with carboxysomal proteins CcmM and CcaA. J Biol Chem 282, 29323–29335.
Long BM, Rae BD, Badger MR, Price GD (2011). Over-expression of the β-carboxysomal CcmM protein in Synechococcus PCC7942 reveals a tight co-regulation of carboxysomal carbonic anhydrase (CcaA) and M58 content. Photosynth Res 109, 33–45.
Long BM, Tucker L, Badger MR, Price GD (2010). Functional cyanobacterial β-carboxysomes have an absolute requirement for both long and short forms of the CcmM protein. Plant Physiol 153, 285–293.
Oksana MS, Cranfill PJ, Davidson MW, Verkhusha VV (2011). An enhanced monomeric blue fluorescent protein with the high chemical stability of the chromophore. PLoS ONE 6, e28674.
Pédelacq JD, Cabantous S, Trans T, Terwilliger TC, Waldo GS (2006). Engineering and characterization of a superfolder green fluorescent protein. Nat Biotech 24, 79–88.
Peña KL, Castel SE, Araujo C, Espie GS, Kimber MS (2010). Structural basis of the oxidative activation of the carboxysomal γ-carbonic anhydrase. CcmM. Proc Natl Acad Sci USA 107, 2455–2460.
Price GD, Howitt SM, Harrison K, Badger MR (1993). Analysis of a genomic DNA region from the cyanobacterium Synechococcus sp. Strain PCC7942 involved in carboxysome assembly and function. J Bacteriol 175, 2871–2879.
Rae BD, Long BM, Badger MR, Price GD (2012). Structural determinants of the outershell of β-carboxysomes in Synechococcus elongatus PCC7942: roles for CcmK2, K3-K4, CcmO, and CcmL. PLoS ONE 7, e43871. Rae BD, Long BM, Badger MR, Price GD (2013). Functions, compositions,
and evolution of the two types of carboxysomes: polyhedral micro-compartments that facilitate CO2 fixation in cyanobacteria and some proteobacteria. Microbiol Mol Biol Rev 77, 357–379.
Sachdeva G (2014). Controlling Fluxes for Microbial Metabolic Engineering. Doctoral Dissertation. Cambridge, MA: Harvard University.
Savage DF, Afonso B, Chen AH, Silver PA (2010). Spatially ordered dynamics of the bacterial carbon fixation machinery. Science 327, 1258–1261. Schindelin J, Arganda-Carreras I, Frise E, Kaynig V, Longair M, Pietzsch T,
Preibisch S, Rueden C, Saalfeld S, Schmid B, et al. (2012). Fiji: an open-source platform for biological-image analysis. Nat Methods 9, 676–682. Shaner NC, Lambert GG, Chammas A, Ni Y, Cranfill PJ, Baird MA, Sell
BR, Allen JR, Day RN, Israelsson M, et al. (2013). A bright monomeric green fluorescent protein derived from Branchiostoma lanceolatum. Nat Methods 10, 407–409.
Tinevez JY, Perry N, Schindelin J, Hoopes GM, Reynolds GD, Laplantine E, Bednarek SY, Shorte SL, Eliceiri KW (2017). TrackMate: an open and extensible platform for single-particle tracking. Methods 115, 80–90. Woodger FJ, Badger MR, Price GD (2005). Sensing of inorganic carbon