202
EFFECT OF TOTAL AND PARTIAL SUBSTITUTION OF SODIUM
CHLORIDE ON THE ORGANOLEPTIC PROPERTIES OF CIRCASSIAN
CHEESE
YELIZ PARLAK1*, NURAY GÜZELER2
1 Sakarya University, Pamukova Vocational School, Pamukova, Sakarya, Turkey 2 Cukurova University, Faculty of Agriculture, Department of Food Engineering, Adana, Turkey *Corresponding author, e-mail: [email protected]
Keywords: Circassian cheese, Substitute salt, Sensory properties
ABSTRACT
In this study, Circassian cheeses were manufactured using %100 NaCl, %25 CaCl2/%75 NaCl, %25 KCl/%75 NaCl, %50 KCl/%50 NaCl, %25 MgCl2 / %75 NaCl rates
by salt substitues and stored for 90 days in vacuum package. A panelist group of 7 persons was formed for sensory evaluation of Circassian cheese samples. Colour and appearance, mass and structure, odour, taste, salinity level and general acceptability properties were evaluated.
The use of different salts did not affect colour and appearance, odour and saltiness points. The general acceptability scores of salted cheese samples by sodium chloride substitution with calsium chloride found to be lower than other Circassian cheese samples. The general acceptability scores of cheeses salted partially replacing sodium chloride with potassium chloride were similar to the control group. During the storage period, the most appreciated cheese were Circassian cheese which was salted by replacing with 50% KCl/50%NaCl.
INTRODUCTION
Circassian cheese is known in different countries like Turkey, Jordan, Israel, Syria, Cyprus, Iraq, Kosovo, Lebanon. Circassians introduced Circassian cheese,part of their culture, to the countries they emigrated from the their homeland Caucasus (Guneser and Yuceer, 2011; Dervısoglu et al., 2012). Circassian cheese is an acid coagulated cheese and traditionally produced in a fresh, sun-dried or smoked. This cheese can be made from cow, goat, buffalo or sheep’s milk or it can be processed out of a mixture of these milk (Guzeler and Parlak, 2010).
203
The principle objective of this paper is to determine and compare proteolytic properties in Circassian cheeses made with the mixtures of NaCl and KCl, CaCl2 and MgCl2
to that of cheese made with NaCl (control).
MATERIALS AND METHODS
Circassian cheese was produced at Gunes Milk Food Ltd. Company in Turkey. Clarified raw milk was pasteurized at 85 °C/ 15-20 sec. The temperature of milk raised from 83 °C to 95 ºC in the coagulation tank. Sour whey remaining from the previous Circassian cheese production was added to milk which has a pH in the range 3-4 acidity. Thus, coagulation of the milk achieved and waited until the curd was collected in the upper part of the tank. Some of the whey removed from the pan and the curd transferred into baskets by dipping these into the pan. The curd left in the basket for its liquid to be drained off and for molding. The produced cheese samples were divided into five groups. Cheese samples were salted in %14 brine. Circassian cheeses were manufactured using (A) %100 NaCl, (B) %25 CaCl2 / %75 NaCl, (C) %25 KCl / %75 NaCl, (D) %50 KCl / %50 NaCl, (E) %25 MgCl2
/ %75 NaCl rates by salt substitues and stored for 90 days in vacuum package.
A panelist group of 7 persons was formed for sensory evaluation of Circassian cheese samples. Colour and appearance, mass and structure, odour, taste, salinity level and general acceptability properties were evaluated. Sensory evaluations were made on days 1, 15, 45 and 90 of storage. The cheese samples were evaluated using a hedonic scale from 1 to 5 for colour and appearance, from 1 to 5 for mass and structure, from 1 to 5 for taste, from 1 to 5 for odour, 1 to 5 for salinity level. (Altug and Elmacı, 2011). Also the panelists ranked the cheeses according to their liking. The research was carried out in four different applications (A, B, C and D cheeses) and three replications and was arranged in accordance with the "Randomized Trial Parcel Plan". The multivariate analysis of the data was performed using the SPSS 15.0 package for Windows (SPSS Inc., Chicago, IL).
RESEARCH RESULTS
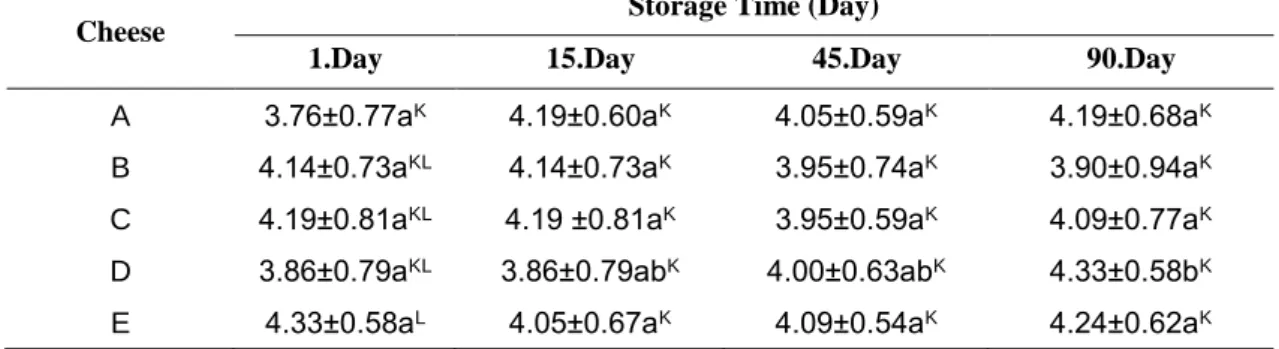
The colour and appearance scores of Circassian cheeses during 90 days of storage were given in Table 1. The effect of different substitute salts on colour and appearance scores of Circassian cheeses was determined to insignificat statistically (p>0.05). However, the use of substitute salt made a difference about colour and appearance on the first day of storage. It was thought that this difference was due to the water content of cheeses on the first day of storage.
Table 1
Colour and appearance scores of Circassian cheeses during storage
Cheese Storage Time (Day)
1.Day 15.Day 45.Day 90.Day
A 3.76±0.77aK 4.19±0.60aK 4.05±0.59aK 4.19±0.68aK
B 4.14±0.73aKL 4.14±0.73aK 3.95±0.74aK 3.90±0.94aK
C 4.19±0.81aKL 4.19 ±0.81aK 3.95±0.59aK 4.09±0.77aK
D 3.86±0.79aKL 3.86±0.79abK 4.00±0.63abK 4.33±0.58bK
E 4.33±0.58aL 4.05±0.67aK 4.09±0.54aK 4.24±0.62aK
A: NaCl, B: %25 CaCl2 / %75 NaCl, C: %25 KCl / %75 NaCl, D: %50 KCl / %50 NaCl, E: %25 MgCl2 / %75 NaCl
a, b, c: Values shown in different letters on the same line differ from each other at p <0.05 level.
K, L, M: Values shown in the same column with large different exponents differ from each other at p <0.05 level.
204
scores decreased at the cheese with B code. Depending on the increase in acidity, it was thought that the colour and appearance score decrease due to the separation of the calcium from the cheese structure. Katsiari et al. (2000) found similar results in Feta cheeses. During the storage period there was a slight decrease in colour and appearance scores of cheese samples. Low- sodium Circassian cheese samples produced by replacing with 50% NaCl by 50% KCl (4.33) became the most appreciated cheese group for colour and appearance at the end of storage. Parallel to the progress of the storage period, the colour and appearance scores of the cheese samples decreased.
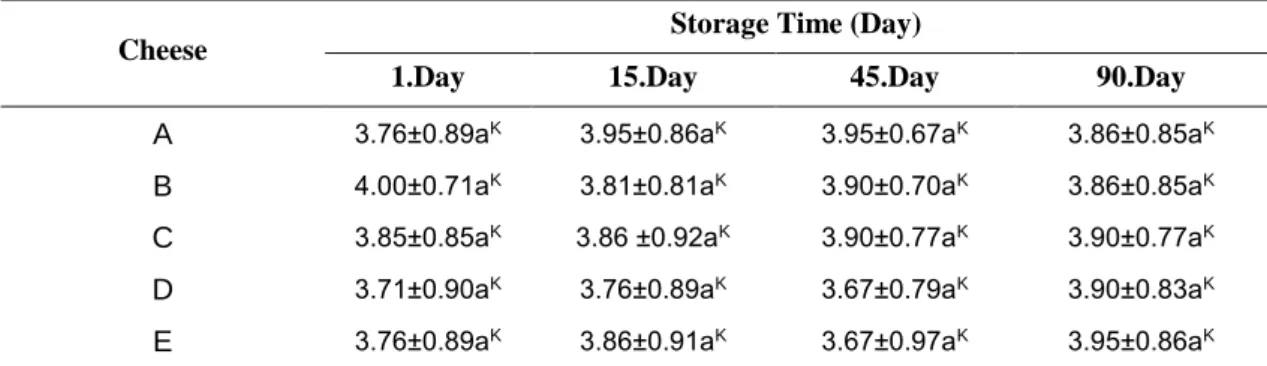
The odor scores of cheeses during 90 days of storage time were given in Table 2. The effect of substitute salt usage and storage time on the odor scores of Circassian cheeses was found to insignificant statistically (p>0.05). At the beginning of the storage period, the highest odor scores were given to samples containing CaCl2 (4.00), the lowest
odor scores were given to E group cheeses (3.95) at the end of the storage period.
Table 2
Odor scores of Circassian cheeses during storage
Cheese Storage Time (Day)
1.Day 15.Day 45.Day 90.Day
A 3.76±0.89aK 3.95±0.86aK 3.95±0.67aK 3.86±0.85aK
B 4.00±0.71aK 3.81±0.81aK 3.90±0.70aK 3.86±0.85aK
C 3.85±0.85aK 3.86 ±0.92aK 3.90±0.77aK 3.90±0.77aK
D 3.71±0.90aK 3.76±0.89aK 3.67±0.79aK 3.90±0.83aK
E 3.76±0.89aK 3.86±0.91aK 3.67±0.97aK 3.95±0.86aK
A: NaCl, B: %25 CaCl2 / %75 NaCl, C: %25 KCl / %75 NaCl, D: %50 KCl / %50 NaCl, E: %25 MgCl2 / %75 NaCl
a, b, c: Values shown in different letters on the same line differ from each other at p <0.05 level.
K, L, M: Values shown in the same column with large different exponents differ from each other at p <0.05 level.
The taste scores of Circassian cheeses during 90 days of storage were given in Table 3. The effect of using substitute salt on taste scores of Circassian cheeses was statistically insignificant (p> 0.05). Group B samples had the lowest taste scores and a bitter taste was observed by some panelists. Similarly, in studies conducted by Fitzgerald and Buckley (1985) and Aly (1995), were observed a bitter metallic taste in cheeses salted with substitute salts containing calcium or magnesium. Metallic bitter taste was not observed in all cheese samples. Because sodium chloride can mask some metallic chemical negative effects.
Table 3
Taste scores of Circassian cheeses during storage
Cheese
Storage Time (Day)
1.Day 15.Day 45.Day 90.Day
A 3.95±0.67aK 3.81±0.75aK 3.76±0.63aK 3.71±0.64aK
B 3.48±0.68aK 3.38±1.07aK 3.57±0.98aK 3.33±0.97aK
C 3.71±0.64aK 3.81±0.75aK 3.76±0.54aK 3.62±0.80aK
D 3.67±0.79aK 3.67±0.86aK 3.52±0.75aK 3.81±0.68aK
E 3.52±0.81aK 3.85±0.87aK 3.71±0.78aK 3.71±0.72aK
A: NaCl, B: %25 CaCl2 / %75 NaCl, C: %25 KCl / %75 NaCl, D: %50 KCl / %50 NaCl, E: %25 MgCl2 / %75 NaCl
a, b, c: Values shown in different letters on the same line differ from each other at p <0.05 level.
K, L, M: Values shown in the same column with large different exponents differ from each other at p <0.05 level.
205
The effect of storage time on taste scores of cheese samples was found statistically insignificant (p>0.05). The taste scores of cheeses salted with brine containing KCl and MgCl2 were found to be similar to control group.
Similarly, the taste scores were not different from the control group in cheeses salted with KCl/NaCl combination in the study on Cheddar cheese (Fitzgerald and Buckley, 1985). Katsiari et al. (2000) found similar results in Feta cheeses.
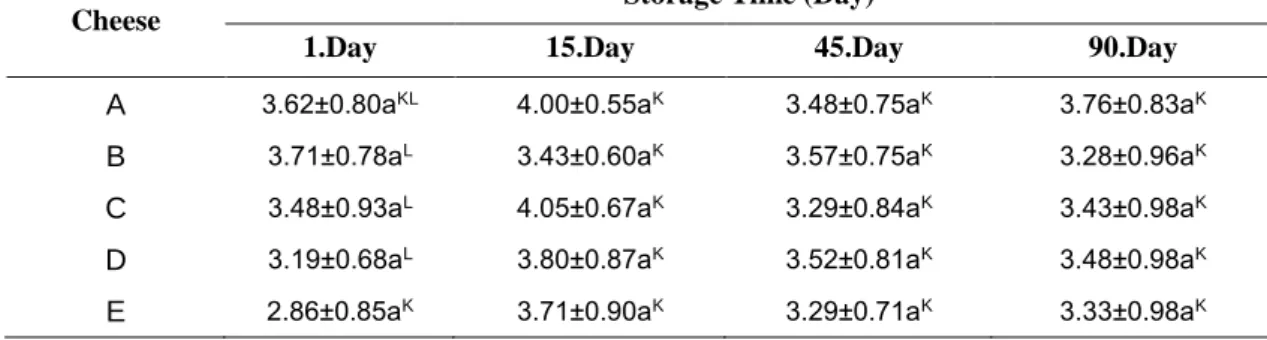
The salinity scores of cheeses during 90 days of storage time were given in Table 4. The effect of substitute salt usage and storage time on the salinity scores of Circassian cheeses was determined statistically significant (p<0.05). On the first day of the storage, the salinity scores of the control samples were different from the other groups. The salinity scores of C group cheeses varied during storage. The highest salinity scores were given to the D group cheeses (4.05) at the beginning of the storage period and to the B and D group cheeses (3.76) at the end of the storage period by the panelists.
Table 4
Salinity scores of Circassian cheeses during storage
Cheese Storage Time (Day)
1.Day 15.Day 45.Day 90.Day
A 3.38±0.86aK 3.52±0.75aK 3.57±0.75aK 3.67±0.73aK
B 3.48±1.16aKL 3.28±0.84aK 3.62±0.86aK 3.76±0.77aK
C 3.48±0.86aKL 3.09±0.70bK 3.33±0.73abK 3.62±0.74aK
D 4.05±0.86aL 3.52±0.75aK 3.52±1.06aK 3.76±0.70aK
E 3.76±0.89aKL 3.38±0.67aK 3.48±1.06aK 3.71±0.64aK
A: NaCl, B: %25 CaCl2 / %75 NaCl, C: %25 KCl / %75 NaCl, D: %50 KCl / %50 NaCl, E: %25 MgCl2 / %75 NaCl
a, b, c: Values shown in different letters on the same line differ from each other at p <0.05 level.
K, L, M: Values shown in the same column with large different exponents differ from each other at p <0.05 level.
The mass and structure scores of Circassian cheeses during 90 days of storage were given in Table 5 . The effect of substitute salt on the mass and structure scores of the Circassian cheeses was statistically significant (p<0.05). Mass and structure scores of E group cheeses were found lowest on the first day of storage. The decrease in mass and structure scores was thought to be caused by activation of proteolytic enzymes of magnesium in group E cheeses and by separation of calcium from cheese structure in parallel with increase of acidity in group D cheeses.
Table 5
Mass and structure scores of Circassian cheeses during storage
Cheese
Storage Time (Day)
1.Day 15.Day 45.Day 90.Day
A 3.62±0.80aKL 4.00±0.55aK 3.48±0.75aK 3.76±0.83aK
B 3.71±0.78aL 3.43±0.60aK 3.57±0.75aK 3.28±0.96aK
C 3.48±0.93aL 4.05±0.67aK 3.29±0.84aK 3.43±0.98aK
D 3.19±0.68aL 3.80±0.87aK 3.52±0.81aK 3.48±0.98aK
E 2.86±0.85aK 3.71±0.90aK 3.29±0.71aK 3.33±0.98aK
A: NaCl, B: %25 CaCl2 / %75 NaCl, C: %25 KCl / %75 NaCl, D: %50 KCl / %50 NaCl, E: %25 MgCl2 / %75 NaCl
a, b, c: Values shown in different letters on the same line differ from each other at p <0.05 level.
206
The effect of storage time on cheese mass and structure of points is not significant (p> 0.05) and were similar to each other during storage. The highest mass and structural point at the end of the storage was determined in control group cheese.
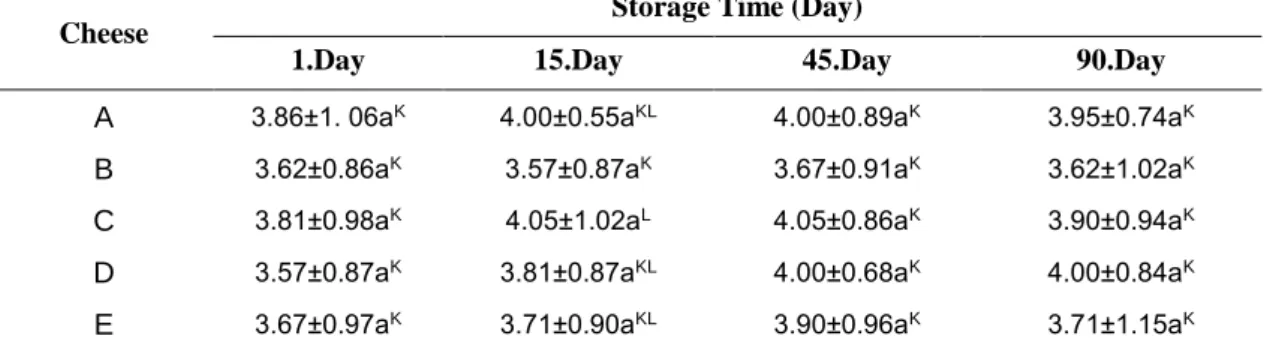
The general acceptability scores of cheeses during 90 days of storage time were given in Table 6. The effect of using substitute salt on the general acceptability scores of Circassian cheeses was statistically significant (p <0.05). General acceptability scores of B and C group cheeses were found to be different from other samples on the 15th day of storage. The general acceptability scores of cheese samples containing CaCl2 were found
to be lower than those of other Circassian cheese samples in all storage periods. The general acceptability scores of Circassian cheeses salted with 50% KCl/%50 NaCl were found to be similar to the control group.
Table 6
General acceptability scores of Circassian cheeses during storage
Cheese
Storage Time (Day)
1.Day 15.Day 45.Day 90.Day
A 3.86±1. 06aK 4.00±0.55aKL 4.00±0.89aK 3.95±0.74aK
B 3.62±0.86aK 3.57±0.87aK 3.67±0.91aK 3.62±1.02aK
C 3.81±0.98aK 4.05±1.02aL 4.05±0.86aK 3.90±0.94aK
D 3.57±0.87aK 3.81±0.87aKL 4.00±0.68aK 4.00±0.84aK
E 3.67±0.97aK 3.71±0.90aKL 3.90±0.96aK 3.71±1.15aK
A: NaCl, B: %25 CaCl2 / %75 NaCl, C: %25 KCl / %75 NaCl, D: %50 KCl / %50 NaCl, E: %25 MgCl2 / %75 NaCl
a, b, c: Values shown in different letters on the same line differ from each other at p <0.05 level.
K, L, M: Values shown in the same column with large different exponents differ from each other at p <0.05 level.
Katsiari et al. (2000) detected that the effect of using substitute salt on the general acceptability scores of Feta cheeses was insignificant. The effect of storage time on the general acceptability scores of the cheeses was statistically insignificant (p> 0.05). At the end of the storage period, the highest general acceptability scores were taken by the D group of cheeses.
CONCLUSIONS
On the first day of storage, depending on the water content , the use of substitute salt and the storage period varied in the color and appearance and salinity scores of the cheeses. There was no statistically significant difference in the odor and taste scores of Circassian cheeses for different substitute salt usage and storage time (p>0.05). The lowest taste scores were given to Circassian cheese samples containing CaCl2 and a bitter taste
was observed.
The salinity scores of the control samples were different from the other groups on the first day of storage. Salinity scores of all samples were similar in other periods of storage. Substitution salt usage affected the mass and structure scores of Circassian cheeses in the negative direction. The decrease in mass and structure scores was thought to be caused by activation of proteolytic enzymes of magnesium in group E cheeses and by separation of calcium from cheese structure in parallel with increase of acidity in group D cheeses. At the end of storage, the highest mass and building scores were determined in control samples.
The general acceptability scores of cheese samples containing CaCl2 substitution
207
In general, the sodium content of cheeses has been reduced by replacing with salts of KCl, CaCl2 and MgCl2. Addition of CaCl2 may cause an increase in the content of lactic
acid and sometimes bitter taste and loss of colour appearance scores. However, the sensory qualities of the obtained cheeses are acceptable and low-sodium Circassian cheeses can be produced by MgCl2 and CaCl2 content of 25% with acceptable properties. It is suggested
that sodium content can be reduced with minimal change in the sensory properties of Circassian cheeses with 50% KCl substitution.
BIBLIOGRAPHY
1. Altug Onugur, T., Elmacı, Y. 2011. Gıdalarda Duyusal Degerlendirme. Sidas Ltd. Şti., İzmir, s.134.
2. Aly M. E. 1995. An attempt for producing low-sodium Feta-type cheese. Food Chemistry, 52: 295-299.
3. Ayyash M. M., Shah N. P. 2010. Effect of partial substitution of NaCl with KCl on Halloumi cheese during storage: Chemical composition, lactic bacterial count, and organic acids production. Journal of Food Science, 75 (6): 525–529.
4. Ayyash M. M., Sherkat F., Shah N. P. 2012. The effect of NaCl substitution with KCl on Akawi cheese: chemical composition, proteolysis, angiotensin-converting enzyme-ınhibitory activity, probiotic survival, texture profile and sensory properties. Journal of Dairy Science, 95 (9):4747–4759.
5. Cruz A. G., Farıa J. A. F., Pollonıo M. A. R., Bolını H. M. A., Celeghını R. M. S.,
Granato D., Shah N.P. 2011. Cheeses with reduced sodium content: effects on functionality, public health benefits and sensory properties. Trends in Food Sci. & Tech., 22: 276-291.
6. Dagostin J. L. A., Carpine D., Masson M. L. 2013. Influence of acidification method on composition, texture, psychrotrophs, and lactic acid bacteria in Minas Frescal cheese. Food Bioprocess. Technol., 6: 3017–3028.
7. Dervisoglu M., Ilhan E., Aydemir O., Gul O. 2012. Farklı üretim yöntemleriyle
Çerkez peyniri. III. Geleneksel Gıdalar Semp.,10-12 May, Konya, 416–418.
8. Fıtzgerald E., Buckley J. 1985. Effect of total and partial substitution of sodium chloride on the quality of Cheddar cheese. Journal of Dairy Science, 68 (12): 3127–
3134.
9. Fox P. F., Cogan T. M., Guınee T. P., Mcsweeney P.L.H. 2000. Fundamentals of cheese science. Aspen Publication. ISBN:0834212609, 385-386.
10. Grummer J., Karalus M., Zhang K., Vıckers Z., Schoenfuss T. C. 2012.
Manufacture of reduced-sodium Cheddar-style cheese with mineral salt replacers. J. Dairy Sci., 95: 2830–2839.
11. Guneser O., Yuceer, Y. K. 2011. Characterisation of aroma-active compounds, chemical and sensory properties of acid-coagulated cheese: Circassian Cheese. Int. J. of Dairy Tech., 64(4): 517-525.
12. Guzeler N., Parlak Y. 2010. Production and Properties of Circassian Cheese. 11 th Egyptian Conference for Dairy Science and Technology - 1-3 November .
13. Kamber U. 2008. The Traditional Cheeses of Turkey: “Marmara Region”. Food
Reviews International. 24 (1): 175 – 192p.
14. Karagozlu C., Kınık O., Akbulut N. 2008. Effects of fully and partial substitution of NaCl by KCl on physico-chemical and sensory properties of White Pickled cheese. International Journal of Food Sciences and Nutrition, 59 (3): 181-191.
208
16. Katsıarı M. C., Alichanidis E., Voutsinas L. P., Roussisc I. G. 2000. Proteolysis in reduced sodium Feta cheese made by partial substitution of NaCl by KCl. Int. Dairy J., 10(9):635-646.
17. Ozdemir S., Ozdemir C., Celik S., Sekerci P. 2010. Peynir Teknolojisinde Modern Tuzlama Teknikleri. Proceedings of the 1 St International Symposium on ''Traditional
Foods from Adriatic to Caucasus'' , April, 15-17, Tekirdağ, Turkey
18. Reddy K. A., Marth E. H. (1993): Composition of Cheddar cheese made with sodium chloride and potassium chloride either singly or as mixtures. J. of F.Comp. and Analy., 6: 354-363.
19. Sahu J. K. (2010): Coagulation kinetics of high pressure treated acidified milk gel for preparation Chhana (An Indian soft Cottage cheese). Int. J.of Food Prop., 13:1054–
1065.
20. Samur G., Yıldız E. 2012. Obezite ve Kardiyovasküler Hastalıklar/Hipertansiyon.
Klasmat Matbaacılık, Sağlık Bakanlığı Yayın No: 729, ISBN : 9789755902456. 21. Tuyns A. J.1988. Salt and gastrointestinal cancer. Nutrition and Cancer, 11(4):