137 *Corresponding Author. Mail. [email protected]
Tell: +989383310117
Load Balancing in Cloud Computing using Cuckoo Optimization
Algorithm
Ali Abbasi Tadi1* Zohreh Aghajanloo2
1. Faculty of graduate studies, Electrical and computer department, Safahan Institute of Higher Education, Isfahan, Iran. 2.Institute of Higher Education of ACECR(Academic Center of Education and Culture Research), Rasht branch, Iran.
Received: 12, October, 2018 Accepted: 16, November, 2018 Online Published: 09, December, 2018
Abstract
Task scheduling in cloud computing is a complex problem. As it is clear, load balancing in clouds is a NP-Complete problem and gradient-based methods which search for an optimal solution to NP-Complete problems cannot converge to the best solution in an appropriate time. Therefore, in order to solve load balancing problem, evolutionary and meta-heuristic methods should be used. Thus, in this study, in order to find a solution for load balancing in cloud computing, Cuckoo Optimization Algorithm (COA) is used and it is compared with other methods including evolutionary and non-evolutionary algorithms. In order to prove efficiency of the method, COA is presented and simulated in Cloud-Sim simulator. Obtained results are better than results of GA and Round-Robin scheduling. Finally, it is found that the leader presented in this study gives more optimal outputs in heterogeneous (cloud) environments and user’s request is processed in an acceptable time. Thus, agreement is achieved at service level and user’s satisfaction is increased.
Keywords: load balancing, cloud computing, Cuckoo optimization algorithm, reducing response time, cloud-sim
1. INTRODUCTION
In recent years, with the development of cloud computing, big data and servers which employ internet have become predominant [1]. In the cloud computing paradigm, preserving load balancing is one of the new challenges; as number of users increases, their requests for various services in cloud computing platform also increase and useful and efficient use of cloud computing resources has become an important concern. Load balancing plays an important role in preserving cloud computing principles [2]. Purpose of load balancing is to speed-up execution of applications with different workloads which is not predictable during execution [3]. Various methods have been presented for load balancing like MET to allocate each task with the desired order without considering load flow to the node expected to have maximum execution. While, in Min-Min algorithm, minimum time taken to complete each task is calculated for each scheduled task; then, tasks with minimum execution time are allocated. Round-Robin algorithm employs simple distribution among tasks of all data centers or processing units and in FCFS , the first task is employed [4]. Optimal methods have been presented in load balancing area on cluster architectures and grid computation systems but these methods could not be implemented due to distributed nature of clouds [5]. Problem of grid computation systems in task scheduling of distributed heterogeneous resources is NP-Complete. Correct scheduling of clouds for developing an efficient scheduling resulting in allocation of virtual machines to physical resources is very essential. Main problem of this type of scheduling is its being NP-Complete. When a load enters the cloud, it is passed through scheduling machines so that it can be distributed based on processing capacity and power of each service, properly. Dynamic load balancing can be done in two ways: distributed and non-distributed. In the distributed
load balancing, dynamic load balancing algorithms are executed by all nodes of the system and load balancing task is divided among all nodes. Interaction among nodes in order to achieve load balancing might be in two forms: cooperative and non-cooperative [6]. In the first form, nodes cooperate with each other to achieve a common goal; for example, improving total response time. In the second form, each node operates independently to achieve a local goal like improving response time of a local task. Dynamic load balancing algorithms with distributed nature generate more messages compared to the non-distributed type because each node of the system needs to communicate with other nodes. One advantage of this method is that if one or several nodes of the system fail, load balancing process is not stopped but it affects system efficiency
[7]. Distributed dynamic load balancing might impose high pressure on a system in which each node requires to exchange information with other nodes of the system. This method is better than the method in which most nodes operate individually through low interaction with other nodes [8].
138
algorithms might create a bottleneck on the central node and load balancing does not give any results when the central node fails. Therefore, this algorithm is more proper for smaller networks [10]. Now, considering previous studies, conflictions and shortcomings of these methods, this study investigates load balancing in cloud computing using COA.
2. MAERIALS AND METHODOLOGY
VerificationIn order to prove the presented method which is described in this section, COA is proposed and it is simulated in Cloud-Sim. The obtained results are compared with results of GA and Round-Robin indicating that the proposed method gives better results. In order to evaluate the algorithms, the proposed algorithm, COA, GA and Round-Robin are simulated.
Evaluation and Simulation In this study, Cloud-Sim 3.3 is used and Integrated Development Environment (IDE) employed in this simulation is NetBeans 7.4. Cloud-Sim simulator is an open source library in Java language which can be used to model cloud computing environments and test efficiency of application services. This simulator is event-based. That is, defined entities communicate with each other through transmitting events [11], [12]. In order to offer an excellent service to the users, cloud service providers have to deal with problems like ensuring quality of service which might be shorter response time or higher permittivity, efficient resource utilization, dynamic workloads like modelling web applications and violating agreement level. Amidst, testing is one of the most important issues because it is not possible to perform benchmark tests in a scalable, reliable and
repeatable environment using a real cloud
environment. Therefore, in order to solve these problems, simulation tools like Cloud-Sim are used. Studied and Compared Methods In this study, COA is compared with two other algorithms. These algorithms include non-evolutionary round-robin algorithm and evolutionary GA. Since, COA is evolutionary,
comparing evolutionary and non-evolutionary
algorithms is not correct. Thus, this comparison is just to represent differences in the outputs between COA and non-evolutionary algorithm in heterogeneous environment.
Input Datasets
In this section, input datasets of the algorithm are presented. Considering Cloudlet concept in Cloudsim which indicates workload in social networks (workload might be either CPU limited or I/O limited), inputs of the algorithm can be specified. In each Cloudlet, four parameters should be specified:
1. Cloudlet ID
2. Million number of commands
3. number of processing elements (CPU cores) 4. Size of the input file
5. Size of the output file 6. Time of arrival
7. Memory utilization model 8. Bandwidth utilization model 9. Processor utilization model
In order to simulate the cloud environment, minimum number of millions of commands and arrival time should be determined randomly [13]. Number of millions of commands which shows processing size of Cloudlet should be a sample of a normal distribution and arrival time should be a sample of a Poisson distribution. In this study, normal distribution with
f commands of each Cloudlet. Values of ƛ for the arrival time are varied. Other parameters which should be compared with other methods should be specified statically. Since randomness of other parameters make analysis of outputs complicated. In this study, number of workloads to facilitate measurement is considered to be an integer factor of number of virtual machines which varies as specified below each diagram.
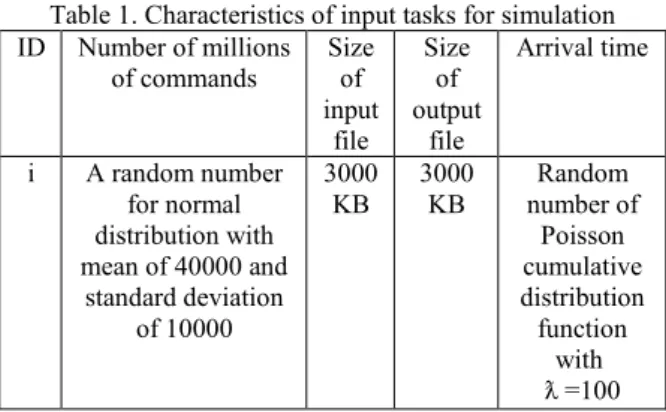
Table 1. Characteristics of input tasks for simulation ID Number of millions
of commands Size of input file Size of output file Arrival time
i A random number for normal distribution with mean of 40000 and
standard deviation of 10000 3000 KB 3000 KB Random number of Poisson cumulative distribution function with =100 ƛ
Probability distribution function of normal distribution is shown in Figure 1 and probability mass function of Poisson distribution is shown in Figure 2. Thus, number of millions of commands follows this distribution; in order to find random number in this equation, after finding cumulative distribution function and inverting it, pseudo-random numbers are generated
[14]. In this study, it is assumed that an average of 100 workloads enter the cloud at each time unit (ƛ =011). In order to prevent mathematical complexities in this simulation, Colt package in Java is used [15].
( )
√
( ) ⁄( ) (1)
( )
(2)
Table 2. A limited sample of virtual machines and their processing power and capacity as heterogeneous virtual machines
ID Type MIPS RAM Bandwidth VM
supervisor
VM volume Processing
elements
1 A i*5 mod 301 512MB 100Mb/s Xen 2200MB 1
139
Number of virtual machines used in this study starts from 25 and ends in 50. In this study, capabilities of virtual machines are as represented in Table 4. Variables used in physical machines can be represented as follows:
1. Physical machine ID
2. Total number of processing elements (CPU cores) 3. Size of temporary memory (RAM)
4. Bandwidth
Physical machines have higher processing power and capacity due to hosting virtual machines and difference of processing power and capacity makes the data center
Input data and infrastructure of the simulation is determined. Since, in this simulation, a number of algorithms are evolutionary, total framework and structure and input data of the evolutionary algorithms should be determined also. Table 6 represents structural data of the evolutionary algorithm.
As can be seen, all structural data of various evolutionary algorithms are considered to be the same.
5. Scheduling virtual machines 6. Permanent memory for storage 7. Name of the established data center
In this study, virtual machines are scheduled through time-sharing, thus, it is not mentioned in the table 3. In the last column of Table 4
, name of the data center in which physical machine is established is given. List of data centers is given in
Table 5.
heterogeneous. In this study, 4 data centers are located at different points of the world which are equal in terms of costs. Characteristics of data centers are given in Table 5.
According to the studies, as size of virtual machines increases, rate of convergence to the optimal solution is increased by orders of magnitude compared to genetic algorithm. In this study, all inputs of the evolutionary algorithms are considered to be the same. Inputs of non-evolutionary algorithms cannot be the same because they are different from evolutionary algorithms.
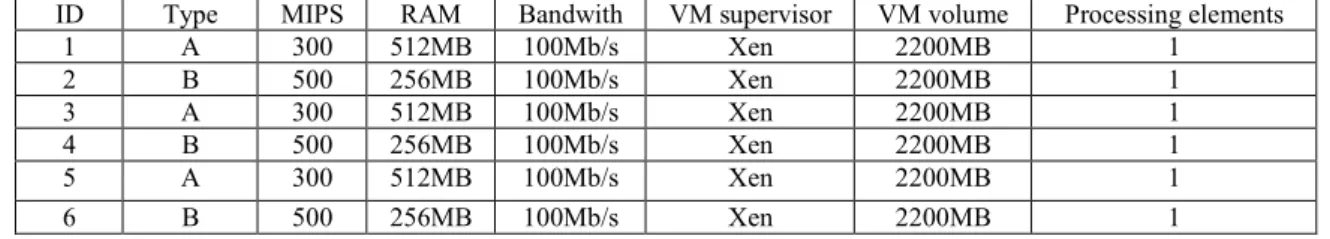
Table 3. A limited sample of virtual machines and their processing power and capacity as homogeneous virtual machines
ID Type MIPS RAM Bandwith VM supervisor VM volume Processing elements
1 A 300 512MB 100Mb/s Xen 2200MB 1
2 B 500 256MB 100Mb/s Xen 2200MB 1
3 A 300 512MB 100Mb/s Xen 2200MB 1
4 B 500 256MB 100Mb/s Xen 2200MB 1
5 A 300 512MB 100Mb/s Xen 2200MB 1
6 B 500 256MB 100Mb/s Xen 2200MB 1
Table 4. Characteristics of physical machines
ID Number of
cores each coreMIPS of RAM Bandwidth Permanent memory datacenter
1 3 30000 128GB 10Gb/s 10TB Datacenter-1
2 12 22000 128GB 10Gb/s 10TB Datacenter-2
3 2 8000 128GB 10Gb/s 10TB Datacenter-3
4 2 8000 128GB 10Gb/s 10TB Datacenter-3
5 2 8000 128GB 10Gb/s 10TB Datacenter-3
6 2 8000 128GB 10Gb/s 10TB Datacenter-3
7 4 10000 128GB 10Gb/s 10TB Datacenter-4
8 4 10000 128GB 10Gb/s 10TB Datacenter-4
Table 5. Characteristics of data centers in this study
Name Processing
cost
architecture Operating system
Memory cost
Bandwidth cost
Storage cost
Geographical position
Datacenter-1 3 X86 Linux 0.05 0.02 0.001 Canada
Datacenter-2 4 X86 Linux 0.05 0.02 0.001 Iran
Datacenter-3 5 X86 Linux 0.05 0.02 0.001 South Korea
Datacenter-4 2 X86 Linux 0.05 0.02 0.001 Japan
Table 6. Structure of the simulated evolutionary algorithms Evolutionary
method
Maximum number of generations
Population size
Problem dimension Mutation probability
Number of experts of the previous population
COA 200 100 Number of VMs 0.05 2
3. DISCUSSION AND RESULTS
This section is classified in two sections:
Comparing COA with round-robin and GA in heterogeneous environments
Comparing COA with non-evolutionary round-robin and GA in homogeneous environments
Comparison of Completion Time (CT) of Tasks
In this section, non-evolutionary round-robin method is
compared with COA. Although comparing
evolutionary algorithms and non-evolutionary
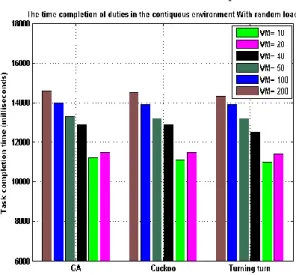
algorithms is not correct, but because both of these algorithms have been proposed for load balancing, comparing them would not be worthless and indicates the significant difference between evolutionary and non-evolutionary algorithms. The time required to complete tasks and input data are shown in Table 5. The point in non-evolutionary methods is that they employ the same virtual machines to process tasks. In the COA, since bandwidth of virtual machines, processing power of virtual machines’ processors and available memory of virtual machines by changing number of virtual machines are considered, completion time of tasks is different.
In order to obtain the presented outputs, corresponding values are first entered in Net Beans and obtained outputs are transferred to MATLAB array for different virtual machines. Next, different arrays are used to plot data in MATLAB to obtain the final output
Figure 1. Completion time of tasks in heterogeneous environment with random input load
Input of cloud tasks is random and follows Poisson distribution. But, random inputs cannot be used to measure and compare algorithms. Thus, constant data should be given to the cloud as input so that outputs are reliable and measurable. Standard workload framework has provided a constant set of input real data through storing different cloud services and large data centers. Simulations of this study are performed on standard datasets specifically central archive of Santiago Super Computers. This dataset is a standard dataset used for studies. In this study, input data given to the algorithm is selected from this dataset. Advantage of using this
dataset is that it is extracted from real environment which makes simulation closer to reality.
In all simulations, 1000 data of this dataset are selected. Simulations represented in the following are performed using almost homogeneous virtual machines; thus, COA has improved non-evolutionary algorithms by a small amount. In environments with homogeneous virtual machines, evolutionary machines cannot be used widely and generate additional processing overhead due to heavy processing.
As can be seen in the figure, COA outperforms GA. In GA, the algorithm is trapped in local optimum while solving the problem and the obtained solution is considered as global optimum.
Completion Time of Tasks
As mentioned, non-evolutionary methods are methods which have less overhead and can be implemented easily. In this study, non-evolutionary round-robin method is compared with COA. As shown in Figure 2-5, in COA, shorter response time is obtained due to optimal allocation of tasks to virtual machines. This response time is less than calculating memory of virtual machines and accessible bandwidth of virtual machines. In non-evolutionary methods, processing power of virtual machines is offline. In load balancing methods, the algorithms are categorized in to two groups:
1. Offline group: decision-making information about load balancing (bandwidth, processing power and accessible memory) is not up-to-date and uses initiation information of the data center.
2. Online group: decision-making information about resources to processing load is up-to-date and instantaneous load of the network can be extracted.
Figure 2: Comparing completion time of tasks (response time)
141
simulated non-evolutionary methods, a physical machine is selected to host virtual machines as a result of which the selected physical machine is overloaded and its workload increases as a result of which response time is increased.
Convergence Time to the Optimal Set of Solutions
In non-evolutionary methods based on gradient, finding convergence time to the optimal solution is not significant because they search for a solution in a set of few solutions. Complexity of finding optimal solution in these methods is of order O(1). Thus, these algorithms do not have processing overhead and their implementation is not complicated. Figure 3 shows convergence time to the optimal set of solutions. This figure shows time of generating an optimal solution among a large number of solutions. The less is the time of obtaining an optimal solution of a method, that method has no processing overhead for the scheduling machine. As can be seen, in COA, as number of virtual machines increases, time required to obtain an optimal solution is linear and its growth rate decreases. In GA, as dimensions of the problem increases, convergence time to the optimal solution increases exponentially. When number of virtual machines exceeds 200, considering growth rate in convergence time of GA, it is expected that convergence time of GA becomes larger than COA. Increase in convergence time to the optimal solution increases processing overhead of the scheduling machine and slows down scheduling operation in the scheduler service provider in long term.
Figure 3. Convergence time to optimal solution in heterogeneous environment
Bandwidth Utilization
As mentioned in “response time”, in non-optimal methods, when number of virtual machines increases, processing load is concentrated on a physical machine which increases load of the physical machine and it might overload.
In the round-robin method, where optimal allocation of tasks to virtual machines and optimal allocation of virtual machines to physical machines are not performed, response time is high. In fact, this method
tries to distribute load in order to prevent overloading and it does not consider optimal allocation.
Figure 4 shows bandwidth utilization. As can be seen, there is not a significant difference between GA and COA. But, by increasing number of virtual machines, bandwidth utilization is increased which is better in case of COA.
Figure 4. Bandwidth utilization in heterogeneous environment
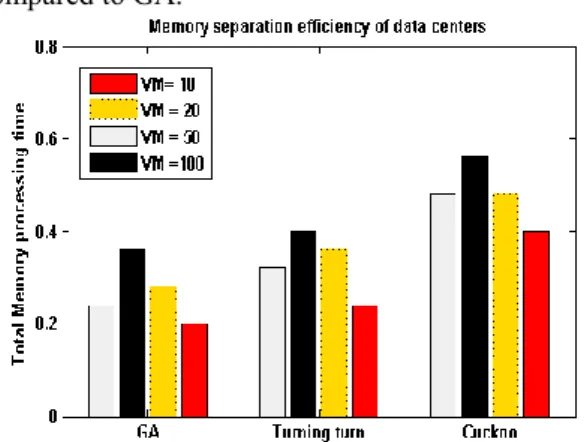
Memory efficiency
Figure 5 shows memory efficiency in heterogeneous environment. Memory efficiency means how much of the memory available to physical resources is used by the algorithm. As shown in the figure, due to optimal distribution of virtual machines among physical machines, COA has better memory efficiency compared to GA.
Figure 5. Memory utilization in heterogeneous environment
Processor Utilization
Processor utilization is equal to ratio of the time of using processor to total operation time of the processor in the processing environment. As processor utilization increases, energy loss is decreased and as energy loss is decreased, costs and resources are saved. Figure 6
shows processor utilization of physical machines. As can be seen, as number of virtual machines increases, processor utilization in COA increases due to load balancing in different data centers.
machines increases. This happens when physical machines are not overloaded in terms of bandwidth or accessible memory. Average resource utilization in COA and GA is shown in Figure 5. Considering load balancing in COA, it can be seen that processor is used in all data centers; thus, all data centers are involved in the processing operation. In GA, using one data center increases processor utilization compared to COA.
Figure 6. Processor utilization in heterogeneous environment Number of Physical Machines
Figure 7 shows number of physical machines used for processing 1000 tasks among tasks of standard framework. In the non-evolutionary round-robin method, since all physical machines are used in turn, all physical machines are in the processing circuit. Therefore, load is distributed on the whole physical machine; but, this is not done due to optimal allocation of load to virtual machines. Thus, in round-robin method, although load balancing is performed, optimal solution and proper response time are not obtained. In fact, COA allocates workload to each virtual machine considering its capacity.
Figure 7. number of physical machines used in heterogeneous environment.
Figure 7 shows number of physical machines used in heterogeneous environment.Each method has used different number of virtual machines due to different nature of approaches used to distribute virtual machines among physical machines.
COA uses all processing resources to allocate virtual machines as much as possible. This method uses processing capacity of the machines to prevent overloading of the physical machines.
In terms of energy consumption, the less is the number of employed physical machines, energy loss would be lower than other methods. In other words, the higher is processor utilization of a physical machine in a data center, energy loss of that data center would be less.
Figure 8. Comparing number of physical machines used in heterogeneous environment
4. AVARAGE ENERGY LOSS
Energy loss is the power lost in physical machines. Energy loss is inversely proportional to processor utilization of the physical machine. The higher is processor utilization, energy loss would be lower. As mentioned in the previous section, as number of
physical machines increases, since workload
introduced to the simulated cloud is always constant, average energy loss increases. In Figure 8, average energy loss in heterogeneous environment is shown. As expected, in COA, energy loss has reduced compared to GA. Although this reduction is not significant, but it is due to employing less physical resources. In the round-robin method, since resources are not allocated optimally to the tasks and all physical machines are not used (even at low workload), energy loss of round-robin is higher than other methods. Therefore, using this method does not result in optimal response time.
Figure 8. Comparing energy loss in heterogeneous environment
Simulation Results in Homogeneous Environment Completion Time of Tasks
Figure 9 shows completion time of tasks. In average, COA results in a small amount of improvement compared to GA which is due to using homogeneous framework of virtual machines. Average output of Cuckoo method is presented. Since COA is an evolutionary method, mutation is performed randomly to find the best solution. Thus, the best optimal set of solutions obtained at each execution might be different from previous outputs. In Figure 9, it can be seen that as number of virtual machines increases, no significant improvement is achieved compared to the round-robin method.
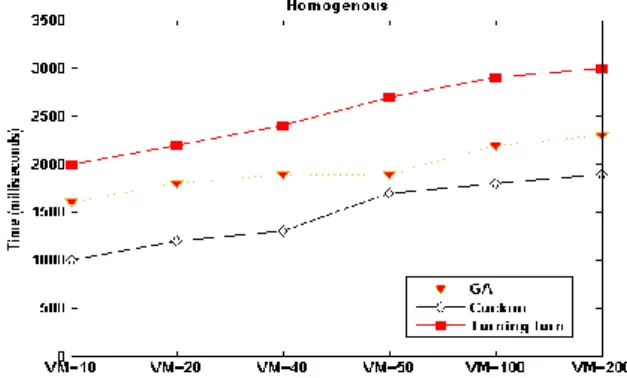
143 Makespan (Completion Time of All Tasks)
Figure 10 shows better response time of the COA compared to GA. Due to optimal allocation of tasks to virtual machines, shorter response time is obtained. In round-robin method, shorter response time is obtained due to homogeneity of the environment.
Figure 10. Completion time of all tasks in homogeneous environment
Convergence Time to the Set of Optimal Solutions
One of the powerful measures of an evolutionary method is its time of convergence to the set of optimal solutions. Time of convergence to the set of optimal solutions is the time taken for a population with random data permutation and mutation in data to obtain the best solution. Figure 11 compares convergence time of COA and GA. As can be seen, COA has higher convergence compared to GA. In fact, COA converges to the best solution.
Figure 11. Convergence time in homogeneous environment
Bandwidth Utilization
Increasing bandwidth utilization in a physical machine means allocating a large number of tasks to virtual machines of the physical machine. When environment of virtual machines is heterogeneous, only allocating larger tasks to stronger virtual machines does not improve response time. But, there are other parameters which improve response time like processor utilization, bandwidth utilization and accessible memory. COA considers these parameters. In round-robin method, all loads introduced to the cloud are allocated to virtual machines in turn, in order of first input-first output. Virtual machines are also allocated to physical machines using round-robin method.
Although it seems that using bandwidth in round-robin method is better than COA, but since current load on virtual machines is not considered for task allocation, it performs weaker in terms of the time required to complete all tasks compared to the proposed method and its energy loss is higher. Because it uses all physical machines and allocates improper and few tasks to each physical machine. As shown in Figure 12, in genetic method, all virtual machines are developed on one data center. Therefore, bandwidth utilization of that center has increased. In COA, since virtual machines are distributed on different data centers and load balancing is performed at virtual machines level, bandwidth utilization of all data centers is low and load is distributed on all data centers.
Figure 12. Bandwidth utilization in homogeneous environment
Memory Efficiency
Due to large volume of accessible memory, memory efficiency in all simulated methods is not significant. It is shown in 5-13 that best memory efficiency is 40%. Low efficiency in COA is due to load distribution on all data centers. Therefore, in COA, best memory efficiency is about 35%.
Figure 13. Memory utilization in homogeneous environment
Number of Employed Physical Machines
physical machine fails, all virtual machines which provide service to the users fail. According to Figure 14, as number of virtual machines increase, more physical machines enter the circuit to resolve requirements of virtual machines. In COA, in order to allocate virtual machines to physical machine, space of the physical machine is used as best as possible to prevent resource loss.
Figure 14. Number of employed physical machines
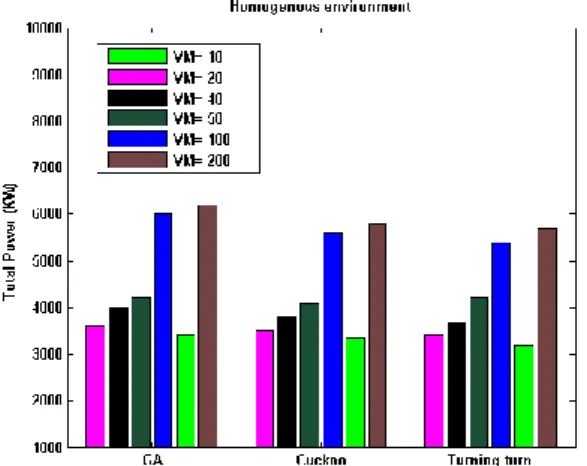
Average Energy Consumption
Energy consumed in all physical machines is shown in
Figure 15. As can be seen, energy consumption of COA is better than GA and this is one of the advantages of COA compared to other metaheuristic methods which achieves better response time by consuming less energy compared to similar algorithms. In this method, in order to allocate virtual machines to physical machines, we begin from the first virtual machine and virtual machines are allocated until the physical machine is finished. As a result, fewer physical machines are used and energy is saved.
Figure 15. Energy consumption of physical machines in homogeneous environment
Processor Utilization
Figure 16 shows processor utilization. As can be seen, COA shows better utilization compared to Genetic algorithm. In GA, since workload and all virtual machines are on one data center, that data center might overload. Processor utilization and energy loss are inversely proportional. When processor utilization is reduced, its average energy loss increases.
Figure 16. Energy consumption of physical machines in a homogeneous environment
4. CONSLUSION
According to the above discussion, it can be concluded that using the strategy proposed in this study in heterogeneous environments (cloud) gives optimal outputs and users’ requests are processed in an acceptable time. Thus, service level agreement is met and users’ satisfaction is increased. In homogeneous environments, using COA and other evolutionary methods is not cost-effective. However, COA generates more optimal outputs compared to other non-evolutionary methods in homogeneous environment. But, it is not cost-effective in terms of processing overhead imposed to the scheduler.
FUNDING/SUPPORT
Not mentioned any Funding/Support by authors.
ACKNOWLEDGMENT
Not mentioned.
AUTHORS CONTRIBUTION
This work was carried out in collaboration among all authors.
CONFLICT OF INTEREST
he author (s) declared no potential conflicts of interests with respect to the authorship and/or publication of this paper.
References
1.Abbasi, A., Sarker, S., & Chiang, R. H. (2016). Big data research in information systems: Toward an inclusive research agenda. Journal of the Association for Information Systems, 17(2), I.
[Scholar]
2.Chaczko, Z., Mahadevan, V., Aslanzadeh, S., & Mcdermid, C. (2011, September). Availability and load balancing in cloud computing. In International Conference on Computer and Software Modeling, Singapore (Vol. 14). [Scholar]
145
4.Chen, H., Wang, F., Helian, N., & Akanmu, G. (2013, February). User-priority guided Min-Min scheduling algorithm for load balancing in cloud computing. In 2013 National Conference on
Parallel computing technologies
(PARCOMPTECH) (pp. 1-8). IEEE. [Scholar]
5.Randles, M., Lamb, D., & Taleb-Bendiab, A. (2010, April). A comparative study into distributed load balancing algorithms for cloud computing. In 2010 IEEE 24th International Conference on Advanced
Information Networking and Applications
Workshops (pp. 551-556). IEEE. [Scholar]
6.Kansal, N. J., & Chana, I. (2012). Cloud load balancing techniques: A step towards green computing. IJCSI International Journal of Computer Science Issues, 9(1), 238-246. [Scholar]
7.Khiyaita, A., El Bakkali, H., Zbakh, M., & El Kettani, D. (2012, April). Load balancing cloud computing: state of art. In 2012 National Days of Network Security and Systems (pp. 106-109). IEEE. [Scholar]
8.Nurmi, D., Wolski, R., Grzegorczyk, C., Obertelli, G., Soman, S., Youseff, L., & Zagorodnov, D. (2009, May). The eucalyptus open-source cloud-computing system. In Proceedings of the 2009 9th IEEE/ACM International Symposium on Cluster Computing and the Grid (pp. 124-131). IEEE Computer Society. [Scholar]
9.Larson, J. S., & Cole, G. (2009). U.S. Patent No. 7,574,413. Washington, DC: U.S. Patent and Trademark Office. [Scholar]
10. Gharehkhani, A., & Abbaspour-Sani, E. A Novel Micro-Switch Capable of Handling RF Powers Higher than 5W. [Scholar]
11. Calheiros, R. N., Ranjan, R., Beloglazov, A., De Rose, C. A., & Buyya, R. (2011). CloudSim: a toolkit for modeling and simulation of cloud computing environments and evaluation of resource provisioning algorithms. Software: Practice and experience, 41(1), 23-50. [Scholar]
12. Keegan, P., Champenois, L., Crawley, G., Hunt, C., & Webster, C. (2005). Netbeans™ ide field guide: developing desktop, web, enterprise, and mobile applications. Prentice Hall Press.
[Scholar]
13. Calheiros, R. N., Ranjan, R., Beloglazov, A., De Rose, C. A., & Buyya, R. (2011). CloudSim: a toolkit for modeling and simulation of cloud computing environments and evaluation of resource provisioning algorithms. Software: Practice and experience, 41(1), 23-50. [Scholar]
14. Wickremasinghe, B., & Buyya, R. (2009). CloudAnalyst: A CloudSim-based tool for modelling and analysis of large scale cloud computing environments. MEDC project report, 22(6), 433-659. [Scholar]