SOCIOECONOMIC STATUS OF
PARENTS AND THE
ACHIEVEMENT OF CHILDREN
ON READINESS FOR
SCHOOL TESTS
Anela Hasanagić,
International Univeristy of Sarajevo, Bosnia and Herzegovina.
Abstract
This article examines whether socio-economic status and geographic location im-pact children on readiness for school tests in Bosnia and Herzegovina. The sam-ple used in this study consisted of 296 children: approximately half of the children were from rural areas and the other half from urban areas in Bosnia and Herze-govina. Tests that were used included: Differences test, Similarities test, Numeri-cal test, Trace test, Knowledge Test, Questionnaire for measuring socio-emotional maturity, and Goodenough’s Draw-a-Man Test. Results show that there are sta-tistically significant differences between children from different socio-economic background on these tests. Children whose parents are low educated have lower results on Readiness for school test, compared to children whose parents have fin-ished high school or college. The results showed that geographic location was not as significant a factor in readiness for school tests. There were differences between village and town children only on Goodenough’s Draw-a-Man Test and on Similar-ity test, while on other tests showed no significant correlation between this variable.
Keywords: socio-economic status, socio-demographic characteristics, readiness for
Introduction
from towns and children from villages on tests of intelligence, and tests of aca-demic achievement. In Bosnia and Herzegovina, because of these differences, we had different standards for measuring the readiness of urban and rural children. Many things changed following the 1992-95 war in Bosnia and Herzegovina. Many people from rural areas moved to urban ones because of better educational and career opportunities. A lot of people from villages have college degees due to ne-cessity. Also, rural areas are not like they used to be. Globalization now makes everything available in rural areas just like in more urban areas. Children in ru-ral areas now have computers, internet, cable TV etc. Preschool children, go to kindergartens, and their parents are more educated. Considering those facts that took place over last twenty years, it is necessary to check whether different standards of testing children from villages and towns, and different expectations from children in school, are still valid, or it is safe to assume that children from urban and rural areas have the same potential for starting the elementary school.
Hypothesis:
H1. We hypothesize that children whose parents are highly educated will have statistically significant better results on the Readiness for School Tests. H2. We Hypothesize that there are no statistically significant differences be-tween children from urban and rural areas on Readiness for School Tests.
Methodology
This research was planned like combination of quasi-experimental and correlational research that included method of systematic observation.
Participants:
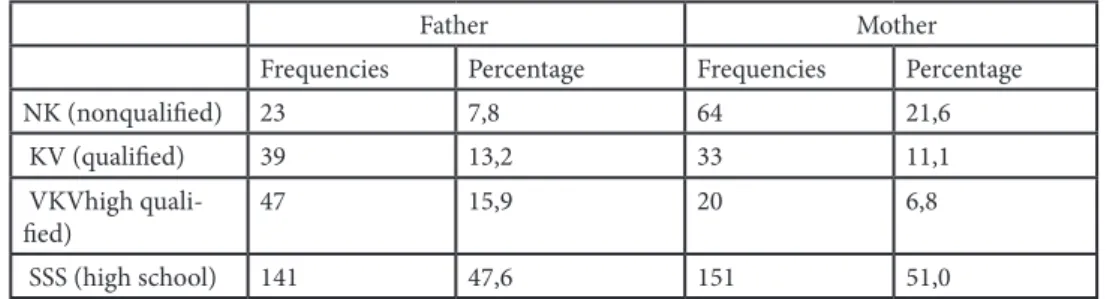
This study’s n-size consisted 296 early elementary school children: 147 boys and 149 girls. Table 1. Frequencies of educational level of parents, according to the nomenclature of educational lever adopted in BiH.
Father Mother Frequencies Percentage Frequencies Percentage
NK (nonqualified) 23 7,8 64 21,6
KV (qualified) 39 13,2 33 11,1
VKVhigh
quali-fied) 47 15,9 20 6,8
VS
(undergrad-uate) 22 7,4 18 6,1
VSS (graduate) 18 6,1 8 2,7
MR or DR (MA or
PhD) 1 0,3 -
Total 291 98,3 294 99,3
Missing 5 1,7 2 ,7
Total 296 100 296 100
Table 2. Frequencies of sample considering the residence as an independent variable.
Frequencies Percentage
Urban 149 50,3
Rural 147 49,7
Total 296 100,0
Instruments:
For the purpose of this research, researcher used a battery of tests and a question-naire for parents.
Tests
• Differences test - was taken from Thorndike’s Modified test of intelligence, which was previously applied by Mandić and Gajanović (1971). In this instrument participants were asked to find the picture that is totally different from other pic-tures among the five picpic-tures. The test has 12 items.
• Similarity test – was also taken from Thorndike’s Modified test of intelli-gence, and which was previously applied by Mandić and Gajanović (1971). The par-ticipant needs to find two pictures that are similar to each other among five pictures. It has 11 items.
• Numerical test – the idea of this test is taken from research that was made by Vlahović-Štetić, et al. (1995), but some items are added, because of the measuring conservation of number. It measures conservation, counting, simple summarizing, ordinal numbers, half of something etc. It has 9 questions.
• Trace test – it measures the oculo-motor coordination and fine motor skills when mapping some objects. It has five items for evaluation. On each item, better drawing is evaluated, and it can be evaluated with 0,1 and 2 points. Maximum is 10. Total score was calculated like simple linear combination of those four tests (sum of scores on Difference Test, Similarities Test, Numerical Test and Trace Test).
• Knowledge test – measures the knowledge about colors, shapes, letters, reading and understanding the materials that is read. It has 6 parts, and maximum is 58.
Questionnaire
• Questionnaire for parents – Socio-Emotional Questionnaire, which measures socio-emotional readiness for school, but also some socioeconom-ic facts about family. It has 37 items, and parents answered on questions.
Procedure:
The research was conducted in May 2011. For all children that were a part of research Informed Consent from parents was taken.
Results
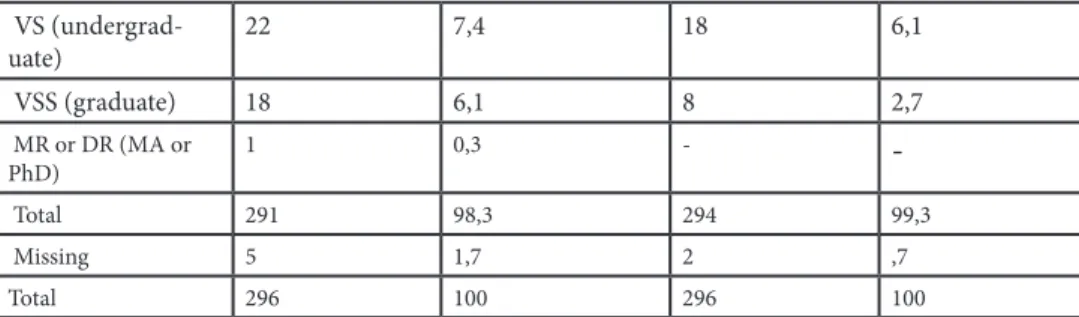
Testing the statistical significant differences of achievement on Readi-ness for school tests considering the level of education of parents like the in-dependent variable, by using the ANOVA for two inin-dependent variables. Table 3. Intercept ANOVA with two independent variables (mother and father educational level) and
dependent variables
Source Dependent
Variable Type III Sum of Squares df Mean Square F Sig. Correct-ed
Model Difference Test 254.471aSimilarities 12 21.206 2.760 .001
Test 118.244b 12 9.854 1.405 .163
Numerical Test 105.769c 12 8.814 1.677 .071
Trace Test 138.532d 12 11.544 2.125 .016
Total score 1137.884e 12 94.824 3.153 .000
Knowledge
Test 4934.211f 12 411.184 2.093 .018
Socio-Emotio
-anal Q 705.876g 12 58.823 1.796 .049
Goodenough’s
Drow a Man 9958.033h 12 829.836 3.270 .000
Intercept Difference Test 2727.600 1 2727.600 354.975 .000 Similarities
Test 2118.042 1 2118.042 301.958 .000
Knowledge
Test 36111.050 1 36111.050 183.827 .000
Socio-Emotio
-anal Q 12789.662 1 12789.662 390.410 .000
Goodenough’s
Drow a Man 750110.440 1 750110.440 2955.630 .000
Fathers’sEduc
-at-ional level Difference Test 8.495Similarities 3 2.832 .369 .776
Test .865 3 .288 .041 .989
Numerical Test 20.327 3 6.776 1.289 .278
Trace Test 47.301 3 15.767 2.903 .035
Total score 57.688 3 19.229 .639 .590
Knowledge
Test 1249.956 3 416.652 2.121 .098
Socio-Emotio
-anal Q 249.131 3 83.044 2.535 .057
Goodenough’s
Drow a Man 1332.692 3 444.231 1.750 .157
Mother’s
educ-at-ional level Difference Test 59.696Similarities 3 19.899 2.590 .053
Test 25.983 3 8.661 1.235 .297
Numerical Test 11.776 3 3.925 .747 .525
Trace Test 13.736 3 4.579 .843 .471
Total score 164.775 3 54.925 1.827 .143
Knowledge
Test 350.882 3 116.961 .595 .618
Socio-Emotio
-anal Q 76.091 3 25.364 .774 .509
Goodenough’s
Drow a Man 1391.940 3 463.980 1.828 .142
Father’s educ-at-ional level * Mother’s educat-ional level
Difference Test 11.093 6 1.849 .241 .963
Similarities
Test 39.461 6 6.577 .938 .468
Numerical Test 8.164 6 1.361 .259 .955
Trace Test 69.952 6 11.659 2.146 .048
Total score 108.901 6 18.150 .604 .727
Knowledge
Test 431.362 6 71.894 .366 .900
Socio-Emotio
-anal Q 419.485 6 69.914 2.134 .050
Goodenough’s
Drow a Man 703.113 6 117.186 .462 .836
Error Difference Test 2120.761 276 7.684
Similarities
Test 1935.964 276 7.014
Trace Test 1499.247 276 5.432 Total score 8299.618 276 30.071 Knowledge
Test 54217.546 276 196.440
Socio-Emotio
-anal Q 9041.639 276 32.760
Goodenough’s
Drow a Man 70046.147 276 253.790 Total Difference Test 12387.000 289
Similarities
Test 10758.000 289 Numerical Test 10761.000 289 Trace Test 11946.000 289 Total score 93367.000 289 Knowledge
Test 209422.000 289
Socio-Emotio
-anal Q 65388.000 289 Goodenough’s
Drow a Man 2772113.000 289 Correct-ed
Total Difference Test 2375.232Similarities 288
Test 2054.208 288
Numerical Test 1556.291 288 Trace Test 1637.779 288 Total score 9437.502 288 Knowledge
Test 59151.758 288
Socio-Emotio
-anal Q 9747.516 288 Goodenough’s
Drow a Man 80004.180 288
Table 3 shows statistically significant differences in term of interaction appeared for Differences Test, Trace Test, Total score and Socio-Emotional maturity Ques-tionnaire, and Goodenough’s “Draw a Man” Test. Particularly educational level of father is important factor for Trace Test, while the other results in this man-ner were not statistically significant. Because of that one way ANOVA was done, which showed statistically significant differences in term that children whose fa-thers are more educated (first or second University level) had better results that children whose fathers are not that educated. Also C coefficient of correlation was done (table 4), and it showed that there is statistically significant correlation between the level of education of fathers and success of their children on Read-iness for School Tests. The correlation was not significant only on Goodenough “Draw-a-man” test. The One way ANOVA for educational level of mothers showed statistical significant differences between children whose mothers have finished only elementary school, compared to children whose mothers finished high school and university level. Also there is a correlation between level of education of mothers and success in Differences test, Similarity test, Numerical test, Total score and Knowledge test. The same significance was shown by one way ANOVA.
Table 4. C coefficient values between level of education of parents and dependent variables
Educational level of father Educational level of mother
C-coefficient Sig. C-coefficient Sig.
Differences Test ,383 ,049 ,383 ,046
Similarities Test ,373 ,043 ,372 ,048
Numerical Test ,385 ,004 ,327 ,035
Trace Test ,352 ,043 ,315 ,346
Total ,484 ,041 ,524 ,038
Knowledge Test ,611 ,048 ,635 ,002
Socio-emotional
IQ. ,428 ,025 ,368 ,431
Goodenough’s ,676 ,067 ,670 ,104
Table 5. T-test for big independent samples for testing differences between children from urban and rural areas
Leven’s test t-test
F Sig. t Df Sig. two
tailed Difference M St. error Differences
Test 2,683 ,102 ,638 294 ,524 ,211 ,331
Similarities
Numerical
Test 2,422 ,121 -1,160 294 ,247 -,313 ,270
Trace Test 2,670 ,103 -1,422 294 ,156 -,398 ,280
Total 5,133 ,024 ,918 294 ,359 ,732 ,797
Knowledge
Test 3,271 ,072 -,673 294 ,502 -1,121 1,667
So- cio-emo-tional Q
,443 ,506 -,135 294 ,893 -,092 ,682
Goode-nough’s 2,750 ,098 4,020 294 ,000 7,623 1,896
The T-test for big independent samples showed that there are no statisti-cally significant differences between children from urban and rural are-as in all subtests but Similarity test, where children from town had statisti-cally significant higher scores, as well as in Goodenough “Draw-a-man” test.
Discussion
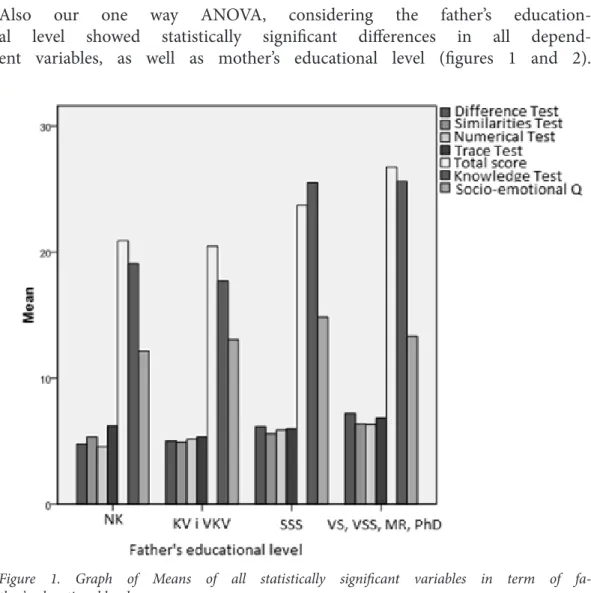
Also our one way ANOVA, considering the father’s education-al level showed statisticeducation-ally significant differences in education-all depend-ent variables, as well as mother’s educational level (figures 1 and 2).
Figure 1. Graph of Means of all statistically significant variables in term of
fa-ther’s educational level.
According to Crnic and Lamberty (1994)
The segregating nature of social class, ethnicity, and race may well reduce the va-riety of enriching experiences thought to be prerequisite for creating readiness to learn among children. Social class, ethnicity, and race entail a set of “contextu-al givens” that dictate neighborhood, housing, and access to resources that af-fect enrichment or deprivation as well as the acquisition of specific value systems.
Ramey and Ramey (1994) describe the relationship of family socioeconomic status to children’s readiness for school:
as-sumption that before the war in area of ex-Yugoslavia, there were some dif-ferences, but after the war those differences disappeared or because of the migration of population, or because of the globalization, or because of the edu-cation of youth from villages, or all of those factors together caused those re-sults and conclusions. Due to these rere-sults, it is not valid anymore to use differ-ent standards in evaluation of readiness for school of children from villages, and from towns, same standards should be used, as the same expectations as well.
Conclusions:
1. The Educational level of parents is an important factor in determining achieve-ment of a child on Readiness for school tests. Higher educated parents provide more stimulus for their children, resulting in those children have higher result on these tests. Level of education of parents should be considered when working with children. Teachers and professionals should make even greater efforts to provide an welcoming atmosphere for children who came from more interllectually deprived environment. 2. Socio-demographic characteristics are not important factors in de-termining achievement of child on readiness for school tests. Most of the in-dependent variables tested in this study showed that there were few statis-tically significant differences between children from urban and rural areas. Teachers and professionals who work with children should have this in mind; children from rural and urban areas should be approached in the same objective, open-minded manner and be given equal opportunities for educational success.
References:
Adžibaba-Gajanović N. (1982.), Psihički razvoj djeteta i vaspitanje, Svjetlost, Sarajevo Albrow M. & King E. (1990) Globalization, knowledge, and society, Sage Publications, Buggle F. (2002.), Razvojna psihologija Jeana Piageta, Naklada Slap, Jastrebarsko Bukvić, A. (1980), Predviđanje uspeha u školi, “Psihologija” br. 4, Beograd
Crnic, K., & Lamberty G. (1994). Reconsidering school readiness: Conceptual and applied perspec-tives. Early Education and Development 5(2), 99-105. Available online http://readyweb.crc.uiuc. edu/library/1994/crnic1.html
Ćehić E. (1997.), Indikatori zrelosti djece za polazak u školu, Psihoteka, Sarajevo,
Demarest, E.J., Reisner, E.R., Anderson, L.M., Humphrey, D.C., Farquhar, E., & Stein, S.E. (1993). Review of research on achieving the nation’s readiness goal. Washington, DC: U.S. Department of Education. [Online]. Available: (http://www.ncrel.org/sdrs/areas/issues/students/earlycld/ea7lk5. htm)
Demetriou A., Doise W. I Van Lieshout C. (1998), Life-span developmental psychology, John Wiley & Sons, West Sussex,
Duran M. (1995.), Dijete i igra, Naklada Slap, Jastrebarsko,
Farrar E, Goldfeld S, Moore T. (2007.) School readiness, Children’s Research Institute, Melbourne. Australia,
Ferenčić J, Keresteš G. I Bratko D. (2005.), Roditeljske implicitne teorije dječije inteligencije: razlike u funkciji spola i obrazovanja, Suvremena psihologija 8(2005),2, 147 – 161.
Furlan I. (1991.), Čovjekov psihički razvoj, Školska knjiga, Zagreb,
Gardner H., Kornhaber M.L. i Wake W.K. (1999.), Inteligencija, različita gledišta, Naklada Slap, Jastrebarsko,
Herrnstein, R. and Murray, Ch. (1994). The bell curve: intelligence and class structure in American life, New York: The Free Press,
Horvat L. (1986.), Predškolsko vaspitanje i intelektualni razvoj, Zavod za udžbenike i nastavna sredstva, Beograd,
Jan, M. (2009), Key Issues and Dimensions, Globalization of Media 29.1 : 66 - 75. EuroJournals Publishing, Inc. 2009.
Jensen A R. (1969).How much can we boost IQ and scholastic achievement? Harvard Educ. Rev. 39:1-123,
Klarin M. (2006.) Razvoj djece u socijalnom kontekstu, Naklada Slap, Jastrebarsko,
Mandić P. i Gajanović N. (1982.) Teorijske i praktične osnove upisa djece u školu – priručnik uz instrumentarij, Svjetlost, Sarajevo,
Mandić P. i Gajanović N. (1991.), Psihologija u službi učenja i nastave, Grafokomerc, Tunjić, Luka-vac,
Papalia D. E. i Wendkos Olds S. (1998.) Human development, McGraw Hill, sedmo izdanje, Piaget J. i Inherdel B. (1988.), Intelektualni razvoj djeteta, Zavod za udžbenike i nastavna sredstva, Beograd,
Piaget J. i Inherdel B. (1990.), Psihologija deteta, Dobra vest, Novi Sad,
Ramey S.L. & Ramey C.T. (1994). The transition to school: Why the first few years matter for a lifetime. Phi Delta Kappan, 76(30), 194-198.
Research brief, Child trends (2001.) School readiness: Helping communities get children ready for school and schools ready for children, Washington, DC
Research brief, The Initial Effect of Kindergarten Program Traits on StudentAchievement, March 30, 2004 | Volume 2 Number 7.
Seefeldt C & Barbour N. (1994), Early Childhood Education, Macmillan Publishing Company, Englewood Cliffs, USA,
Sirin S. R.(2003.), The relationship between socioeconomic status and school outcomes: Meta ana-lytic review of research, 1990--2000, Boston College Dissertations and Theses
Smiljanić Č.V. i Toličić I. (1976.), Dečja psihologija, Zavod za udžbenike i nastavna sredstva, Be-ograd,
Starc B., Obradović Č. M., Pleša A., Profaca B., Letica M. (2004.), Osobine i psihološki uvjeti razvo-ja djeteta predškolske dobi, Golden marketing, Zagreb,
Tovilović S. & Baucal A. (2007.), Procena zrelosti za školu, Centar za primenjenu psihologiju, Beograd,
Vasta R., Haith M.M., Miller S. (1998.) Dječija psihologija, Naklada Slap, Jastrebarsko,
Vlahović-Štetić V., Vizek-Vidović V., Arambašić L., Miharija Ž. (1995.) Priručnik za test spremnosti za školu, Naklada Slap, Jastrebarsko,