Abstract—In this paper, an application of a neuro-fuzzy modeling approach is presented in order to characterize the essential behavior of enzymatic esterification processes. The accuracy of the developed model was validated by comparing the response of the model and actual experimental data. The simulation results showed good generalization of the proposed model and its ability to predict the reaction yield, where the error of prediction for training data was less than 3%, and for validating and testing data less than 3 and 1.5%, respectively. A model-based optimization was performed to obtain the best operating conditions by using genetic algorithm. A fair comparison between the optimization results obtained from simulation experiments and laboratory data indicated the accuracy and feasibility of the proposed approach for estimating the optimal profiles in biotechnological processes. This can further facilitate up-scaling of the process by selecting the appropriate combinations of potential manufacturing parameters.
Index Terms— Enzymatic esterification, experimental data, model-based optimization, fuzzy logic system, clustering approach, genetic algorithm.
I. INTRODUCTION
Optimization is one of the important stages of the engineering design process. It increases the efficiency of the process without increasing the cost and material consumption thus improving the benefit-cost ratio both economically and environmentally [1], [2]. Chemometric methods are very helpful in increasing the performance and reliability of process optimization. They are used to study various parameters using a small number of experiments [3].
The inherent non-linear and unpredictable behavior of biotechnological processes makes them extremely complex. The conventional methods that are based on mathematical optimization techniques (such as response surface methodology, RSM) consider only local optimization and have some problems like screening for principal parameters and assuming a uni-model objective function [2]. In recent years, applications of artificial intelligence (AI) to biotechno- logical processes are growing rapidly. Knowledge-based approaches including artificial neural networks (ANNs),
Manuscript received November 19, 2011; revised December 25, 2011. A. Chaibakhsh is with the Department of Mechanical Engineering, University of Guilan, Rasht, Guilan, Iran, (Tel: +98-131-6690055; Fax: +98-131-6690271; e-mail: [email protected]).
N. Chaibakhsh, Institute of Bioscience, Universiti Putra Malaysia, 43400 UPM Serdang, Selangor, Malaysia (e-mail: [email protected]).
M. B. Abdul Rahman is with the Department of Chemistry, Faculty of Science, 43400 UPM Serdang, Universiti Putra Malaysia, Malaysia (e-mail: [email protected]).
fuzzy logic (FL) and genetic algorithms (GAs) have been introduced as powerful tools for dealing with nonlinearity and uncertainties [4].
The combination of ANNs and FL techniques makes neuro-fuzzy (NF) systems a very flexible option for optimization applications [5]. The essential behavior of biological processes can be characterized by using these systems based on gathered information from experiments. Fuzzy logic-based models have the advantages of high approximation ability and interpretability. They can be developed easier than mathematical models and are able to handle nonlinear systems [6]. Fuzzy classification techniques have already been applied to several biochemical processes such as modeling of the kinetics in enzymatic hydrolysis of penicillin-G [7], modeling and optimization of fed-batch fermentation processes [8,9], fuzzy classification of microbial biomass and enzyme activities for evaluating soil quality [10], and modeling changes in biomass composition during bioethanol production from lignocellulosic materials [11].
The high cost of preparing training data is a great problem, where many different experiments are required to be performed. However, employing small datasets for developing fuzzy models may cause over-fitting difficulties. Clustering approaches have been proposed to define the structure of fuzzy systems and to reduce the tunable parameters of fuzzy models with minimum losses in the accuracy [12].
In recent years, evolutionary computation approaches, such as GAs, has been investigated as an effective approach in optimization of bioprocess engineering problems. Genetic algorithms are non-model based optimization methods with the ability to find globally the optimum solutions in complex multidimensional search spaces [13]. They work based on the concepts of natural selection and evolution of biological species.
Several applications of the GAs for optimization of the biotechnological processes are presented in the literature. Muffler et al. [14] have reported a successful application of GA for optimization of halogenase enzyme activity for catalyzing the region-selective formation of carbon halogen bonds in the manufacturing of serotonin precursors. An application of GA for optimization of enzyme-catalyzed synthesis of o-glycan core-2 structure in a multi-enzyme system has been also presented by Hoh et al. [15]. By using this method, the selectivity of product formation at the maximum point was doubled. Such techniques allow scientists to perform experiments that would not be possible in the real world, and to simulate phenomena that are difficult to capture and analyze [16].
Application of Fuzzy Modeling and Optimization in
Enzymatic Esterification Process
In recent years, the use of enzymes, as ‘‘green’’ alternatives to chemical catalysts, in organic synthesis has increased extensively due to several advantages such as mild reaction conditions, high selectivity and specificity, low energy requirement, ease of product isolation, and biocatalyst reusability [17]. In this study, di-isobutyl adipate has been synthesized through lipase-catalyzed esterification of isobutyl alcohol with adipic acid. Adipic acid esters are used in a variety of applications, as solvent, plasticizer, lubricant and also in paint strippers, adhesives, perfumes, cosmetics, coatings, and gear and transmission oils [18].
In the present work, first a neuro-fuzzy model was developed for enzyme-catalyzed esterification process based on experimental data. In order to reduce the number of rules, fuzzy c-means (FCM) clustering algorithm was employed to define the structure of the fuzzy model, where the parameters of fuzzy rules were adjusted by least-squares methods.
In the next part of the study, the effects of reaction parameters on the degree of esterification were evaluated and the best operating conditions were obtained by conducting a model-based optimization using GA technique. The optimization was performed for global and constrained solutions by searching through the parameter space. The results obtained were compared with actual data from experiments to validate the accuracy of optimized parameters. It should be noted that so far there are few studies on using a combination of individual modeling approaches for enzymatic esterification.
II. MATERIALS AND METHODS
A. Materials
Candida antarctica lipase B immobilized on a macroporous acrylic resin (specific activity 10000 PLU/g; water content 1.4%), Novozym® 435, was purchased from NOVO Nordisk A/S (Bagsværd, Denmark).
Isobutyl alcohol (2-methylpropan-1-ol) and adipic acid were purchased from Merck Co. (Darmstadt, Germany). All other chemicals and solvents used in this study were of analytical grade.
B. Process Description
Different molar ratios of adipic acid and isobutyl alcohol were mixed corresponding to the different substrate molar ratios generated by a four-factor-five-level central composite design (CCD). CCD is an efficient statistical design with a hypercube geometry region which is generally used for decreasing the number of experiments while maintaining statistical significance [19]. Five milliliter of hexane was added as solvent. Different amounts of lipase were subsequently added. The reaction was performed at different temperatures and for different time periods. The esterification reaction is represented by Scheme 1
C. Analysis and Characterization
The reaction was terminated by dilution with 5 (mL) of ethanol: acetone (50:50 v/v) and the immobilized lipase was removed by filtration. Remaining free acid in the reaction mixture was determined by titration with 0.1 (M) NaOH
using phenolphthalein as the indicator.
Nomenclature
c number of the clusters cmax maximum number of clusters
e error
r weighting exponent of membership u membership degrees
v cluster centers
w fulfillment degree of fuzzy rules
w relative fulfillment degree of fuzzy rules x fuzzy system input
y fuzzy system output
y weighted consequences z unlabeled dataset for clustering
Ai,j membership functions
D distance
Jm clustering objective function
JQ optimization objective function
JXB clustering validation index
Ri fuzzy rule number
U membership degrees matrix V cluster centers vector
Abbreviation
AAD average absolute deviation
AI artificial intelligence
ANFIS adaptive neuro-fuzzy inference system ANN artificial neural network
CCD central composite design FCM fuzzy c-means clustering
FL fuzzy logic
GA genetic algorithm
GCMS gas chromatography/mass spectroscopy
LSE least-squares estimation
MISO multi input single output system NF neuro-fuzzy RSM response surface methodology SMR substrate molar ratio
TSK Takagi-Sugeno-Kang type fuzzy system
Greek letters
σ the center of Gaussian membership function
Γ weighted input dataset matrix
Θ consequent parameter matrix
Scheme 1. Esterification of adipic acid with isobutyl alcohol
The moles of acid reacted were calculated from the values obtained for the control (without enzyme) and the test samples. The ester formed was expressed as equivalent to conversion of the acid [19]. Production of ester was characterized by FT-IR (Perkin Elmer, USA, model 1650) with absorption bands of C=O bend of ester at 1732 (cm-1), and C-O stretching vibrations at 1162 (cm-1). Product was also monitored by gas chromatography/mass spectroscopy (GCMS) on a Shimadzu (model GC 17A; model MS QP5050A; Shimadzu Corp, Tokyo, Japan) instrument with a BPX5 column (0.25 (mm) × 30 (m), 25 (micron)). According to GCMS results, the reaction gave exclusive diester. The mass spectrum of the product showed molecular ion at m/z
two important ion peaks were related to the formation of ion asilium, [RCO]+, that gave the fragment ion at m/z 185 (because of the loss of alkoxy group from the ester, R-O) and the fragment ion at m/z 129 [O-CO-(CH2)4-C=OH]+ because of the rearrangement of the alkyl portion of the molecule. Other bonds cleavage occurred through some pathways and gave fragments ions at m/z 156, 111, 57, and 41.
III. PROCESS MODELING
A. Input-Output Selection
To obtain an accurate and reliable model, it is necessary that an appropriate dataset for the input variables be determined. It is suggested that all possible combinations of the low-dimensional fuzzy model be considered and evaluated to find the dominant input variables [20]. Here, a set of variables including temperature, time, enzyme amount and substrate (isobutyl alcohol: adipic acid) molar ratio (SMR) was chosen as the input parameters based on the previous studies [19]. The input/output vectors for the model can be presented as follows,
Yield ] Output = [
MR. ] amount S Enzyme
Time Temp
Input = [ . (1)
By performing some experiments on the real process, the training and validating databases including 42 and 5 sets of operating points are prepared, respectively.
B. Neuro-Fuzzy Structure
In this section, a nonlinear model based on neuro-fuzzy modeling techniques is developed for the esterification process. Neuro-fuzzy systems have a flexible mathematical structure that combines the learning capability of neural networks and the reasoning ability of a fuzzy rule-based system. A well-known architecture extensively used for nonlinear system identification is adaptive neuro-fuzzy inference system (ANFIS). The Sugeno fuzzy models (also known as TSK fuzzy models) developed by Takagi, Sugeno and Kang are particularly employed as the core of the ANFIS, due to their capability to describe nonlinear systems behavior by rather small number of parameters [21][22]. In the first order TSK model, the consequent is an affine linear function of the input variables, which can be expressed by a set of typical if-then rules as follows [23],
j i,j i,
i, i
i,j j i,
i
x b ... x b b y then
A is x and ... and A is x if : R
+ + + = 0 1 1 1
1
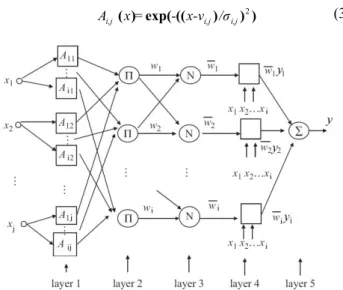
(2) where Ai,j is the ith membership function associated with jth input variable xj and bi,j , for i=0,1,2,…,n, are tunable parameters of fuzzy consequents. In this structure, a linear combination of the input variables is considered as the conclusion functions of fuzzy rules. The ANFIS architecture for first order Sugeno model for a multi-input single-output (MISO) system is presented in Figure 1. The firing degrees of the fuzzy rules are calculated through the five layers of the model.
In layer 1, the input signals to model are fuzzified by input nodes, and the membership degree of fuzzy sets {Ai,j} are calculated. Here, the membership functions Ai,j are considered to be Gaussian that is specified by the center v and the spread σ as presented in Eq. (3).
( ) exp((( ) )2) i,j i,j i,j x= - x-v /σ
A (3)
Fig. 1. ANFIS architecture for first order TSK model
In layer 2, the fulfillment degree of rules are calculated by multiplying the output values of all membership functions that come from layer 2 as follows,
∏
=
= n j
j j i
i A x
w
1 ) (
, (4)
In layer 3, the firing strength of each rule is calculated by normalizing corresponding degree of fulfillment with respect to the summation of fulfillment degrees of all rules.
∑
== Ν
= c
i i i i
i w w w
w
1 / )
( (5)
In which, c is the number of membership functions for each input. The consequence of each rule is calculated by multiplying the corresponding rule in its relative degree of fulfillment in layer 4 as follows,
)
( i, i, i,j j
i i i
i w y w b b x ... b x
y = = 0+ 1 1+ + (6)
Finally, in layer 5, the output of the net or the fuzzy system is calculated by adding all incoming weighted consequences,
∑
== m i
i
y y
1
(7)
extended by Bezdek [26]. In this approach, the system’s operating space is partitioned into several operating regions, where each rule would represent a local linear model at the corresponding regime [12]. In this case, the TSK fuzzy models are able to approximate the nonlinear systems by performing an interpolation of local linear models via their inference mechanism.
C. Fuzzy Partitioning and Structure Identification
In this section, FCM is employed to define the structure of fuzzy models. This consists of estimating the location of cluster centers and defining the corresponding fuzzy rules of each cluster. The FCM algorithm partitions the dataset into c
predefined subsets through optimizing an objective function, which indicates the desirability of each c-partition. The data partitioning into clusters depends on similarity/dissimilarity of each cluster member, which is generally defined by the distance of data points from cluster centers [27].
Let D(vi,zk) be the distance between vi and zk, where {vi}⊂Rs and {zk}⊂Rs are the vector of cluster centers and unlabeled dataset, respectively. Then, the following objective function should be minimized to find the best possible solution [26],
∑∑
= = = m k c i ik r k i D u V U J Minimize 1 1 2 ) ( ) ( ) , (: (8)
where uik is the membership of the k th data point in the i th cluster and m is the number of data points. The weighting exponent r (1 ≤ r < ∞) controls the degree of fuzziness of membership of each datum. Minimization of J is performed by considering the following constraints on the membership values, which would lead to the optimal partition.
1 0
1 1 1
1 = ≤ ≤
= ∀ = ∀
∑
= k i c i ki and u
u
c i m
k ... , ... ,
(9)
The optimal positions of cluster centers and corresponding membership degree can be captured from (10) and (11) via an iterative procedure. c i u z u v m k r k i m k k r k i
i = ≤ ≤
∑
∑
= = 1 1 1 , ) ( ) (~ (10)
and m k c i D D u c q r jq ik k
i ⎥⎥ ≤ ≤ ≤ ≤
⎦ ⎤ ⎢ ⎢ ⎣ ⎡ ⎟ ⎟ ⎠ ⎞ ⎜ ⎜ ⎝ ⎛ = − = −
∑
1 11 1 1 2 , , ~ ) /( (11)
The iteration would be stopped when no further improvement is observed in J(U,V). In general, it is expected that by increasing the number of cluster centers, the accuracy of model would increase. However, in order to avoid model over-fitting and the excessive computational costs, it is recommended that the number of clusters be defined automatically [28]. Many different validity indices are suggested for this regard. A validity function that performed well in practice was proposed by Xie and Beni [29]. This function depends on the total variance of geometric distance measure and the separation of the cluster centers, which is defined by, ) ) ( min . ( ) ( ) ( 2 1 1 2 ik k i c i m k ik r k i
XB u D m D
J
≠
= =
∑∑
= (12)
The optimum number of cluster centers can be captured through an iterative procedure. Here, some modifications are considered in implementing strategy in order to increase its performance.
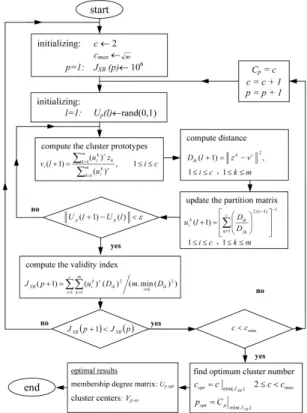
Here, the maximum number of clusters is chosen to be
cmax=m -0.5. In batch mode training, the cluster centers vector
V={vi} and the membership degree matrix U={u ik} are calculated with respect to the optimal number of cluster centers. The flow chart for data clustering and fuzzy partitioning algorithm is presented in Figure 2. By capturing
Uopt and Vopt , the parameters and structure of fuzzy models can simply be defined.
Fig. 2. Flow chart for the data clustering by FCM
D. Consequent Parameter Adjustment
By defining the fuzzy membership functions and corresponding fuzzy rules, the main requirement is that the parameters of fuzzy rules be adjusted. For this aim, least-squares estimation (LSE) technique is employed for adjusting the parameters of consequent based on experimental data. For each input-output pattern, Eq. (6) can be written as,
i i i
y =Γ.Θ (13)
where,
[
]
[
]
Tc,n c, c, ,n , , i i n c i c c i n i i b b b b b b x w x w w x w x w w ... ... ... .... ... ... 1 0 1 1 1 0 1 1 1 1 1 1 = Θ =
Γ (14)
All input–output patterns can be defined as below
1 1 1
1 × + + ×
× =ΓM c nΘc n M
In this case, the parameters of consequent can be obtained by minimizing the squared error as follows,
Y
TΓ Γ Γ =
Θ ( )−1 (16) In order to increase the performance of the training stage, a conventional normalization is adopted by dividing the input and output data by maximum value of each variable to scale data into the range of [0, 1]. This ensures that none of the variables is dominant over the others during the training phase.
The model training process was performed via FCM and LSE in MATLAB ® (Ver. 7.1) programming environment and simulated by MATLAB Simulink® (Ver. 7.5).
IV. PROCESS OPTIMIZATION
The best operating conditions of the esterification process can be captured by conducting a model-based optimization approach. For this purpose, the main requirement is a model that describes the process behavior, an optimization methodology, and a goal defined by a fitness function. In this regard, the fuzzy model developed in the previous section is used to predict the process output, where genetic algorithm (GA) was chosen for optimization. GAs work based on the evolutionary principles, which have many advantages over the conventional optimization methods. In the cases that there are no guidelines to optimize a process with different parameters, GAs would be an appropriate tool to find an optimal solution or at least an answer close to the best one. GAs are capable to search globally for the optimal solution by checking a vast collection of answers. The optimization was performed by using MATLAB® Optimization Toolbox (Ver. 5.0).
V. RESULTS AND DISCUSSION
A. Model Development
The proposed modeling algorithm is applied to training dataset. The implementation of this algorithm is preformed in two stages: 1) identifying the fuzzy model structure by means of fuzzy c-mean clustering, 2) identifying the parameters of fuzzy consequents using least- squares estimation method.
It is noted that each cluster would lead to one fuzzy rule; therefore, adopting a limited number of clusters can help to reduce the number of necessary fuzzy rules. However, the accuracy of the developed model is dependent on the number of clusters. As it is illustrated in Figure 2, the validation index is evaluated in an iterative process when c changes from two to m -0.5, where FCM is run at each step. The estimated values of validity function, JXB, are 0.1533, 0.1465, 0.1077, 0.1780, 0.1512 and 0.1527 for 2, 3, 4, 5, 6 and 7 clusters, respectively. The obtained results indicate that considering four cluster centers are adequate in order to cover the entire range of the variable changes. In Figure 3, the changes of validation function during clustering process, the fuzzy partition for four clusters and the corresponding centroids of each cluster are shown. By obtaining the optimal number of clusters, the positions of cluster centers and corresponding membership
function, the structure of fuzzy model can be defined. In Table I, the characteristics of the neuro-fuzzy model are presented.
Fig. 3. The values of validity index and optimal cluster centers
Fig. 4. Experimental and predicted values of the esterification yield with respect to (A) training data (B) validating data, and (C) testing data
TABLEI.CHARACTERISTICS OF THE NEURO-FUZZY MODEL
Variable Value/type
Fuzzy type Sugeno
Inputs/outputs 4/1 Number of clusters (fuzzy rules) 4
And method Product
Or method Probabilistic or
Implication method Product
Aggregation Sum
Defuzzification Weighted average
Then, it is possible to adjust the parameters of consequent by minimizing the squared error with respect to experimental data. The parameters of the input membership functions and the consequences are presented in Appendix A. The developed model is validating by performing a comparison between the responses of the model and experimental data.
In Figure 4(A), the experimental and predicted values of the esterification yield with respect to training data are presented. The obtained results indicate that the responses of the developed model are very close to the actual data.
error Mean(e), average absolute deviation AAD(e) and coefficient of determination R2.
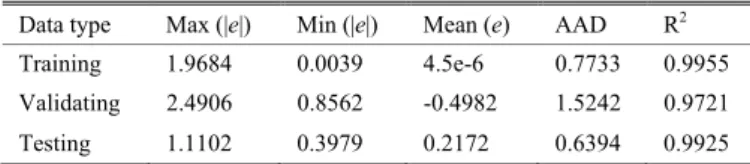
TABLEII.MODEL ERROR FUNCTIONS FOR THE TRAINING,VALIDATING AND TESTING DATA
Data type Max (|e|) Min (|e|) Mean (e) AAD R2
Training 1.9684 0.0039 4.5e-6 0.7733 0.9955 Validating 2.4906 0.8562 -0.4982 1.5242 0.9721 Testing 1.1102 0.3979 0.2172 0.6394 0.9925
It is necessary that different datasets be used for validating the accuracy and generalization of the models. In Figure 4(B), a comparison between the responses of the developed model and the corresponding validating data is shown. In addition, the estimated error functions are presented in Table II. The results indicate the accuracy of the developed model that is able to interpolate between data points.
For the last evaluation step, the performance of the model is evaluated with respect to testing data (Table II). The experimental and predicted values of the esterification yield with respect to testing data are plotted in Figure 4(C), which shows the degree of accuracy of the developed model for predicting the original output at different conditions.
A comparison between the developed neuro-fuzzy model and a quadratic response surface (RSM) model, which used for modeling of the enzymatic synthesis of di-isobutyl adipate [30], indicates superior data fitting and prediction capability of the NF for the testing dataset. The R2 and AAD values for the RSM testing dataset were 0.8928 and 2.5619, respectively. Generally, in many simplified models such as RSM, the effects of some parameters on the response are not considered, that leads to an increase in the error value
B. Effect of Parameters
The fuzzy surfaces for the developed model are presented in Figure 5 that shows changes of the model output (ester yield) with respect to the inputs variations. Thus, finding the best possible conditions through optimization would be easy. As illustrated in Figure 5(A), at low substrate molar ratio, the yield increases with increase in incubation time up to a certain amount and thereafter decreases due to the hydrolysis of produced ester by accumulated water (by-product of esterification reaction). By increasing the amount of substrates, the reaction yield increases and maximum yield is obtained at maximum time and substrate molar ratio.
Figure 5(B) shows the effect of time, enzyme amount and their mutual interaction on the ester synthesis, while temperature and substrate molar ratio are constant at their centre points (0.769 and 0.563 (normalized values), respectively). The yield increases with increase in enzyme amount. In fact, greater amounts of enzyme enhance the formation of the acyl-enzyme complex to produce the ester. This result can also be seen in Figure 5(C) that shows the effect of varying enzyme amount and temperature on the synthesis of adipate ester at constant substrate molar ratio and time (0.563 and 0.536, respectively). At low amount of enzyme, the yield increases with increase in temperature that promotes acceleration in the rate of reaction [31]. Higher reaction temperatures cause enzyme inactivation due to denaturation process that can be compensated by using
higher concentrations of enzyme. Figure 5(D) shows that the effect of substrate molar ratio on the reaction yield is more significant than temperature. In fact, the presence of larger amounts of substrate increases the probability of substrate and enzyme collision [32]. Increase in the yield with increasing alcohol:acid molar ratio can also be assigned to better solubility of the solid acid in higher amounts of alcohol, and reduction of viscosity of the reaction mixture.
C. Optimum Conditions
In order to increase the performance of the optimization process, the parameters such as population size, number of generation, crossover and mutation rates have to be chosen appropriately. The proposed parameters for optimization are presented in Table III.
TABLEIII.OPTIMIZATION PARAMETERS FOR GA Parameters Value Population Size 20
Crossover 0.8 / Intermediate Mutation Rate 0.1 / Uniform
Generation 20 - 30
Selecting Stochastic Uniform
It is possible to arrange different selections to achieve maximum yield. However, the required enzyme amount should be minimized in order to make the process more economical. The fitness function can simply be defined as the absolute difference between the target output equal to 100% yield and the model output at each sequence or generation, as follows,
yield
JQ=100− (17) This function is employed for the global and unconstrained searching.
TABLEIV.VARIOUS COMBINATIONS OF PARAMETERS FOR ACHIEVING MAXIMUM YIELD
Temp. (oC)
Time (min)
Enzyme amount
(mg) SMR JQ Actual yield (%)
52.6 339.9 310.6 6.5 1e-4 97.0
56.5 334.5 280.2 6.3 8e-6 98.7
56.8 303.8 304.8 5.9 2e-5 99.3
TABLEV.OPTIMUM CONDITIONS FOR LIPASE-CATALYZED SYNTHESIS OF DI-ISOBUTYL ADIPATE ESTER
Temp. (oC)
Time (min)
Enzyme amount
(mg) SMR JQ Actual yield (%)
58.1 196.8 133.9 5.9 0.067 98.8
55.8 282.9 20.0 7.0 0.090 97.8
63.7 130.0 20.0 7.4 0.170 97.3
In Table IV, three of the best optimum conditions obtained after performing various optimizations through global searching are presented. As can be seen in the Table IV, a high amount of enzyme is still required and the reaction time is long.
In order to deal with this problem, further limiting factors have to be considered in the objective function as follows,
2
2 1
Q
JQ= (18) where,
⎥ ⎥ ⎥ ⎥ ⎥ ⎥
⎦ ⎤
⎢ ⎢ ⎢ ⎢ ⎢ ⎢
⎣ ⎡
− −
− −
−
=
SMR unt Enzyme amo
Time e Temperatur
yield
Q
5 4 20
225 50
100
.
(19)
and
8 1
400 20
420 30
65 35
≤ ≤ ≤
≤
≤ ≤ ≤
≤
SMR unt
Enzyme amo
Time e
Temperatur (20)
In this function, the reaction yield and enzyme amount are considered at their maximum and minimum values respectively, where the other parameters are considered at their center points (Temp.= 50 (oC), Time= 225 min, SMR=4.5). The optimal reaction conditions can be attained by minimizing the fitness function JQ. The obtained results from performing a number of GA-based searches are presented in Table V. The actual data taken from laboratory experiments can indicate the optimal combination of parameters to achieve the maximum percentage yield equal to 98.8%.
Optimization was also performed to find the best possible
conditions where the amount of enzyme is at its lowest level, 20 mg (Table V). In this case, Q is defined as follows,
⎥ ⎥ ⎥ ⎥
⎦ ⎤
⎢ ⎢ ⎢ ⎢
⎣ ⎡
− − −
−
=
SMR Time
e Temperatur
yield
Q
5 4 225 50
100
.
(21)
In order to validate the accuracy of the optimization result, an experiment with the same parameter values was carried out in the laboratory. Obtained result shows a good agreement between the predicted and actual data. The actual yield obtained is 97.8% where the error is about 2.2%.
In addition, the optimal condition for achieving minimum required time (130 min) and minimum amount of enzyme (20 mg) are obtained, where Q is defined as follows,
⎥ ⎥ ⎥
⎦ ⎤
⎢ ⎢ ⎢
⎣ ⎡
− −
− =
SMR e Temperatur
yield Q
5 4 50
100
.
(22)
The result is presented in Table V. The actual yield obtained from experiment is 97.3%. The corresponding error at this condition is less than 3%
VI. CONCLUSIONS
Neuro-fuzzy modeling of immobilized Candida antarctica
lipase B-catalyzed synthesis of di-isobutyl adipate ester was successfully performed. The structure and parameters of the model was defined based on the gathered information from experiments using clustering methods. In this approach, the fuzzy c-mean (FCM) clustering technique was employed to define the location of cluster centers and the corresponding fuzzy rules of each cluster, where the parameters of consequent were adjusted by least-squares estimation methods. This helps to reduce the number of necessary fuzzy rules. The optimal number of the cluster centers is captured by performing a trial-and-error procedure. The simulation results show a small deviation between the models predicted values and the experimental data. A genetic algorithm was applied to the developed model for solving the optimization problem. The results obtained from simulation experiments and actual data indicates that the proposed approach can be suitably employed to estimate the optimal conditions in enzymatic esterification processes. The method can be used to deal with the difficulties of developing detailed models for biotechnological processes optimization.
APPENDIX A.
The parameters of input membership functions and fuzzy consequence for the developed model are presented in Tables A.I and A.II, respectively.
TABLEA.I.THE PARAMETERS OF INPUT MEMBERSHIP FUNCTIONS vi,1 σi,1 vi,2 σi,2 vi,3 σi,3 vi,4 σi,4
i=1 0.786 0.079 0.616 0.143 0.439 0.179 0.549 0.097
i=2 0.779 0.080 0.633 0.138 0.719 0.153 0.559 0.120
i=3 0.780 0.071 0.3165 0.153 0.489 0.117 0.426 0.136
TABLEA.II.THE PARAMETERS OF FUZZY CONSEQUENCES bi,0 bi,1 bi,2 bi,3 bi,4
i=1 0.501 0.219 -0.031 0.335 0.309
i=2 0.443 0.137 0.165 0.282 0.121
i=3 0.031 -0.055 0.657 0.083 0.984 i=4 0.927 -0.184 0.640 -0.030 -0.148
REFERENCES
[1] T.R. Kelley, “Optimization, an important stage of engineering design,” Technology Teacher, vol. 1, pp. 18-23, 2010.
[2] L.Z. Chen, S.K. Nguang, and X.D. Chen, Modeling and Optimization of Biotechnological Processes: Artificial Intelligence Approaches, 1st ed, New York: Springer-Verlag Berlin Heidelberg GmbH and Co., 2006.
[3] S.N. Deming, J.A. Palasota and J.M. Palasota, “Experimental design in chemometrics,” Journal of Chemometrics, vol. 5, pp. 181-192, 1991. [4] L.Z. Chen, S.K. Nguang, X.D. Chen, and X.M. Li, “Modeling and
optimization of fed-batch fermentation processes using dynamic neural networks and genetic algorithms,” Biochemical Engineering Journal, vol. 22, pp. 51-61, 2004.
[5] E.R. Nucci, R.G. Silva, V.R. Souza, R.L.C. Giordano, R.C. Giordano, and A.J.G. Cruz, “Comparing the performance of multilayer perceptrons networks and neuro-fuzzy systems for on-line inference of Bacillus megaterium cellular concentrations,” Bioprocess And Biosystems Engineering, vol. 30, pp. 429-438, 2007.
[6] A.M.S. Zalzala, and P.J. Fleming, Genetic Algorithms in Engineering Systems, 1st ed, London: The Institution of Electrical Engineers, 1997. [7] R. Babuska, H.B. Verbruggen, and H.J.L. van Can, “Fuzzy modeling of enzymatic penicillin-G conversion,” Engineering Application of Artificial Intelligence, vol. 12, pp. 79-92, 1999.
[8] O. Georgieva, I. Hristozov, T. Pencheva, S. Tzonkov, and B. Hitzmann, “Mathematical modeling and variable structure control systems for fed-batch fermentation of Escherichia coli,” Chemical and Biochemical Engineering Quarterly, vol. 17, pp. 293-299, 2003. [9] R. Berkholz, D. Rohlig, and R. Guthke, “Data and knowledge based
experimental design for fermentation process optimization,” Enzyme and Microbial Technology, vol. 27, pp. 784-788, 2000.
[10] D. Tscherko, E. Kandeler, and A. Bardossy, “Fuzzy classification of microbial biomass and enzyme activities in grassland soils,” Soil Biology and Biochemistry, vol. 39, pp. 1799-1808, 2007.
[11] D.R. Keshwani and J.J. Cheng, “Modeling changes in biomass composition during microwave-based alkali pretreatment of switchgrass,” Biotechnology and Bioengineering, vol. 105, pp. 88-97, 2010.
[12] T.A. Johansen, and B.A. Foss, “Identification of non-linear system structure and parameters using regime decomposition,” Automatica, vol. 31, pp. 321-326, 1995.
[13] M. Gen, R. Cheng, Genetic Algorithms and Engineering Optimization, 1st ed, New York: John Wiley and Sons, 2000.
[14] K. Muffler, M. Retzlaff, K.H. van Pée, and R. Ulber, “Optimisation of halogenase enzyme activity by application of a genetic algorithm,” Journal of Biotechnology, vol. 127, pp. 425-433, 2007.
[15] C. Hoh, G. Dudziak, and A. Liese, “Optimization of the enzymatic synthesis of O-glycan core 2 structure by use of a genetic algorithm,” Bioorganic and Medicinal Chemistry Letters, vol. 12, pp. 1031-1034, 2002.
[16] M. Mitchell, An Introduction to Genetic Algorithms, 1st ed., Cambridge: MIT Press, 1996.
[17] A.E.V. Petersson, L.M. Gustafsson, M. Nordblad, P. Börjesson, B. Mattiasson, and P. Adlercreutz, “Wax esters produced by solvent-free energy-efficient enzymatic synthesis and their applicability as wood coatings,” Green Chemistry, vol. 7, pp. 837-43, 2005.
[18] S. Gryglewicz, M. Stankiewicz, F.A. Oko, and I. Surawska, “Esters of dicarboxylic acids as additives for lubricating oils,” Tribology International, vol. 39, pp. 560-564, 2006.
[19] N. Chaibakhsh, M.B. Abdul Rahman, M. Basri, A.B. Salleh, and R.N.Z.R.A. Rahman, “Effect of alcohol chain length on the optimum
conditions for lipase-catalyzed synthesis of adipate esters,” Biocatalysis and Biotransformation, vol. 27, pp. 303-308, 2009. [20] S.L. Chiu, “Selecting input variables for fuzzy models,” Journal of
Intelligent and Fuzzy Systems, vol.4, pp. 243-256, 1996.
[21] H. He, “Fuzzy modeling and fuzzy control,” IEEE Computational Intelligence Magazine, vol. 3, pp. 8-10, 2008.
[22] J.S.R. Jang, C.T. Sun, and E. Mitutani, Neuro-Fuzzy and Soft Computing: A Computational Approach to Learning and Machine Intelligence, 1st ed. Upper Saddle River: Prentice-Hall, 1997. [23] T. Takagi, and M. Sugeno, “Fuzzy identification of systems and its
application to modeling and control,” IEEE Trans. on Systems Man and Cybernetics, vol. 15, pp. 116-132, 1985.
[24] N.R. Pal, K. Pal, J.M. Keller, and J.C. Bezdek, “A possibilistic fuzzy c-means clustering algorithm,” IEEE Trans. Fuzzy Set and System, vol. 13, pp. 517-530, 2005.
[25] J.C. Dunn, “A fuzzy relative of the ISODATA process and its use in detecting compact well-separated clusters,” Journal of Cybernetics, vol. 3, pp. 32-57, 1973.
[26] J.C. Bezdek, Pattern Recognition with Fuzzy Objective Function Algorithms, 1st ed, New York: Plenum Press, 1981.
[27] G. Beliakov and M. King, “Density based fuzzy c-means clustering of non-convex patterns,” European Journal of Operational Research, vol. 173, pp. 717-728, 2006.
[28] B. Feil, J. Abonyi, and F. Szeifert, “Model order selection of nonlinear input-output models - a clustering based approach,” Journal of Process Control, vol. 14, pp. 593-602, 2004.
[29] X.L. Xie, and G. Beni, “A validity measure for fuzzy clustering,” IEEE Trans. Pattern Analysis and Machine, vol. 13, pp. 841-847, 1991. [30] M.B. Abdul Rahman, N. Chaibakhsh, and M. Basri, “Effect of alcohol
structure on the optimum condition for novozym 435-catalyzed synthesis of adipate esters,” Biotechnology Research International, In Press.
[31] E.L. Soo, A.B. Salleh, M. Basri, R.N.Z.R.A. Rahman, and K. Kamaruddin, “Response surface methodological study on lipase-catalyzed synthesis of amino acid surfactants,” Process Biochemistry, vol. 39, pp. 1511-1518, 2004.
[32] E.R. Gunawan, M. Basri, M.B.A. Rahman, A.B. Salleh, and R.N.Z.A. Rahman, “Study on response surface methodology of lipase-catalyzed synthesis of palm-based wax ester,” Enzyme and Microbial Technology, vol. 37, pp. 739-744, 2005.
Ali Chaibakhsh (1980) received his B.Sc. degree in 2002 from University of Guilan in Mechanical Engineering, Rasht, Iran, and his M.Sc. and Ph.D. degrees in 2004 and 2009 from K.N. Toosi University of Technology, Tehran, Iran. He is now an Assistant Professor at the Department of Mechanical Engineering, University of Guilan. His research intersects are intelligent system including neural networks, fuzzy logic, and soft computing techniques and their applications in industrial processes modeling and control.
Naz Chaibakhsh (1978) obtained her B.Sc. (Hons)-Applied Chemistry from Guilan University in 1999 and her M.Sc. in Applied Chemistry from Polytechnic University of Tehran, Iran in 2002. She received her PhD in Catalysis Chemistry in 2010 from Universiti Putra Malaysia. She is currently a postdoctoral fellow at Institute of Bioscience, Universiti Putra Malaysia.