INTRODUCTION
Stability is a critical quality attribute of pharmaceutical products. The purpose of stability testing is to provide
Experimental design approach to optimize stability indicating
liquid chromatography method for the determination of naftopidil
in its bulk and tablet dosage form
N Satheeshkumar
1*, V Spandana
1, S Shantikumar
1, R Srinivas
21Department of Pharmaceutical Analysis, National Institute of Pharmaceutical Education and Research,
Hyderabad, Balanagar, 2National Center for Mass Spectrometry, Indian Institute of Chemical Technology,
Tarnaka, Hyderabad, Andhra Pradesh, India
ABSTRACT
Objective: To develop and validated a new stability indicating reverse phase high performance liquid chromatography (RP-HPLC) method for analysis of naftopidil (NAF), both as a bulk drug and in formulation. Method: The separation was achieved using a C18 GRACE column (250 mm × 4.6 mm i.d., 5 μm particle size) and gradient mobile phase system consisting of (A) 10 mM of ammonium acetate buffer pH adjusted to 4.0 with glacial acetic acid and (B) acetonitrile. The fl ow rate was 1.0 mL/ min with UV detection at 284 nm. NAF was subjected to stress conditions like hydrolysis (acid, alkali and neutral degradation), oxidation, photolytic and thermal decomposition. The linearity of the proposed method was investigated in the range of 10-150
μg/mL. Application of design of experiments for the robustness study method was carried out, where in fi ve factors was selected: pH of mobile phase, fl ow rate, strength of the buffer and column temperature. These factors were examined using JMP@ (SAS Institute) software. Result: The analytical method for NAF was developed and validated at the linearity range of 10-150 μg/mL. The LOD and LOQ were 0.6 and 2.04, respectively and accuracy of analysis was 100.5-101.1%. Conclusion: A robuststability-indicating HPLC assay method was developed using DOE, for the quantitation of NAF in its bulk and tablet dosage forms
Key words: Design of experiments, forced degradation studies, naftopidil, reverse phase high performance liquid chromatography
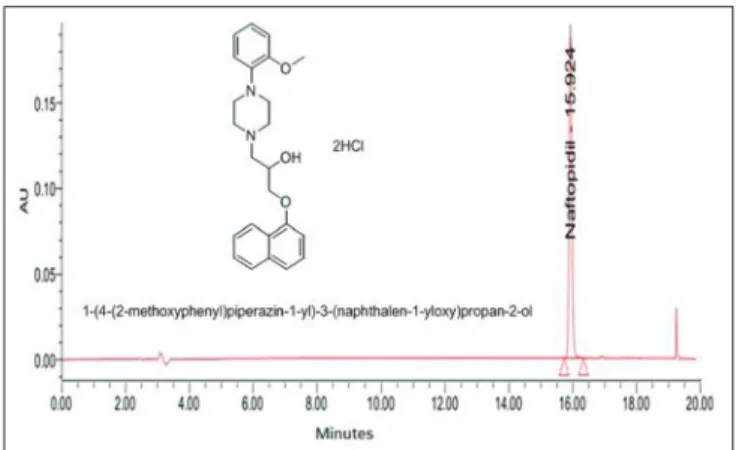
evidence regarding the quality of a drug substance or drug product and how each may vary with time under the infl uence of a variety of environmental factors such as temperature, humidity, light etc., Naftopidil (NAF) dihydrochloride is chemically 4-(2-methoxyphenyl)-alpha-[(1-naphthalenyloxy) methyl]-1-piperazineethanol dihydrochloride (Figure 1). It is an α1-adrenoceptor antagonist. In vivo studies revealed that NAF binds to α1 adrenoceptor in human benign prostatic hyperplasia (BPH) tissue and thus used for the treatment of lower urinary tract symptoms compatible with BPH.1-3
In literatures various analytical methods (high performance liquid chromatography [HPLC]) were reported for the
*Address for correspondence:
Dr. N. Satheesh Kumar, Department of Pharmaceutical Analysis, National Institute of Pharmaceutical Education and Research, Hyderabad, Balanagar, Hyderabad, Andhra Pradesh, India. E-mail [email protected]
Access this article online Journal Sponsor
Website:
www.jyoungpharm.org
DOI:
determination of NAF in biological matrices which includes, NAF in human plasma,4 chiral HPLC method for NAF
enantiomer,5 NAF in dog plasma,6 NAF capsules in dogs,7
NAF concentration in biological samples8 and NAF and its
main metabolite desmethylnaftopidil in plasma.9 Recently
chromatographic methods were developed in pharmaceutical dosage forms10-13 among which one is stability indicating
but none have reported till now with experimental design approach. Thus the work is unique with its fi rst report using design of experiments in analytical method development. Robustness is generally studied through traditional approaches which suffers major drawbacks like inability to determine complex interactive effects between method variables like pH, column temperature, fl ow rate, buffer concentration, mobile phase composition etc., and is a time consuming process which takes several runs to obtain data as a single variable is changed at each run while other approach being the optimization using quality by design, as per ICH Q8 guidelines, with design of experiments (DOE) leads to ensure success in fi nal method validation.14,15 Ye et al.16 have
reported the applicability of DOE and data treatment by JMP® and Hibbert17 has reviewed the applicability of DOE in
chromatography. In recent years the applicability of DOE and statistical data treatment of years, HPLC data have increased immensely.18,19 Therefore, the objective of present study is
to conduct comprehensive forced decomposition studies according to ICH prescribed conditions and development of stability indicating assay method by HPLC for NAF estimation and to apply chemometrics for robustness testing.
MATERIALS AND METHODS
Materials
All the reagents were of analytical-reagent grade unless stated otherwise. Millipore water, HPLC-grade acetonitrile
and methanol, (Purity ≥ 99.8%, SD Fine Chem., Mumbai, India) were used. Ammonium acetate was purchased from SD Fine Chemicals Limited, Mumbai. Grace C18 column, W. R. Grace and Co. Conn. 7500 Grace Drive, Columbia, MD 21044 was used in this present study. NAF was kindly supplied by Symed Labarotroy, Hyderabad as a gratis sample and it is used without purifi cation. NAFTOMAX tablets containing 50 mg of NAF were procured from local market.
Instrumentation
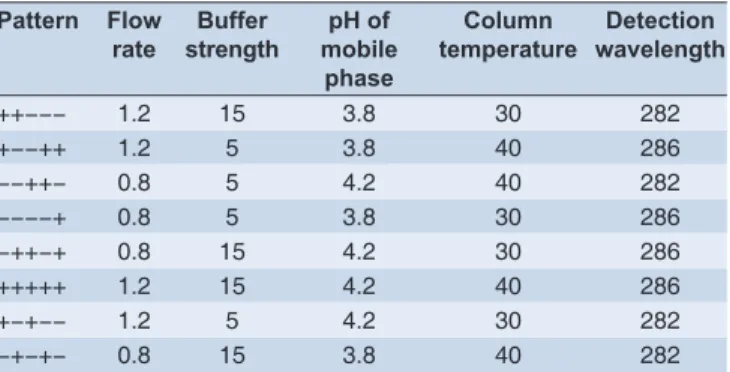
The HPLC system used for method development was WATERS e2695 separation module with DAD model 2998. The output signal was monitored and processed using LC, Solution, Milford, USA (Database version 1.24 SP1). All pH measurements were done using pH-meter (pH tutor, Eutech industries, Malaysia), weighing was done using Sartorius balance (CPA225D, Germany). Digital Sonicator (Power sonic 405, Hwashin technology corporation, Korea) was used for sonication purpose. The experimental design and statistical analysis of the data were performed, by JMP@ SAS software system, using Plackett– Burman design (Table 1) and 8 runs for robustness study.
Chromatographic conditions
The chromatographic column used was a Grace C18-250 mm × 4.6 mm, 5 μm. The separation was achieved on a gradient method consisting of (A) 10 mM of ammonium acetate (pH adjusted to 4.0 with glacial acetic acid) and (B) Acetonitrile (100%). The gradient programme was set as: Time (min)/% solution B: 0/20, 1/20, 16/90, 16.01/20 and 20/20. The fl ow rate was 1 mL/min and the detection wavelength was 284 nm. The temperatures of column and autosampler were maintained at 35°C and 5°C respectively. The injection volume was 20 μL.
Preparation of sample solutions
Sample diluent. Acetonitrile: Ammonium acetate (80:20% v/v)
Sample solution for method development
10 mg accurately weighed amount of NAF was taken and was diluted with diluents and was sonicated and madeup to 10 mL of sample diluent to make 1 mg/mL from this solution 0.5 mL was taken diluted againwith 10 mL of diluent to get 50 μg/mL.
Sample solution for degradation study
50 mg accurately weighed amount of NAF was dissolved initially in 3 mL of methanol, later on volume was made up to 50 mL with degradation causing reagents (2N HCl,
0.1N NaOH, water and 3% H2O2). After attaining suffi cient degradation, pH of solution was adjusted to 7.0 and the
fi nal dilutions were done with diluent to obtain fi nal target concentration of 50 μg/mL.
Forced degradation conditions
Forced degradation studies were performed on NAF bulk drug, to ensure the proposed analytical method as stability indicating assay method. Placebo degradation is not done as they are usually inert substances and hence these are not included in forced degradation studies. The forced degradation studies were done on drug substances and this was applied for drug product evaluation as per Reynolds et al. review.20 Intentionally NAF was allowed
to be degraded under various condition used for forced degradation study like acid hydrolysis, base hydrolysis, neutral hydrolysis, thermal decomposition, photolytic degradation and oxidation.
Hydrolysis
Hydrolytic degradation which includes acid, base and neutral hydrolysis was carried out in conditions like 1 N HCl at room temperature for 48 h, 1 N HCL with refl ux for 24 h, 2 N HCl for 6 h and 0.1 N NaOH bench top. Finally solutions were neutralized by adjusting the pH to 7.0. Neutral hydrolysis was carried out in water at 100°C for 5 days.
Oxidation
Oxidative degradation was carried out in 3% hydrogen peroxide (H2O2) for 4 h.
Thermal degradation
NAF was spread as a layer of 1 mm thickness in petri-plate and kept in hotair oven for 5 days at 100°C. Stressed samples were tested for peak purity using DAD. Assay studies were carried out for stress samples against qualifi ed reference standard and the mass balance (% assay + % degradation products) was calculated.
Photolytic degradation
The drug sample was exposed to light for and overall illumination of 1.2 million lux h and an integrated near ultraviolet energy of 200 W h m2.
Method validation
The developed stability indicating assay method was validated as per ICH method validation guidelines. The following validation parameters were addressed: Specifi city, precision, linearity, accuracy, robustness and stability of NAF in diluent.
Robustness study
Robustness of an analytical procedure is a measure of its capacity to remain unaffected by small, but deliberate variations in method parameters and provides an indication of its reliability during normal usage. In the present study,
fi ve factors were selected namely pH of mobile phase,
fl ow rate, strength of the buffer, and column temperature. Therefore using JMP software, a fractional factorial design (Table 1), was generated. The effects of variations in chromatographic parameters were evaluated using system suitability test results.
RESULTS
A gradient mobile phase consisting of (A) 10 mM of ammonium acetate (pH adjusted to 4.0 with glacial acetic acid) and (B) acetonitrile employing the following gradient: Time (min)/% mobile phase B, 0/20, 1/20, 16/90, 16.01/20 and 20/20. Both mobile phases were
fi ltered through 0.45 μm Chrom Tech Nylon-66 fi lter, were used in the present study. All determinations were performed at ambient temperature. The injection volume was 20 μL and mixture of acetonitrile and ammonium acetate (80:20% v/v) was taken as diluent. The fl ow rate was 1.0 mL/min with UV detection at 284 nm, based on peak area. The typical chromatogram with nominal concentration of NAF was shown in Figure 1. NAF was eluted at a retention time of 15.92 min.
Specifi city is the ability to assess unequivocally the analyte in the presence of components which may be expected to be present. It was carried out by performing peak purity test for NAF during the forced degradation study. Degradation was observed in NAF samples under stress conditions like acid hydrolysis, base hydrolysis and oxidation. NAF is unstable in basic reagents (NaOH), which is confi rmed by formation of a turbid solution after application of stressed condition. Degradation was not observed in conditions like neutral hydrolysis, thermal exposure and photolytic
Table 1: Plackett-Burman design for robustness study Pattern Flow
rate
Buffer strength
pH of mobile
phase
Column temperature
Detection wavelength
++−−− 1.2 15 3.8 30 282
+−−++ 1.2 5 3.8 40 286
−−++− 0.8 5 4.2 40 282
−−−−+ 0.8 5 3.8 30 286
−++−+ 0.8 15 4.2 30 286
+++++ 1.2 15 4.2 40 286
+−+−− 1.2 5 4.2 30 282
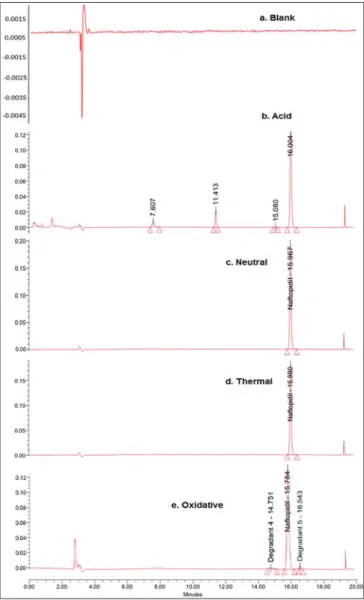
degradation, by which it can be said that NAF is stable in these conditions. Figure 2 shows the chromatograms of acid, neutral, peroxide and thermally stressed samples wherein the method could able to separate NAF from its
degradation products. Interference of any of degradants with the main peak was not observed which is shown in Table 2.
Linearity for the proposed method was established by least squares regression analysis of the calibration curve. Calibration curve was linear over the concentration range of 10 μg/mL to 150 μg/mL with a correlation coeffi cient (r) of 1.000 ± 0.002. The results (Table 3) show that an excellent correlation existed between the peak area and concentration of the analyte. The injection (system) precision was evaluated by performing six replicate injections of the standard NAF solution (nominally, 50 μg/mL). The procedure precision (intra-day and inter-day) was established by performing six replicate assays of independently prepared samples of NAF. The R.S.D. values were 0.31 and 0.37 for intra-day and inter-day precision respectively. The results of the same were reported in Table 3. Accuracy was performed by recovery studies using standard addition method. Standard drugs in the range of 80, 100 and 120% of the sample concentration were added to the sample solution which is spiked with 50 μg/mL. Each concentration was analyzed in triplicate.
Figure 2: Chromatograms of the Forced degradation study, which includes (a) blank, (b) acid stressed samples, (c) neutral hydrolysis, (d) Thermal stressed sample and (e) peroxide stressed samples
Figure 3: Prediction profi ler for tailing factor
Table 2: Summary of forced degradation study
Name Retention time Area Area %
Acid degradation (refl ux at 100°C in 2 N HCL for 6 h)
DPN 1 7.6 78510 7.5
DPN 2 11.41 110602 10.57
DPN 3 15.08 6540 0.62
NAF 16 845958 80.82
Neutral degradation (neutral refl ux at 100°C for 2 days)
NAF 15.96 1209343 100
Thermal degradation (100°C for 5 days)
NAF 15.98 1135310 100
Oxidative degradation (10% H2O2 for 4 days)
DPN 4 14.75 28012 2.17
NAF 15.78 1241114 96.31
DPN 5 16.54 19545 1.52
The recovery of NAF in bulk drug samples ranged from 100.5-101.1%. The results are shown in Table 3.
The robustness of the developed method was determined by analyzing the samples under a variety of conditions of the method parameters, such as fl ow rate, pH of the buffer, buffer concentration and column temperature. The tailing factor for the varied method conditions was found to be 1.15-1.20 for NAF, resolution for acid and oxidation degradation was found to be 1.5-2.3 and 1.2-1.8 (Table 4).
Table 3: Summary of validation parameters
Parameter values
Linearity range (μg/mL) 10-150 Regression equation y=22986x-9348 Correlation coeffi cient 1.000
LOD (μg/mL) 0.6
LOQ (μg/mL) 2.04
Accuracy (% recovery) 100.5-101.1% Precision (peak area %
RSD)
Intraday (n=6) 0.31
Interday (n=6) 0.37
LOD = Limit of detection; LOQ = Limit of quantifi cation; RSD = Relative standard deviation
Table 4: Results of summary of fi t and parameter estimates for tailing factor
Summary of fi t Parameter estimates
Parameter Estimate Standard
error
t ratio
Prob>[t]
R2 0.9609 Flow rate (0.8, 1.2) −0.10 0.019 −5.06 0.051
Root mean square error 0.0559 Strength of buffer (5, 15) −0.08 0.019 −4.43 0.067 Mean of response 1.32 pH of mobile phase (3.8, 4.2) 0.001 0.019 1.9 0.19 Observations 48 Column temperature (30, 40) 0.037 0.019 −0.63 0.59 Detection wavelength (282, 286) −0.012 0.019 0.01 1.00
The proposed method for the estimation of NAF was applied to marketed pharmaceutical formulations. The assay was carried out on the marketed tablet formulation NAFTOMAX. Amount of drug actually present (% label claim) in the marketed tablet formulation was estimated using proposed method.
DISCUSSION
Stability indicating assay methods are useful for determining the integrity of drug substance during accelerated shelf life studies. It provides information about the drug quality. Therefore there is a need for developing a stability indicating HPLC method for estimation of NAF in pharmaceutical formulations. The proposed HPLC method was developed with an objective of separation of both the drug and its degradants. NAF is insoluble in water and has a pKa value of 7.32. Considering these physicochemical aspects i.e. hydroscopic nature, bonded phase i.e. C18 was selected initially and the buffer and pH of buffer were selected based on the pKa of the drug. As the pka of drug is 7.3, pH of buffer should be beyond pka ± 1, so the working range of ph can be 3-6.3, with this view ammonium acetate 50 mM and 25 mM was selected as its buffering range is 3.8-5.8. Initially screening was done at 4 and 5 using acetonitrile and methanol as organic modifi ers. At pH-4.0, with mobile phase composition of 20% buffer (ammonium acetate) and 80% acetonitrile, separation with good resolution and better peak shape was observed. Later the infl uence of buffer concentration was studied where with the decrease in concentration of buffer the peak shape is unchanged. When the same conditions were applied to separation of stress degradants of NAF, it resulted in poor separation with unresolved peaks. These stress degradants have both late eluting and early eluting peaks, because of isocratic conditions few degradant peaks couldn’t able to resolve. Therefore gradient method was used to solve this, these gradient conditions (A) 10 mM of ammonium acetate (pH adjusted to 4.0 with glacial acetic acid) and (B) acetonitrile with time (min)/% mobile phase B, 0/20, 1/20, 16/90, 16.01/20 and 20/20, gave good results wherein all the major degradants got resolved.
Figure 4: Response surface plot for tailing factor, wherein fl ow rate is
a fi xed variable, (a) buffer strength, (b) pH of mobile phase, (c) column temperature and d) detection wavelength
d c
Forced degradation studies
Peak purity test results confi rmed that the NAF peak is homogeneous and is pure in all the forced degradation study samples. Thus proposed HPLC method is specifi c for both NAF and its degradants.
Robustness
In robustness testing, parameters and responses were selected based on the operational and instrumental conditions, tailing factor and run time were selected but the resolution between the degradation peaks was not included as the method is specifi c stability indicating assay. Percentage RSD for retention time for 48 (6 × 8) experimental runs for NAF on anaverage was between 2.53 and 3.66% which is within the proposed criterion of 5%. Percentage RSD for area response was between 1.1. For which the proposed acceptance criterion of <2% was passed.
Tailing factor
Tailing factor (T) for each of the 48 injections (six injections per run x eight runs) was entered in JMP software and analyzed using the ANOVA method by least square fi t. Fitting resultsrevealed that Prob > [t] was greater than 0.05 for fl ow rate, pH of mobile phase and strength ofbuffer. It demonstrated that no signifi cant differences were observed when changing the above factors within the tested ranges. Prediction profi le on 95% confi dence interval showed that all T values would be within acceptance criterion, 0.5 ≤ t ≤ 2.5, if parameters were changed within their testing ranges. Therefore, the conclusion was made that the tailing factor was acceptable when chromatographic parameters were changed within the experimental range. Profi ling is an approach to visualizing response surfaces by seeing what would happen if you change just one or two factors at a time. Prediction profi ler shows vertical slices across each factor considered, holding other factors at current values which is shown in Figure 3. Response surface plots which represents 3-D plots of responses for 2 factors at a time for tailing factor with fl ow rate as a fi xed variable are shown in Figure 4. These plots were also known as contour profi ler, they aid in viewing the response surfaces graphically, especially when there are multiple responses. In this how the tailing factor gets changed by altering various parameters like buffer strength, pH of mobile phase, c) column temperature and d) detection wavelength fl ow rate is a fi xed variable.
Resolution
Resolution (Rs) was considered for NAF peak and closely eluting degradant peaks, which are observed with acid and
oxidative degradation. Rs for each of the 48 injections (six injections per run × eight runs) was entered in JMP software and analyzed using the ANOVA method by least square fi t. Fitting results revealed that Prob >[t] was greater than 0.05 for fl ow rate, pH of mobile phase and strength of buffer. It demonstrated that no signifi cant differences were observed when changing the above factors within the tested ranges. Prediction profi le on 95% confi dence interval showed that all T values would be within acceptance criterion, Rs ≥ 1.5, if parameters were changed within their testing ranges. Therefore, the conclusion was made that the resolution was acceptable when chromatographic parameters were changed within the experimental range.
CONCLUSION
A robuststability-indicating HPLC assay method was developed using DOE, for the quantitation of NAF in its bulk and tablet dosage forms. The proposed method is new, specifi c, accurate, precise and robust. The procedure permitted an accurate and quantitative determination of NAF. All the degradation products formed during forced decomposition studies were well separated from the analyte peak demonstrates that the developed method was specifi c and stability-indicating. This method can be used to carry out the analysis of NAF in stability samples. The proposed method was robust within the specifi ed limits which can be assured by the statistical data provided. The acceptance criteria for the system suitability were % RSD for RT ≤ 5.0% and %RSD for area ≤ 2.0%, 0.5 ≤ T ≤ 2.5, K ≥ 1.5. Control limits for HPLC method parameters tested in this robustness study are fl ow rate 1 ± 0.2, pH of mobile phase 4.0 ± 0.2, buffer strength 10 ± 5 and temperature 35 ± 5. To conclude approaches like DOE fi ts well for these applications which is economical, reduces the total number of experiments to be done which in turn saves time.
ACKNOWLEDGEMENTS
The authors are indebted to NIPER-Hyderabad, for providing the necessary facilities to carry out this work.
REFERENCES
1. Takei R, Shibata IK, Tsujimoto, G, AsanoT. Naftopidil, a novel α 1-adrenoceptor antagonist, displays selective inhibition of canine prostatic pressure and high affi nity binding to cloned human α1-adrenoceptors. Jpn J Pharmacol 1999;79:447-54.
2. Yamada S, Suzuki M, Kato Y, Kimura R, Mori R, Matsumoto K, et al. Binding characteristics of naftopidil and alpha 1-adrenoceptor antagonists to prostatic alpha-adrenoceptors in benign prostatic hypertrophy. Life Sci 1992;50:127-35.
KMD-3213, a novel, potent, alpha 1a-adrenoceptor-selective antagonist: Characterization using recombinant human alpha 1-adrenoceptors and native tissues. Mol Pharmacol 1995;48:250-8.
4. Niebch G, Borbe HO, Besenfelder E. High-performance liquid chromatography of naftopidil, a novel antihypertensive drug, and two metabolites in human plasma. J Chromatogr 1990 14;534:247-52. 5. Yin XS, Bi YH, Yuan M, Shi JS. Development of a chiral HPLC method
for the analysis of naftopidil enantiomers. J Chin Pharm Sci 2009;18:61-3. 6. Jinsong D, Xuehua J, Hao Z. Determination of naftopidil in dog plasma by
high performance liquid chromatography and study on its pharmacokinetics. J Chin Pharm Sci 2000;9:200-3.
7. Ding JS, Jiang XH. Pharmacokinetics of high-dosage naftopidil capsules in dogs. Hunan Yi Ke Da Xue Xue Bao 2001;26:425-7.
8. Yu DH, Wan LT, Lou YQ. Methodological study on the determination of naftopidil concentration in biological samples by HPLC. Yao Xue Xue Bao 1995;30:286-90.
9. Yuan M, Tang L, Fu X, Shi J, Zheng Z, Liu X. Determination of naftopidil and its main metabolite in plasma by high-performance liquid chromatography. Yao Xue Xue Bao 1998;33:768-71.
10. Adithya BP, Vijayalakshmi M, Manoj PM. Development and validation of RP-HPLC method for the estimation of naftopidil in bulk and dosage form. Int J Res Pharm Chem 2012;2:816-21.
11. Adithya BP, Vijayalakshmi M, Mobeen SM, Mahesh J. A novel stability indicating RP-HPLC method for the estimation of Naftopidil. Inventi Rapid Pharm Anal Qual Assur 2013;2013.
12. Jain PS, Bobade KD, Bari PR, Girase DS, Surana SJ. Development and validation of analytical method for Naftopidil in human plasma by LC–MS/MS. Arabian J Chem 2013. Availably in: http://www.sciencedirect.
com/science/article/pii/S1878535213001846; accessed on 03/05/2014. 13. Kiran A, Khag geswar B, Kumar TM, Nerella R. Validated
UV-spectrophotometric method for the estimation of naftopidil in bulk and tablet formulation. Der Pharmacia Lettre 2013;5:1-7.
14. Van Leeuwen JA, Buydens LM, Vandeginste BG, Kateman G, Schoenmakers PJ, Mulholland M. RES, an expert system for the set-up and interpretation of a ruggedness test in HPLC method validation: Part 1: The ruggedness test in HPLC method validation. Chemometr Intell Lab Syst 1991;10:337-47.
15. Mulholland M. Ruggedness testing in analytical chemistry. Trends Analyt Chem 1988;7:383-9.
16. Ye C, Liu J, Ren F, Okafo N. Design of experiment and data analysis by JMP (SAS institute) in analytical method validation. J Pharm Biomed Anal 2000;23:581-9.
17. Hibbert DB. Experimental design in chromatography: A tutorial review. J Chromatogr B Analyt Technol Biomed Life Sci 2012;910:2-13. 18. den Brok MW, Nuijen B, Miranda E, Floriano P, Munt S, Manzanares I,
et al. Development and validation of a liquid chromatography-ultraviolet absorbance detection assay using derivatisation for the novel marine anticancer agent ES-285×HCl [(2S,3R)-2-amino-3-octadecanol hydrochloride] and its pharmaceutical dosage form. J Chromatogr A 2003;1020:251-8. 19. Quiming NS, Denola NL, Saito Y. Chromatographic behavior of uric
acid and methyl uric acids on a diol column in HILIC. Chromatographia 2008;67:507-15.