Arcohe Union Elementary
Elementary
2018-2019
Main Report
This report was prepared by WestEd, a research, development, and service agency, in collaboration with Duerr Evaluation Resources, under contract from the California Department of Education Coordinated School Health and Safety Office. For contract information, contact:
Hilva Chan
California Department of Education
Coordinated School Health and Safety Office 1430 N Street
Sacramento, CA 95814 [email protected] Recommended citation:
Arcohe Union Elementary School District. California Healthy Kids Survey, 2018-19: Main Report. San Francisco: WestEd Health and Justice Program for the California Department of Education.
Contents
Page
List of Tables . . . II
PREFACE . . . IV
Survey Module Administration . . . 1
A. Core Module Results . . . 2
1. Survey Sample . . . 2
2. Summary of Key Indicators . . . 3
3. Demographics . . . 4
4. School Performance, Supports, and Engagements . . . 5
5. Supports for Learning at School . . . 15
6. Fairness, Rule Clarity, and Positive Student Behavior . . . 17
7. School Violence, Victimization, and Safety . . . 21
8. Home Supports and Involvement in Schooling . . . 26
9. Alcohol and Other Drug (AOD) Use . . . 28
10. Tobacco Use . . . 29
11. Other Physical and Mental Health Risks . . . 30
12. Gender Breakdowns . . . 32
Appendix . . . 37
List of Tables
Page
Survey Module Administration . . . 1
1 CHKS Survey Modules Administered . . . 1
A. Core Module Results . . . 2
1. Survey Sample . . . 2
A1.1 Student Sample Characteristics . . . 2
2. Summary of Key Indicators . . . 3
A2.1 Key Indicators of School Climate and Student Well-Being . . . 3
3. Demographics . . . 4
A3.1 Gender of Sample . . . 4
A3.2 Number of Days Attending Afterschool Program . . . 4
4. School Performance, Supports, and Engagements . . . 5
A4.1 Perceived School Performance . . . 5
A4.2 Truancy, Past 30 Days . . . 5
A4.3 School Environment Scales . . . 6
A4.4 School Connectedness and Academic Motivation Scales . . . 7
A4.5 Caring Adults in School Scale Questions . . . 8
A4.6 High Expectations-Adults in School Scale Questions . . . 9
A4.7 Meaningful Participation at School Scale Questions . . . 10
A4.7 Meaningful Participation at School Scale Questions – Continued . . . 11
A4.8 School Connectedness Scale Questions . . . 12
A4.9 Academic Motivation Scale Questions . . . 13
A4.10 School Pride . . . 14
A4.11 Quality of School Physical Environment . . . 14
5. Supports for Learning at School . . . 15
A5.1 Social and Emotional Learning Supports Scale Questions . . . 15
A5.2 Students at School Motivated to Learn . . . 16
6. Fairness, Rule Clarity, and Positive Student Behavior . . . 17
A6.1 Fairness Scale Questions . . . 17
A6.2 Clarity of Rules . . . 18
A6.3 Positive Behavior Scale Questions . . . 19
A6.4 Students at School Well Behaved . . . 20
7. School Violence, Victimization, and Safety . . . 21
A7.1 Perceived Safety at or Outside of School . . . 21
A7.2 Violence Victimization Scale Questions . . . 22
A7.3 Been Teased About Body Image . . . 23
A7.4 Violence Perpetration Scale Questions . . . 23
A7.5 Weapons (Gun or Knife) on School Property, Past Year . . . 24
A7.6 Anti-Bullying Climate Scale Questions . . . 25
8. Home Supports and Involvement in Schooling . . . 26
A8.1 High Expectations-Adults at Home Scale Questions . . . 26
A8.2 Parent Involvement in Schooling Scale Questions . . . 27
9. Alcohol and Other Drug (AOD) Use . . . 28
A9.1 Use of Alcohol or Other Drugs, Lifetime . . . 28
A9.2 Perception of Health Risk of Alcohol and Marijuana Use . . . 28
10. Tobacco Use . . . 29
A10.1 Use of Cigarettes and E-Cigarettes, Lifetime . . . 29
A10.2 Perception of Health Risk of Cigarette and Electronic Cigarette Use . . . 29
11. Other Physical and Mental Health Risks . . . 30
A11.1 Frequency of Being Home Alone . . . 30
A11.2 Bedtime . . . 30
A11.3 Breakfast Consumption . . . 30
A11.4 Experienced Sadeness . . . 31
12. Gender Breakdowns . . . 32
A12.1 Key Indicators of School Climate and Student Well-Being by Gender . . . 32
A12.1 Key Indicators of School Climate and Student Well-Being by Gender – Continued . . 33
A12.2 Student Positive Behavior by Gender . . . 34
A12.3 School Safety-Related Indicators by Gender . . . 34
A12.4 Selected Alcohol and Drug Use Measures by Gender . . . 35
A12.5 Selected Tobacco Measures by Gender . . . 36
Appendix . . . 37
PREFACE
This report provides the detailed results for each question from the 2018-19 California Healthy Kids Survey (CHKS) for schools within the district. The CHKS, along with its two companion surveys— the California School Staff Survey (CSSS) and the California School Parent Survey (CSPS)—form the California Department of Education’s California School Climate, Health, and Learning Survey (CalSCHLS) System. CalSCHLS is the largest, most comprehensive effort in the nation to regularly assess students, staff, and parents at the local level to provide key data on school climate and safety, learning supports and barriers, stakeholder engagement, and youth development, health, and well-being. Exhibit 1, at the end of the Preface, presents the major school-related domains and constructs assessed by CalSCHLS. The Appendix lists the schools that administered the survey in the district and their response rates.
These surveys grew out of CDE’s commitment to helping schools promote the successful cognitive, social, emotional, and physical development of all students; create more positive, engaging school environments; and ensure college and career readiness. They provide a wealth of information to guide school improvement and Local Control and Accountability Plan (LCAP) efforts, particularly in regard to the state priorities of enhancing school climate, pupil engagement, parent involvement, and addressing the needs of vulnerable groups.
Factsheets, guidebooks, and other resources to help in understanding and using CHKS results are available for downloading from the CalSCHLS website (calschls.org), including Helpful Resources for Local Control and Accountability Plans (calschls.org/docs/lcap_cal_schls.pdf). The California Safe and Supportive Schools website (californiaS3.wested.org) provides information and tools helpful in implementing effective strategies to address the needs identified by the survey.
The CalSCHLS Regional Centers offer a Data Workshop to help identify local needs and develop action plans to meet those needs, including a Listening to Students Workshop for involving student voice in the process (see below).
THE SURVEY
The California Department of Education (CDE) has funded the CHKS since 1997 to provide data to assist schools in: (1) fostering safe and supportive school climates, social-emotional competencies, and engagement in learning; (2) preventing youth health-risk behaviors and other barriers to academic achievement; and (3) promoting positive youth development, resilience, and well-being. A thorough
HYPERLINK FEATURE
The digital version of this report has been hyperlinked. Click on the title of a section or a table in the List of Tables and you will be automatically directed to the actual content section or table in the report.
ALERT
Categories “High,” “Moderate,” and “Low” are included for some scales on the report for districts or schools to compare results to those from prior years. This is the last year these “High,” “Moderate,” and “Low” categories are provided in reports.
understanding of the scope and nature of these student behaviors, attitudes, experiences, and supports is essential for guiding school improvement and academic, prevention, and health programs.
The CHKS is not just a standalone instrument but a data collection system that districts can customize to meet local needs and interests. The elementary-school CHKS consists of a required general Core Module and a series of optional, supplementary topic-focused modules, including a Social and Emotional Health Module (SEHM), that districts can elect to administer. Districts may also add their own questions of local interest in a custom module. Table 1 indicates the modules administered by the district/school.
Core Module
As outlined in Exhibit 1, the Core Module consists of key questions, identified by an expert advisory committee, that are considered most important for schools to guide improvement of academic, health, and prevention programs and promote student achievement, positive development, and well-being. The primary focus of the survey is assessing student perceptions and experiences related to:
• school climate, connectedness, and learning engagement;
• perceived school safety and frequency of, and reasons for, harassment and bullying at school;
• developmental supports (protective factors) that promote positive academic, social, and emotional outcomes: experiences of caring adult relationships, high expectations, and opportunities for meaningful participation at school;
• supports for social-emotional learning and positive behavior; and
• health-related and behavioral learning barriers (e.g., substance use, violence at school, physical health, mental health).
What’s New? For 2018-19, the only changes to the survey are the following improvements: • a new question asking about usual bedtime to assess nighttime sleep quality;
• added a question asking about how often the student feels sad to assess mental health; and • included a new question asking about the upkeep of school facilities.
Supplementary Social Emotional Health Module (SEHM)
The SEHM greatly enhances the value of the CHKS as a strength-based assessment of positive emotions, engagement, ability to build and maintain relationships, and other social-emotional competencies linked to student mental health and well-being, academic success, and college and career readiness. It includes 35 items that capture the totality of core adolescent psychological assets. The combination of the SEHM and Core Module yields a comprehensive set of data to inform decisions about mental health and social-emotional learning programs.
SURVEY ADMINISTRATION AND SAMPLE
School staff administered the survey, following detailed instructions provided by CDE that were designed to assure the protection of all student and parental rights to privacy and to maintain confidentiality. Students were surveyed only with the consent of parents or guardians. Student participation was voluntary, anonymous, and confidential.
• Table A1.1 gives the target sample of students and the final number and percent of students who completed the survey (the participation response rate).
• The Appendix lists all the elementary schools in the district that were eligible to participate in the survey and the percentage of students enrolled in each of them that completed the survey.
THE REPORT
The survey results are reported in tables, organized by topic, that provide the percentages responding to each question response option by grade level. Because it is just as important to identify the positive behaviors of youth as it is to identify the risks they face, the tables reporting risk-behavior data include the percentages of youth who responded negatively (did not engage in the behavior). Percentages are rounded to the nearest whole number.
UNDERSTANDING AND USING THE DATA
Care must be taken to understand the factors that can impact the quality, validity, and generalizability of the results. These include changes that occur in survey content, administration, and/or sample characteristics between administrations. The following are a few of the key issues that should be kept in mind. A more detailed discussion of these topics can be found in the CHKS Guidebook to Data Use and Dissemination (data.calschls.org/resources/chks_guidebook_3_datause.pdf).
Representativeness
Among the most important factors affecting the quality of survey results is the level of student participation. The validity and representativeness of the results will be adversely affected if the student response rate is lower than 70 percent. Even if the response rate is low, the results provide an indication of what those students who did respond felt about the school and their experiences and behavior.
Changes Between Survey Administrations
Many factors besides real changes in behavior, attitudes, or experiences among students may account for changes in results from administration to administration. Changes may be due to differences over time in the characteristics or size of the sample of students who completed the survey, changes in the questions themselves, or differences between time periods in which the survey was administered (e.g., some risk behaviors tend to increase as students age, or may increase during holidays or social events).
RESOURCES
CalSCHLS.org contains numerous guidebooks and other resources for using and understanding survey results.
• CHKS Guidebook to Data Use and Dissemination provides step-by-step instructions on how to interpret survey results and effectively disseminate them
(data.calschls.org/resources/chks_guidebook_3_datause.pdf).
• CHKS factsheets analyze key topics at the state level, show how data variables are related, and offer suggestions for how data can be analyzed at the local level (calschls.org/resources/factsheets/).
• Assessing School Climate describes the value of the CalSCHLS student, staff, and parent surveys for assessing school climate, listing constructs and individual indicators (data.calschls.org/resources/Cal-SCHLS_AssessingClimate2013-14.pdf).
• Making Sense of School Climate provides a discussion of CalSCHLS survey items that relate to school climate
(data.calschls.org/resources/S3_schoolclimateguidebook_final.pdf).
• Using CalSCHLS to Assess Social-Emotional Learning and Health describes how the CHKS Core and Social Emotional Health Module (SEHM) provide a comprehensive profile of student social-emotional competency (learning) and health, and the related supports schools provide, including questions aligned with the framework developed by the Collaborative for Academic, Social, and Emotional Learning (CASEL)
(data.calschls.org/resources/CalSCHLS_AssessSELH.pdf). The staff survey provides data on the perception of adults in the school on social-emotional service needs and provision.
• Helpful Resources for Local Control and Accountability Plans describes how survey items align with LCAP priorities and indicators (calschls.org/docs/lcap_cal_schls.pdf). Also available is an LCAP-related PowerPoint presentation
(calschls.org/site/assets/files/1036/cal-schls-lcap_schoolclimatev6-1.pptx).
• The School Climate Connection Newsletter provides monthly announcements of resources, tools, webinars and workshops, and research. Sign up on calschls.org/about.
• CDE’s California Safe and Supportive Schools website (CaliforniaS3.wested.org) contains a wealth of information and tools related to school climate improvement and social-emotional learning. It includes factsheets analyzing CalSCHLS data and What Works Briefs that provide guidance on strategies to implement.
• The CalSCHLS Item Crosswalk (calschls.org/resources/#survey_resources_and_tools) is a handy table listing all the constructs and questions that are on two or more of the CalSCHLS surveys, along with the report table number where results can be found, to assist in the comparison of findings among students, staff, and parents.
NEXT STEPS
Receiving this report is just a beginning step in a data-driven decision-making process of continuous improvement. The following describes some additional steps you should take and some custom services (additional fees apply) available from the CalSCHLS Regional Centers. These will help in fostering effective use of the results and provide additional information to support school and program improvement efforts and the LCAP process.
Engage Students, Staff, and Parents in Reviewing the Results and Action Planning
Engage students, parents, and school/community stakeholders in reviewing and exploring the meaning of the results. Obtain their input into how the school might better meet the identified needs. Engage them in developing a detailed action plan to guide school/community collaborative efforts. This communicates to stakeholders that you value their input into how to improve the school/community and gives them an opportunity for meaningful participation.
WestEd staff can conduct a Data Use Action Planning Workshop designed to identify local needs based on the survey results and engage adult stakeholders in developing a detailed plan and timetable for
meeting those needs using evidence-based strategies. For more information, contact your CalSCHLS Regional Center 888.841.7536 or email [email protected].
Compare Results with Other Data
The value of your CHKS results will be greatly enhanced if examined in the context of the following sources of related data.
• Staff and Parent Surveys. If your school district(s) have administered the CalSCHLS school staff and parent surveys, obtain these results and compare them to those provided by students. It is important to determine how consistent are student, staff, and parent perceptions and experiences. To facilitate these comparisons, the CalSCHLS Item Crosswalk (calschls.org/resources/#survey_resources_and_tools) lists all the constructs and questions that are on two or more of the CalSCHLS surveys, along with the report table number where results can be found. If the district(s) did not administer these companion surveys, urge them to do so next time.
• Secondary CHKS Results. Examine how the results for 5th graders compare with those
for 7th, 9th, and 11th graders if your district(s) also administered the CHKS at these school levels. The elementary, middle, and high school surveys contain common indicators that will enable you to gain a sense of the developmental trajectory in these indicators and explore what programs at the elementary and middle-school levels might help mitigate problems that are evident among older students.
• Other Data. Examine how the results compare with other youth data collected within the district that relate to the variables assessed. Other relevant school-related data include discipline referrals, school demographic information, school vandalism costs, and behavioral observations in classrooms.
• Similar District and Statewide Results. The aggregated results from the 2015-2017 statewide CHKS elementary survey administration can be downloaded from the CalSCHLS website (calschls.org/docs/statewide_1517_elem_chks1.pdf) to help interpret your results. If there is a school district that you consider similar to your own, you can also check to see if they have administered the survey and download the results for comparison (calschls.org/reports-data/search-lea-reports/). How you compare to state and district results can provide some context for your results, but the most important consideration is what your own results say about the students in your school/community.
Data Workshop
To assist in your review of the survey results, you can request your CalSCHLS Regional Center to conduct a structured, customized Data Workshop. In this workshop, a survey specialist works with district stakeholders to promote better understanding of the results and to identify local needs that need to be addressed. The workshops can also include engaging stakeholders in developing a detailed Action Plan and timetable for meeting those needs using evidence-based strategies. For more information, contact your CalSCHLS TA Center (888.841.7536) or email [email protected].
Request Additional Reports and Data
As you review your data with stakeholders, you may find that additional data needs emerge. The following custom services are available through the CalSCHLS Regional Centers to help delve more deeply into your survey results and foster more effective use of the results in support of school and program improvement efforts and the LCAP process.
School Reports and School Climate Report Cards
If the schools in the district vary significantly in demographics, programs, or other characteristics, consider requesting individual reports for each school. Two types of reports are available:
• A full report with all the survey results
• A short, user-friendly, graphic School Climate Report Card that provides results across eight domains of school climate and provides an overall School Climate Index score based on those domains (calschls.org/reports-data/#slcr)
District School Climate Report Card
For districts that survey all their schools, a district-level School Climate Report Card can be requested. This is a powerful, useful tool for guiding efforts to meet the school climate and pupil engagement priorities for the Local Control and Accountability Plan.
Disaggregated Report
The staff of the CalSCHLS Regional Centers can produce reports that show how results vary by subgroups. For example, what are the characteristics of youth who are low in perceived safety, school connectedness, or academic motivation compared those who are high? This is particularly important given the LCAP requirements to address these needs. This helps in understanding the meaning of the results and developing interventions that target groups most in need.
Additional Analysis of Data
The complete dataset is available electronically for additional analysis (CalSCHLS.org/reports-data). The dataset enables analyses of patterns in the results, how they are interrelated, and how they vary by different subgroups of students and across schools within a district. You can also request an analysis by WestEd staff of any topic of interest.
Add Questions to Your Next Surveys
Determine what additional information is needed to guide school improvement efforts and add questions to your next CHKS, staff, or parent survey. All three surveys are designed so that schools can add additional questions to help them conduct a more individualized and comprehensive assessment.
For more information about survey planning or technical assistance in understanding survey results and developing effective action plans to address identified needs, call the CalSCHLS helpline (888.841.7536) or email [email protected].
Exhibit 1
Major School-Related Domains and Constructs Assessed by CalSCHLS in Elementary Schools
Student Core Student Social Emotional Health Staff Survey Parent Survey Student Well-Being
Academic mindset
Academic motivation
Academic performance
Alcohol, tobacco, and drug use
Attendance
Collaboration
Empathy
Gratitude
Optimism
Perceived safety
Persistence
Problem solving
School connectedness
Self-efficacy
Sleep duration (bedtime)
Social-emotional competencies and health
Violence and victimization (bullying)
Zest
School Climate
Academic rigor and norms
High expectations
Meaningful participation and decision-making
Parent involvement
Quality of physical environment
Relationships among staff
Relationships among students
Relationships between students and staff
Respect for diversity and cultural sensitivity
Teacher and other supports for learning
School Climate Improvement Practices
Bullying prevention
Discipline and order (policies, enforcement)
Services and policies to address student needs
Social-emotional/behavioral supports
Staff supports
ACKNOWLEDGMENTS
The CHKS and this report were developed by WestEd, in collaboration with Duerr Evaluation Resources, under contract from the California Department of Education, Coordinated School Health and Safety Office. Special recognition to Cindy Zheng, at WestEd, who oversees the generation of CalSCHLS reports and data quality assurance.
Gregory Austin, Ph.D. Thomas Hanson, Ph.D. CalSCHLS Co-Directors, WestEd
Tom Herman Administrator, Coordinated School Health and Safety Office California Department of Education
Survey Module Administration
Table 1
CHKS Survey Modules Administered
Survey Module Administered
A. Core (Required) X
B. Cal-Well Module
C. District Afterschool Module (DASM)
D. Gang Risk Awareness Module (GRAM)
E. Military-Connected School Module
F. Social Emotional Health Module (SEHM)
G. Supplemental Health Module
Z. Custom Questions
Arcohe Union Elementary 2018-19
Core Module Results
1. Survey Sample
Table A1.1
Student Sample Characteristics
Grade 3 Grade 4 Grade 5 Grade 6
Student Sample Size
Target sample – – 38 55
Final number – – 22 1
Response Rate – – 58% 2%
Arcohe Union Elementary 2018-19
2. Summary of Key Indicators
Table A2.1
Key Indicators of School Climate and Student Well-Being
Grade 3 Grade 4 Grade 5 Grade 6 Table
% % % %
School Engagement and Supports
School connectedness† – – 85 A4.4
Academic motivation† – – 98 A4.4
Caring adults in school† – – 73 A4.3
High expectations-adults in school† – – 85 A4.3
Meaningful participation† – – 46 A4.3
Facilities upkeep† – – 71 A4.11
Parent involvement in schooling† – – 77 A8.2
Social and emotional learning supports† – – 79 A5.1
Anti-bullying climate† – – 82 A7.6
School Safety
Feel safe at school† – – 90 A7.1
Been hit or pushed – – 43 A7.2
Mean rumors spread about you – – 45 A7.2
Called bad names or target of mean jokes – – 48 A7.2
Saw a weapon at school¶ – – 24 A7.5
School Disciplinary Environment
Students well behaved† – – 62 A6.4
Students treated fairly when break rules† – – 53 A6.1
Students treated with respect† – – 81 A6.1
Substance Use and Mental Health
Alcohol or drug use – – 19 A9.1
Marijuana use – – 0 A9.1
Cigarette use – – 0 A10.1
E-cigarette use – – 0 A10.1
Experienced sadness† – – 24 A11.4
Notes: Cells are empty if there are less than 10 respondents.
†Average percent of respondents reporting “Yes, most of the time” or “Yes, all of the time.”
¶Past 12 months.
Arcohe Union Elementary 2018-19
3. Demographics
Table A3.1
Gender of Sample
Grade 3 Grade 4 Grade 5 Grade 6
% % % %
Female – – 73
Male – – 27
Question ES A.2: Are you female or male?
Note: Cells are empty if there are less than 10 respondents.
Table A3.2
Number of Days Attending Afterschool Program
Grade 3 Grade 4 Grade 5 Grade 6
% % % %
0 days – – 86
1 day – – 0
2 days – – 5
3 days – – 5
4 days – – 0
5 days – – 5
Question ES A.6: How many days a week do you usually go to your school’s afterschool program? Note: Cells are empty if there are less than 10 respondents.
Arcohe Union Elementary 2018-19
4. School Performance, Supports, and Engagements
Table A4.1
Perceived School Performance
Grade 3 Grade 4 Grade 5 Grade 6
% % % %
One of the best students – – 19
Better than most students – – 38
About the same as others – – 33
Don’t do as well as most others – – 10
Question ES A.23: How well do you do in your schoolwork? Note: Cells are empty if there are less than 10 respondents.
Table A4.2
Truancy, Past 30 Days
Grade 3 Grade 4 Grade 5 Grade 6
% % % %
I did not miss any days of school – – 48
1 day – – 24
2 days – – 10
3 or more days – – 19
Question ES A.4: In the past 30 days, how often did you miss an entire day of school for any reason? Note: Cells are empty if there are less than 10 respondents.
Arcohe Union Elementary 2018-19
Table A4.3
School Environment Scales
Grade 3 Grade 4 Grade 5 Grade 6 Table
% % % %
Total school supports
Average reporting “Yes, most of the time” or
“Yes, all of the time” – – 69
High – – 70
Moderate – – 20
Low – – 10
Caring adults in school
Average reporting “Yes, most of the time” or
“Yes, all of the time” – – 73 A4.5
High – – 65
Moderate – – 25
Low – – 10
High expectations-adults in school
Average reporting “Yes, most of the time” or
“Yes, all of the time” – – 85 A4.6
High – – 71
Moderate – – 19
Low – – 10
Meaningful participation at school
Average reporting “Yes, most of the time” or
“Yes, all of the time” – – 46 A4.7
High – – 24
Moderate – – 48
Low – – 29
Notes: Cells are empty if there are less than 10 respondents.
Table numbers refer to tables with item-level results for the survey questions that comprise each scale.
Respondents were categorized as being “High,” “Moderate,” and “Low” based on the averages of the questions that comprise each scale. The response options for the survey questions that make up each scale range from “No, never” (1), “Yes, some of the time” (2), “Yes, most of the time” (3), and “Yes, all of the time” (4). Students were classified as “High” if their average question response was greater than 3; “Moderate” if their average question response was greater than or equal to 2 and less than or equal to 3; and “Low” if their average question response was less than 2.
Arcohe Union Elementary 2018-19
Table A4.4
School Connectedness and Academic Motivation Scales
Grade 3 Grade 4 Grade 5 Grade 6 Table
% % % %
School connectedness
Average reporting “Yes, most of the time” or
“Yes, all of the time” – – 85 A4.8
High – – 71
Moderate – – 29
Low – – 0
Academic motivation
Average reporting “Yes, most of the time” or
“Yes, all of the time” – – 98 A4.9
High – – 67
Moderate – – 29
Low – – 5
Notes: Cells are empty if there are less than 10 respondents.
Table numbers refer to tables with item-level results for the survey questions that comprise each scale.
Respondents were categorized as being “High,” “Moderate,” and “Low” based on the averages of the questions that comprise each scale. The response options for the survey questions that make up each scale range from “No, never” (1), “Yes, some of the time” (2), “Yes, most of the time” (3), and “Yes, all of the time” (4). The following thresholds were used to classify question averages into “High,” “Moderate,” and “Low” categories:
School Connectedness (High:>3; Moderate:≥2 and≤3; Low: <2).
Academic Motivation (High:>3.5; Moderate:≥3 and≤3.5; Low:<3).
Arcohe Union Elementary 2018-19
Table A4.5
Caring Adults in School Scale Questions
Grade 3 Grade 4 Grade 5 Grade 6
% % % %
Caring adults in school
Average reporting “Yes, most of the time” or “Yes,
all of the time” – – 73
Do the teachers and other grown-ups at school...
care about you?
No, never – – 5
Yes, some of the time – – 14
Yes, most of the time – – 19
Yes, all of the time – – 62
listen when you have something to say?
No, never – – 5
Yes, some of the time – – 15
Yes, most of the time – – 35
Yes, all of the time – – 45
make an effort to get to know you?
No, never – – 5
Yes, some of the time – – 35
Yes, most of the time – – 25
Yes, all of the time – – 35
Question ES A.16, 24, 27: Do the teachers and other grown-ups at school care about you?... Do the teachers and other grown-ups at school listen when you have something to say?... Do the teachers and other grown-ups at school make an effort to get to know you?
Note: Cells are empty if there are less than 10 respondents.
Arcohe Union Elementary 2018-19
Table A4.6
High Expectations-Adults in School Scale Questions
Grade 3 Grade 4 Grade 5 Grade 6
% % % %
High expectations-adults in school
Average reporting “Yes, most of the time” or “Yes,
all of the time” – – 85
Do the teachers and other grown-ups at school...
tell you when you do a good job?
No, never – – 5
Yes, some of the time – – 10
Yes, most of the time – – 30
Yes, all of the time – – 55
believe that you can do a good job?
No, never – – 5
Yes, some of the time – – 10
Yes, most of the time – – 33
Yes, all of the time – – 52
want you to do your best?
No, never – – 0
Yes, some of the time – – 14
Yes, most of the time – – 10
Yes, all of the time – – 76
Question ES A.17, 25, 28: Do the teachers and other grown-ups at school tell you when you do a good job?... Do the teachers and other grown-ups at school believe that you can do a good job? Do the teachers and other grown-ups at school want you to do your best?
Note: Cells are empty if there are less than 10 respondents.
Arcohe Union Elementary 2018-19
Table A4.7
Meaningful Participation at School Scale Questions
Grade 3 Grade 4 Grade 5 Grade 6
% % % %
Meaningful participation at school
Average reporting “Yes, most of the time” or “Yes,
all of the time” – – 46
Are you given a chance to help decide school activities or rules?
No, never – – 19
Yes, some of the time – – 57
Yes, most of the time – – 14
Yes, all of the time – – 10
Do the teachers and other grown-ups at school ask you about your ideas?
No, never – – 15
Yes, some of the time – – 35
Yes, most of the time – – 25
Yes, all of the time – – 25
Do the teachers and other grown-ups give you a chance to solve school problems?
No, never – – 24
Yes, some of the time – – 24
Yes, most of the time – – 29
Yes, all of the time – – 24
Do you get to do interesting activities at school?
No, never – – 0
Yes, some of the time – – 19
Yes, most of the time – – 38
Yes, all of the time – – 43
Question ES A.15, 18-20: Are you given a chance to help decide school activities or rules?... Do the teachers and other grown-ups at school ask you about your ideas?... Do the teachers and other grown-ups give you a chance to solve school problems?... Do you get to do interesting activities at school?
Note: Cells are empty if there are less than 10 respondents.
Arcohe Union Elementary 2018-19
Table A4.7
Meaningful Participation at School Scale Questions – Continued
Grade 3 Grade 4 Grade 5 Grade 6
% % % %
Are you given a chance to help decide class activities or rules?
No, never – – 29
Yes, some of the time – – 48
Yes, most of the time – – 19
Yes, all of the time – – 5
Do your teachers ask you what you want to learn about?
No, never – – 33
Yes, some of the time – – 43
Yes, most of the time – – 24
Yes, all of the time – – 0
Do you do things to be helpful at school?
No, never – – 5
Yes, some of the time – – 29
Yes, most of the time – – 24
Yes, all of the time – – 43
Question ES A.21, 22, 26: Are you given a chance to help decide class activities or rules?... Do your teachers ask you what you want to learn about?... Do you do things to be helpful at school?
Note: Cells are empty if there are less than 10 respondents.
Arcohe Union Elementary 2018-19
Table A4.8
School Connectedness Scale Questions
Grade 3 Grade 4 Grade 5 Grade 6
% % % %
School connectedness
Average reporting “Yes, most of the time” or “Yes,
all of the time” – – 85
Do you feel close to people at school?
No, never – – 0
Yes, some of the time – – 29
Yes, most of the time – – 62
Yes, all of the time – – 10
Are you happy to be at this school?
No, never – – 0
Yes, some of the time – – 14
Yes, most of the time – – 33
Yes, all of the time – – 52
Do you feel like you are part of this school?
No, never – – 0
Yes, some of the time – – 10
Yes, most of the time – – 43
Yes, all of the time – – 48
Do teachers treat students fairly at school?
No, never – – 10
Yes, some of the time – – 5
Yes, most of the time – – 38
Yes, all of the time – – 48
Do you feel safe at school?
No, never – – 0
Yes, some of the time – – 10
Yes, most of the time – – 38
Yes, all of the time – – 52
Question ES A.8-10, 13, 58: Do you feel close to people at school?... Are you happy to be at this school?... Do you feel like you are part of this school?... Do teachers treat students fairly at school?... Do you feel safe at school? Note: Cells are empty if there are less than 10 respondents.
Arcohe Union Elementary 2018-19
Table A4.9
Academic Motivation Scale Questions
Grade 3 Grade 4 Grade 5 Grade 6
% % % %
Academic motivation
Average reporting “Yes, most of the time” or “Yes,
all of the time” – – 98
Do you finish all your class assignments?
No, never – – 0
Yes, some of the time – – 5
Yes, most of the time – – 24
Yes, all of the time – – 71
When you get a bad grade, do you try even harder the next time?
No, never – – 0
Yes, some of the time – – 0
Yes, most of the time – – 5
Yes, all of the time – – 95
Do you keep working and working on your schoolwork until you get it right?
No, never – – 0
Yes, some of the time – – 5
Yes, most of the time – – 52
Yes, all of the time – – 43
Do you keep doing your classwork even when it’s really hard for you?
No, never – – 0
Yes, some of the time – – 0
Yes, most of the time – – 10
Yes, all of the time – – 90
Question ES A.41-44: Do you finish all your class assignments?... When you get a bad grade, do you try even harder the next time?... Do you keep working and working on your schoolwork until you get it right?... Do you keep doing your classwork even when it’s really hard for you?
Note: Cells are empty if there are less than 10 respondents.
Arcohe Union Elementary 2018-19
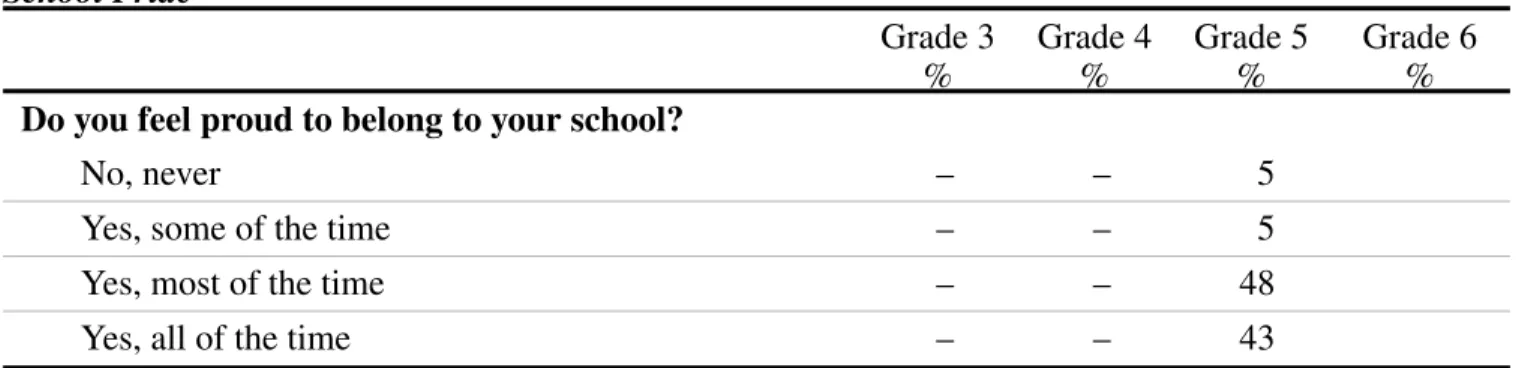
Table A4.10 School Pride
Grade 3 Grade 4 Grade 5 Grade 6
% % % %
Do you feel proud to belong to your school?
No, never – – 5
Yes, some of the time – – 5
Yes, most of the time – – 48
Yes, all of the time – – 43
Question ES A.11: Do you feel proud to belong to your school? Note: Cells are empty if there are less than 10 respondents.
Table A4.11
Quality of School Physical Environment
Grade 3 Grade 4 Grade 5 Grade 6
% % % %
Is your school building neat and clean?
No, never – – 0
Yes, some of the time – – 29
Yes, most of the time – – 43
Yes, all of the time – – 29
Question ES A.14: Is your school building neat and clean? Note: Cells are empty if there are less than 10 respondents.
Arcohe Union Elementary 2018-19
5. Supports for Learning at School
Table A5.1
Social and Emotional Learning Supports Scale Questions
Grade 3 Grade 4 Grade 5 Grade 6
% % % %
Social and emotional learning supports
Average reporting “Yes, most of the time” or “Yes,
all of the time” – – 79
Does your school...
help students resolve conflicts with one another?
No, never – – 19
Yes, some of the time – – 10
Yes, most of the time – – 29
Yes, all of the time – – 43
teach students to understand how other students think and feel?
No, never – – 10
Yes, some of the time – – 15
Yes, most of the time – – 45
Yes, all of the time – – 30
teach students to feel responsible for how they act?
No, never – – 10
Yes, some of the time – – 5
Yes, most of the time – – 57
Yes, all of the time – – 29
teach students to care about each other and treat each other with respect?
No, never – – 0
Yes, some of the time – – 15
Yes, most of the time – – 40
Yes, all of the time – – 45
Question ES A.34-37: Does your school help students resolve conflicts with one another?... Does your school teach students to understand how other students think and feel?... Does your school teach students to feel responsible for how they act?... Does your school teach students to care about each other and treat each other with respect? Note: Cells are empty if there are less than 10 respondents.
Arcohe Union Elementary 2018-19
Table A5.2
Students at School Motivated to Learn
Grade 3 Grade 4 Grade 5 Grade 6
% % % %
No, never – – 0
Yes, some of the time – – 38
Yes, most of the time – – 57
Yes, all of the time – – 5
Question ES A.12: Are the students at your school motivated to learn? Note: Cells are empty if there are less than 10 respondents.
Arcohe Union Elementary 2018-19
6. Fairness, Rule Clarity, and Positive Student Behavior
Table A6.1
Fairness Scale Questions
Grade 3 Grade 4 Grade 5 Grade 6
% % % %
Fairness
Average reporting “Yes, most of the time” or “Yes,
all of the time” – – 73
Do teachers treat students fairly at school?
No, never – – 10
Yes, some of the time – – 5
Yes, most of the time – – 38
Yes, all of the time – – 48
Are the school rules fair?
No, never – – 10
Yes, some of the time – – 20
Yes, most of the time – – 35
Yes, all of the time – – 35
Do teachers and other grown-ups at school treat students with respect?
No, never – – 10
Yes, some of the time – – 10
Yes, most of the time – – 33
Yes, all of the time – – 48
Are students treated fairly when they break school rules?
No, never – – 16
Yes, some of the time – – 32
Yes, most of the time – – 47
Yes, all of the time – – 5
Question ES A.13, 29-31: Do teachers treat students fairly at school?... Are the school rules fair?... Do teachers and other grown-ups at school treat students with respect?... Are students treated fairly when they break school rules?
Note: Cells are empty if there are less than 10 respondents.
Arcohe Union Elementary 2018-19
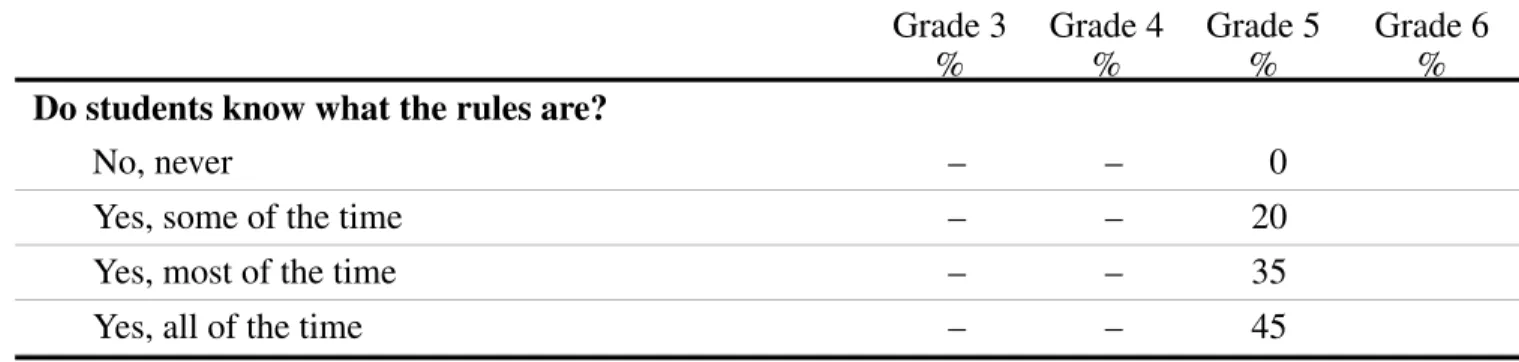
Table A6.2 Clarity of Rules
Grade 3 Grade 4 Grade 5 Grade 6
% % % %
Do students know what the rules are?
No, never – – 0
Yes, some of the time – – 20
Yes, most of the time – – 35
Yes, all of the time – – 45
Question ES A.33: Do students know what the rules are?
Note: Cells are empty if there are less than 10 respondents.
Arcohe Union Elementary 2018-19
Table A6.3
Positive Behavior Scale Questions
Grade 3 Grade 4 Grade 5 Grade 6
% % % %
Positive behavior
Average reporting “Yes, most of the time” or “Yes,
all of the time” – – 96
Do you follow the classroom rules?
No, never – – 0
Yes, some of the time – – 0
Yes, most of the time – – 43
Yes, all of the time – – 57
Do you follow the playground rules at recess and lunch times?
No, never – – 0
Yes, some of the time – – 5
Yes, most of the time – – 43
Yes, all of the time – – 52
Do you listen when your teacher is talking?
No, never – – 0
Yes, some of the time – – 5
Yes, most of the time – – 29
Yes, all of the time – – 67
Are you nice to other students?
No, never – – 0
Yes, some of the time – – 5
Yes, most of the time – – 38
Yes, all of the time – – 57
Question ES A.45-48: Do you follow the classroom rules?... Do you follow the playground rules at recess and lunch times?... Do you listen when your teacher is talking?... Are you nice to other students?
Notes: Cells are empty if there are less than 10 respondents.
Arcohe Union Elementary 2018-19
Table A6.4
Students at School Well Behaved
Grade 3 Grade 4 Grade 5 Grade 6
% % % %
Are students at this school well behaved?
No, never – – 0
Yes, some of the time – – 38
Yes, most of the time – – 62
Yes, all of the time – – 0
Question ES A.32: Are students at this school well behaved?
Note: Cells are empty if there are less than 10 respondents.
Arcohe Union Elementary 2018-19
7. School Violence, Victimization, and Safety
Table A7.1
Perceived Safety at or Outside of School
Grade 3 Grade 4 Grade 5 Grade 6
% % % %
Do you feel safe at school?
No, never – – 0
Yes, some of the time – – 10
Yes, most of the time – – 38
Yes, all of the time – – 52
Do you feel safe on your way to and from school?
No, never – – 0
Yes, some of the time – – 5
Yes, most of the time – – 38
Yes, all of the time – – 57
Question ES A.58, 59: Do you feel safe at school?... Do you feel safe on your way to and from school? Note: Cells are empty if there are less than 10 respondents.
Arcohe Union Elementary 2018-19
Table A7.2
Violence Victimization Scale Questions
Grade 3 Grade 4 Grade 5 Grade 6
% % % %
Violence victimization
Average reporting “Yes” – – 46
Do other kids hit or push you at school when they are not just playing around?
No, never – – 57
Yes, some of the time – – 33
Yes, most of the time – – 10
Yes, all of the time – – 0
Do other kids at school spread mean rumors or lies about you?
No, never – – 55
Yes, some of the time – – 40
Yes, most of the time – – 5
Yes, all of the time – – 0
Do other kids at school call you bad names or make mean jokes about you?
No, never – – 52
Yes, some of the time – – 43
Yes, most of the time – – 5
Yes, all of the time – – 0
Question ES A.52, 53, 55: Do other kids hit or push you at school when they are not just playing around?... Do other kids at school spread mean rumors or lies about you?... Do other kids at school call you bad names or make mean jokes about you?
Note: Cells are empty if there are less than 10 respondents.
Arcohe Union Elementary 2018-19
Table A7.3
Been Teased About Body Image
Grade 3 Grade 4 Grade 5 Grade 6
% % % %
No – – 57
Yes – – 43
Question ES A.61: Have other kids at school ever teased you about what your body looks like? Note: Cells are empty if there are less than 10 respondents.
Table A7.4
Violence Perpetration Scale Questions
Grade 3 Grade 4 Grade 5 Grade 6
% % % %
Violence perpetration
Average reporting “1 or more times” – – 33
Have hit or pushed other kids
0 times – – 52
1 time – – 33
2 times – – 10
3 or more times – – 5
Have said mean things about other students or called them bad names
0 times – – 62
1 time – – 19
2 times – – 10
3 or more times – – 10
Have spread mean rumors about other kids
0 times – – 90
1 time – – 0
2 times – – 10
3 or more times – – 0
Question ES A.49-51: During the past year, how many times have you hit or pushed other kids at school when you were not playing around?... During the past year, how many times have you spread mean rumors or lies about other kids at school?... During the past year, how many times at school have you said mean things about other students or called them bad names?
Note: Cells are empty if there are less than 10 respondents.
Arcohe Union Elementary 2018-19
Table A7.5
Weapons (Gun or Knife) on School Property, Past Year
Grade 3 Grade 4 Grade 5 Grade 6
% % % %
Brought a gun or knife to school
No – – 100
Yes – – 0
Saw another kid with a gun or knife at school
No – – 76
Yes – – 24
Question ES A.54, 56: During the past year, did you ever bring a gun or knife to school?... During the past year, have you ever seen another kid with a gun or knife at school?
Note: Cells are empty if there are less than 10 respondents.
Arcohe Union Elementary 2018-19
Table A7.6
Anti-Bullying Climate Scale Questions
Grade 3 Grade 4 Grade 5 Grade 6
% % % %
Anti-bullying climate
Average reporting “Yes, most of the time” or “Yes,
all of the time” – – 82
Teachers and other grown-ups make it clear that bullying is not allowed.
No, never – – 0
Yes, some of the time – – 5
Yes, most of the time – – 33
Yes, all of the time – – 62
If you tell a teacher that you’ve been bullied, the teacher will do something to help.
No, never – – 5
Yes, some of the time – – 10
Yes, most of the time – – 33
Yes, all of the time – – 52
Students at your school try to stop bullying when they see it happening.
No, never – – 10
Yes, some of the time – – 25
Yes, most of the time – – 45
Yes, all of the time – – 20
Question ES A.38-40: Do the teachers and other grown-ups make it clear that bullying is not allowed?... If you tell a teacher that you’ve been bullied, will the teacher do something to help?... Do students at your school try to stop bullying when they see it happening?
Note: Cells are empty if there are less than 10 respondents.
Arcohe Union Elementary 2018-19
8. Home Supports and Involvement in Schooling
Table A8.1
High Expectations-Adults at Home Scale Questions
Grade 3 Grade 4 Grade 5 Grade 6
% % % %
High expectations-adults at home
Average reporting “Yes, most of the time” or “Yes,
all of the time” – – 93
Does a parent or some other grown-up at home... believe that you can do a good job?
No, never – – 0
Yes, some of the time – – 10
Yes, most of the time – – 19
Yes, all of the time – – 71
want you to do your best?
No, never – – 0
Yes, some of the time – – 5
Yes, most of the time – – 5
Yes, all of the time – – 90
Question ES A.72, 73: Does a parent or some other grown-up at home believe that you can do a good job?... Does a parent or some other grown-up at home want you to do your best?
Note: Cells are empty if there are less than 10 respondents.
Arcohe Union Elementary 2018-19
Table A8.2
Parent Involvement in Schooling Scale Questions
Grade 3 Grade 4 Grade 5 Grade 6
% % % %
Parent involvement in schooling
Average reporting “Yes, most of the time” or “Yes,
all of the time” – – 77
Does a parent or some other grown-up at home... care about your schoolwork?
No, never – – 5
Yes, some of the time – – 0
Yes, most of the time – – 14
Yes, all of the time – – 81
ask if you did your homework?
No, never – – 5
Yes, some of the time – – 10
Yes, most of the time – – 24
Yes, all of the time – – 62
check your homework?
No, never – – 33
Yes, some of the time – – 29
Yes, most of the time – – 24
Yes, all of the time – – 14
ask you about school?
No, never – – 10
Yes, some of the time – – 5
Yes, most of the time – – 24
Yes, all of the time – – 62
ask you about your grades?
No, never – – 10
Yes, some of the time – – 10
Yes, most of the time – – 24
Yes, all of the time – – 57
Question ES A.71, 74-77: Does a parent or some other grown-up at home care about your schoolwork?... Does a parent or some other grown-up at home ask if you did your homework?... Does a parent or some other grown-up at home check your homework?... Does a parent or some other grown-up at home ask you about school?... Does a parent or some other grown-up at home ask you about your grades?
Note: Cells are empty if there are less than 10 respondents.
Arcohe Union Elementary 2018-19
9. Alcohol and Other Drug (AOD) Use
Table A9.1
Use of Alcohol or Other Drugs, Lifetime
Grade 3 Grade 4 Grade 5 Grade 6
% % % %
Alcohol, one or two sips – – 19
Alcohol, a full glass – – 0
Inhalants (to get high) – – 0
Marijuana (smoke, vape, eat, or drink) – – 0
None of the above – – 81
Any of the above – – 19
Question ES A.64-66: Have you ever drunk beer, wine, or other alcohol?... Have you ever sniffed something through your nose to get “high?”... Have you ever used any marijuana (smoke, vape, eat, or drink)?
Note: Cells are empty if there are less than 10 respondents.
Table A9.2
Perception of Health Risk of Alcohol and Marijuana Use
Grade 3 Grade 4 Grade 5 Grade 6
% % % %
Alcohol
No, not bad – – 5
Yes, a little bad – – 48
Yes, very bad – – 48
Marijuana (smoke, vape, eat, or drink)
No, not bad – – 0
Yes, a little bad – – 5
Yes, very bad – – 81
I don’t know what marijuana is – – 14
Question ES A.69, 70: Do you think drinking alcohol (beer, wine, liquor) is bad for a person’s health?... Do you think using marijuana (smoke, vape, eat, or drink) is bad for a person’s health?
Note: Cells are empty if there are less than 10 respondents.
Arcohe Union Elementary 2018-19
10. Tobacco Use
Table A10.1
Use of Cigarettes and E-Cigarettes, Lifetime
Grade 3 Grade 4 Grade 5 Grade 6
% % % %
Ever smoked a cigarette – – 0
Part of a cigarette, like one or two puffs – – 0
A whole cigarette – – 0
Ever used an electronic cigarette, e-cigarette, or other
vaping device – – 0
Question ES A.62, 63: Have you ever smoked a cigarette?... Have you ever used an electronic cigarette, e-cigarette, hookah pen, or other vaping device?
Note: Cells are empty if there are less than 10 respondents.
Table A10.2
Perception of Health Risk of Cigarette and Electronic Cigarette Use
Grade 3 Grade 4 Grade 5 Grade 6
% % % %
Do you think smoking cigarettes is bad for a person’s health?
No, not bad – – 0
Yes, a little bad – – 0
Yes, very bad – – 100
Do you think using an electronic cigarette, e-cigarette, hookah pen, or other vaping device is bad for a
person’s health?
No, not bad – – 5
Yes, a little bad – – 0
Yes, very bad – – 95
Question ES A.67, 68: Do you think smoking cigarettes is bad for a person’s health?... Do you think using an electronic cigarette, e-cigarette, hookah pen, or other vaping device is bad for a person’s health?.
Note: Cells are empty if there are less than 10 respondents.
Arcohe Union Elementary 2018-19
11. Other Physical and Mental Health Risks
Table A11.1
Frequency of Being Home Alone
Grade 3 Grade 4 Grade 5 Grade 6
% % % %
No, never – – 57
Yes, some of the time – – 33
Yes, most of the time – – 10
Yes, all of the time – – 0
Question ES A.57: Are you home alone after school? Note: Cells are empty if there are less than 10 respondents.
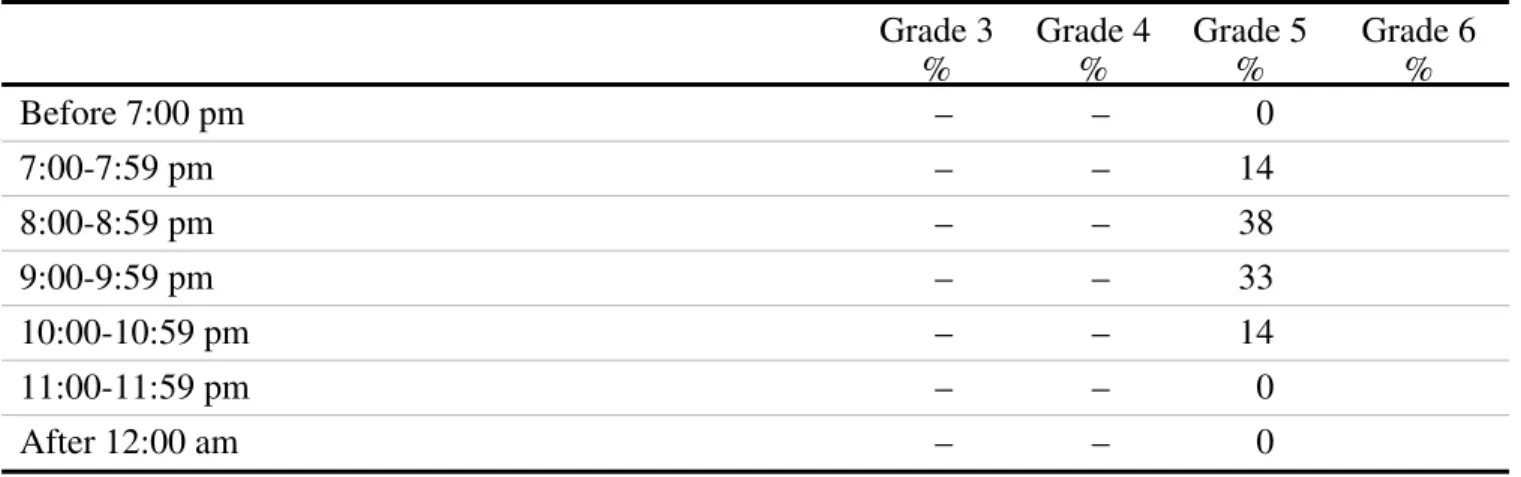
Table A11.2 Bedtime
Grade 3 Grade 4 Grade 5 Grade 6
% % % %
Before 7:00 pm – – 0
7:00-7:59 pm – – 14
8:00-8:59 pm – – 38
9:00-9:59 pm – – 33
10:00-10:59 pm – – 14
11:00-11:59 pm – – 0
After 12:00 am – – 0
Question ES A.7: What time do you usually go to bed on nights before you go to school? Note: Cells are empty if there are less than 10 respondents.
Table A11.3
Breakfast Consumption
Grade 3 Grade 4 Grade 5 Grade 6
% % % %
No – – 33
Yes – – 67
Question ES A.5: Did you eat breakfast this morning? Note: Cells are empty if there are less than 10 respondents.
Arcohe Union Elementary 2018-19
Table A11.4
Experienced Sadeness
Grade 3 Grade 4 Grade 5 Grade 6
% % % %
No, never – – 38
Yes, some of the time – – 38
Yes, most of the time – – 24
Yes, all of the time – – 0
Question ES A.60: Do you feel sad?
Note: Cells are empty if there are less than 10 respondents.
Arcohe Union Elementary 2018-19
12. Gender Breakdowns
Table A12.1
Key Indicators of School Climate and Student Well-Being by Gender
Grade 3 Grade 4 Grade 5 Grade 6
Female Male Female Male Female Male Female Male
% % % % % % % %
School Engagement and Supports
School connectedness† – – – – 92
Academic motivation† – – – – 97
Total school supports† – – – – 81
Caring adults in school† – – – – 88
High expectations-adults in school† – – – – 94
Meaningful participation at school† – – – – 55
Facilities upkeep† – – – – 73
Parent involvement in schooling† – – – – 76
Social and emotional learning supports† – – – – 89
Anti-bullying climate† – – – – 83
School Safety
Feel safe at school† – – – – 93
Been hit or pushed† – – – – 40
Mean rumors spread about you† – – – – 47
Called bad names or target of mean jokes† – – – – 47
Saw a weapon at school§ – – – – 27
Notes: Cells are empty if there are less than 10 respondents.
†Average percent of respondents reporting “Yes, most of the time” or “Yes, all of the time.”
§Past 12 months.
Arcohe
Union
Elementary
2018-19
P
age
32
Elementary
Main
Report
–
Module
A:
Table A12.1
Key Indicators of School Climate and Student Well-Being by Gender – Continued
Grade 3 Grade 4 Grade 5 Grade 6
Female Male Female Male Female Male Female Male
% % % % % % % %
School Disciplinary Environment
Students well behaved† – – – – 73
Students treated fairly when break rules† – – – – 64
Students treated with respect† – – – – 87
Substance Use and Mental Health
Alcohol or drug use – – – – 13
Marijuana use – – – – 0
Cigarette use – – – – 0
E-cigarette use – – – – 0
Experienced sadness† – – – – 33
Notes: Cells are empty if there are less than 10 respondents.
†Average percent of respondents reporting “Yes, most of the time” or “Yes, all of the time.”
Arcohe
Union
Elementary
2018-19
P
age
33
Elementary
Main
Report
–
Module
A:
Table A12.2
Student Positive Behavior by Gender
Grade 3 Grade 4 Grade 5 Grade 6
Female Male Female Male Female Male Female Male
% % % % % % % %
Positive behavior† – – – – 97
Follow classroom rules† – – – – 100
Follow playground rules† – – – – 93
Listen when teacher is talking† – – – – 100
Nice to other students† – – – – 93
Notes: Cells are empty if there are less than 10 respondents.
†Average percent of respondents reporting “Yes, most of the time” or “Yes, all of the time.”
Table A12.3
School Safety-Related Indicators by Gender
Grade 3 Grade 4 Grade 5 Grade 6
Female Male Female Male Female Male Female Male
% % % % % % % %
Been harassed on school propertyB
Been hit or pushed – – – – 40
Mean rumors spread about you – – – – 47
Been called bad names/mean jokes made about you – – – – 47
Feels safe at school most/all of the time – – – – 93
Notes: Cells are empty if there are less than 10 respondents.
BCombines “Some of the time,” “Most of the time,” and “All of the time.”
Arcohe
Union
Elementary
2018-19
P
age
34
Elementary
Main
Report
–
Module
A:
Table A12.4
Selected Alcohol and Drug Use Measures by Gender
Grade 3 Grade 4 Grade 5 Grade 6
Female Male Female Male Female Male Female Male
% % % % % % % %
Lifetime AOD Use
Alcohol, one or two sips – – – – 13
Alcohol, a full glass – – – – 0
Inhalants (to get high) – – – – 0
Marijuana – – – – 0
Any of the above – – – – 13
Perceived Health RiskC
Alcohol – – – – 93
MarijuanaD – – – – 100
Notes: Cells are empty if there are less than 10 respondents.
CCombines “A little bad” and “Very bad.”
DStudents who responded that they didn’t know what marijuana was were excluded from calculation.
Arcohe
Union
Elementary
2018-19
P
age
35
Elementary
Main
Report
–
Module
A:
Table A12.5
Selected Tobacco Measures by Gender
Grade 3 Grade 4 Grade 5 Grade 6
Female Male Female Male Female Male Female Male
% % % % % % % %
Ever smoked a cigarette – – – – 0
Part of a cigarette, like one or two puffs – – – – 0
A whole cigarette – – – – 0
Electronic cigarette, e-cigarette, or other vaping device – – – – 0
Perceived health risk of cigarette smokingC – – – – 100
Perceived health risk of electronic cigarette useC – – – – 93
Notes: Cells are empty if there are less than 10 respondents.
CCombines “A little bad” and “Very bad.”
Arcohe
Union
Elementary
2018-19
P
age
36
Elementary
Main
Report
–
Module
A:
Appendix
2018-19 CHKS Elementary Survey Response Rates
Eligible Schools 3rd 4th 5th 6th
% % % %
Arcohe Elementary 58 2
Notes: Response rates are presented by grade level. Eligible schools listed are based on CBEDS 2018-19 public school and enrollment data files. Directly funded charter schools have been excluded from the list.
Arcohe Union Elementary 2018-19