C
HAPTER 16
INTRODUCTION
• Questions to be addressed in this chapter:
– How are REA diagrams for individual
transaction cycles integrated into a single
comprehensive organization-wide REA
diagram?
– How are tables constructed from the REA
model of an AIS in a relational database?
– How can queries be written to retrieve
INTRODUCTION
• In the previous chapter, you learned how to
develop an REA diagram for an individual
transaction cycle.
• This chapter demonstrates how to implement an
REA diagram in a database.
• We focus on relational databases because:
– They are commonly used to support transaction
processing systems.
– They are familiar to most business students.
INTEGRATING REA DIAGRAMS ACROSS
CYCLES
• In Chapter 15, we looked at REA diagrams
for the revenue and expenditure cycles.
INTEGRATING REA DIAGRAMS ACROSS
CYCLES
Employees
Employee
(Payroll
Clerk)
Employee
(Supervisor)
Time Worked
Disburse
Cash
Employee
Time
INTEGRATING REA DIAGRAMS
ACROSS CYCLES
Employees
Employee
(Payroll
Clerk)
Employee
(Supervisor)
Time Worked
Disburse
Cash
Employee
Time
Cash
•
The basic economic exchange:
–
Get employee time and skills
INTEGRATING REA DIAGRAMS
ACROSS CYCLES
Employees
Employee
(Payroll
Clerk)
Employee
(Supervisor)
Time Worked
Disburse
Cash
Employee
Time
Cash
•
The
time worked
event must be
INTEGRATING REA DIAGRAMS
ACROSS CYCLES
Employees
Employee
(Payroll
Clerk)
Employee
(Supervisor)
Time Worked
Disburse
Cash
Employee
Time
Cash
•
However, each agent can be linked to zero
or many
time worked
events. The zero
INTEGRATING REA DIAGRAMS
ACROSS CYCLES
Employees
Employee
(Payroll
Clerk)
Employee
(Supervisor)
Time Worked
Disburse
Cash
Employee
Time
Cash
•
A similar situation exists with the
disburse
cash
event. (We regard each individual
INTEGRATING REA DIAGRAMS
ACROSS CYCLES
Employees
Employee
(Payroll
Clerk)
Employee
(Supervisor)
Time Worked
Disburse
Cash
Employee
Time
Cash
•
The assumption is made that employees record time worked on
a daily basis.
•
Time worked
is therefore linked to a maximum of one
cash
INTEGRATING REA DIAGRAMS
ACROSS CYCLES
Employees
Employee
(Payroll
Clerk)
Employee
(Supervisor)
Time Worked
Disburse
Cash
Employee
Time
Cash
•
For each
cash disbursement
,
however, there are one-to-many
time worked
events.
INTEGRATING REA DIAGRAMS
ACROSS CYCLES
Employees
Employee
(Payroll
Clerk)
Employee
(Supervisor)
Time Worked
Disburse
Cash
Employee
Time
Cash
•
The
employee time
entity requires some explanation.
INTEGRATING REA DIAGRAMS
ACROSS CYCLES
Employees
Employee
(Payroll
Clerk)
Employee
(Supervisor)
Time Worked
Disburse
Cash
Employee
Time
Cash
•
Time is different from
inventory and other
assets in that it cannot
be stored.
•
There are only a few
relevant attributes
about employee time:
–
Hours worked
INTEGRATING REA DIAGRAMS
ACROSS CYCLES
Employees
Employee
(Payroll
Clerk)
Employee
(Supervisor)
Time Worked
Disburse
Cash
Employee
Time
Cash
•
The
time worked
and
disburse cash
events
capture all the
information about
employee time that it is
practical to collect and
monitor.
•
Consequently, the
employee time
resource
entity is almost never
implemented in an
INTEGRATING REA DIAGRAMS
ACROSS CYCLES
Employees
Employee
(Payroll
Clerk)
Employee
(Supervisor)
Time Worked
Disburse
Cash
Employee
Time
Cash
•
In the relationship between
cash disbursement
and the
cash
resource:
–
This relationship is identical to the expenditure cycle.
–
Each check or EFT must be linked to at least one cash account
(and usually only one), leading to a (1:1) cardinality.
–
Each cash account can be linked to:
•
As few as zero cash disbursements (e.g., a new account).
•
And up to many.
RULES FOR COMBINING REA
DIAGRAMS
• Some entities appear in more than one
transaction cycle diagram.
–
Inventory
appears in the revenue and
expenditure cycles.
–
Cash disbursements
appear in the
expenditure and payroll cycles.
–
Employees
(agent) and
cash
(resource)
appear in all three cycles.
Employees (Supervisor)
Order
Inventory
Employees
Suppliers
Inventory
Call on
Customer
Take Cust.
Order
Employees
(Salesperson)
Customer
Employees
(Salesperson)
Sales
Receive
Inventory
Customer
Suppliers
Employees
(Cashier)
Receive Cash
Employees
(Cashier)
Disburse
Cash
Cash
Employee
Time
Time Worked
Employees
(as Payees)
Employees
(Supervisor)
Order
Inventory
Employees
Suppliers
Inventory
Call on
Customer
Take Cust.
Order
Employees
(Salesperson)
Customer
Employees
(Salesperson)
Sales
Receive
Inventory
Customer
Suppliers
Employees
(Cashier)
Receive Cash
Employees
(Cashier)
Disburse
Cash
Cash
Employee
Time
Time Worked
Employees
(as Payees)
•
The integrated diagram merges multiple copies
of resource and event entities but retains
Employees
(Supervisor)
Order
Inventory
Employees
Suppliers
Inventory
Call on
Customer
Take Cust.
Order
Employees
(Salesperson)
Customer
Employees
(Salesperson)
Sales
Receive
Inventory
Customer
Suppliers
Employees
(Cashier)
Receive Cash
Employees
(Cashier)
Disburse
Cash
Cash
Employee
Time
Time Worked
Employees
(as Payees)
RULES FOR COMBINING REA
DIAGRAMS
•
Merging redundant resource entities
– The REA diagrams for individual transaction cycles are
built around basic give-get economic exchanges.
– Diagrams for individual cycles provide only partial
information.
• Example: The expenditure cycle tells you how the
company gets inventory, but doesn’t tell you what
becomes of the inventory.
– To integrate the cycles, we redraw the REA diagram to
place common resources between the events that affect
them.
– Reflects the economic duality that every resource must be
connected to at least one event that increases the
Employees
(Supervisor)
Order
Inventory
Employees
Suppliers
Inventory
Call on
Customer
Take Cust.
Order
Employees
(Salesperson)
Customer
Employees
(Salesperson)
Sales
Receive
Inventory
Customer
Suppliers
Employees
(Cashier)
Receive Cash
Employees
(Cashier)
Disburse
Cash
Cash
Employee
Time
Time Worked
Employees
(as Payees)
•
Inventory has been shown in green here,
Employees
(Supervisor)
Order
Inventory
Employees
Suppliers
Inventory
Call on
Customer
Take Cust.
Order
Employees
(Salesperson)
Customer
Employees
(Salesperson)
Sales
Receive
Inventory
Customer
Suppliers
Employees
(Cashier)
Receive Cash
Employees
(Cashier)
Disburse
Cash
Cash
Employee
Time
Time Worked
Employees
(as Payees)
RULES FOR COMBINING REA
DIAGRAMS
•
Merging redundant event entities
– Some events (e.g.,
disburse cash
) may
appear in multiple transaction cycles.
Employees
(Supervisor)
Order
Inventory
Employees
Suppliers
Inventory
Call on
Customer
Take Cust.
Order
Employees
(Salesperson)
Customer
Employees
(Salesperson)
Sales
Receive
Inventory
Customer
Suppliers
Employees
(Cashier)
Receive Cash
Employees
(Cashier)
Disburse
Cash
Cash
Employee
Time
Time Worked
Employees
(as Payees)
RULES FOR COMBINING REA
DIAGRAMS
•
Difference between merging redundant
events and merging redundant
resources:
– Merging redundant resources does not affect
any cardinalities.
Employees
(Supervisor)
Order
Inventory
Employees
Suppliers
Inventory
Call on
Customer
Take Cust.
Order
Employees
(Salesperson)
Customer
Employees
(Salesperson)
Sales
Receive
Inventory
Customer
Suppliers
Employees
(Cashier)
Receive Cash
Employees
(Cashier)
Disburse
Cash
Cash
Employee
Time
Time Worked
Employees
(as Payees)
Employees
(Supervisor)
Order
Inventory
Employees
Suppliers
Inventory
Call on
Customer
Take Cust.
Order
Employees
(Salesperson)
Customer
Employees
(Salesperson)
Sales
Receive
Inventory
Customer
Suppliers
Employees
(Cashier)
Receive Cash
Employees
(Cashier)
Disburse
Cash
Cash
Employee
Time
Time Worked
Employees
(as Payees)
•
The cardinality between
disburse cash
and
record
RULES FOR COMBINING REA
DIAGRAMS
•
Reason lies in the semantics
– A resource entity can and usually is linked to
multiple events.
• Example:
Inventory
is linked to a
receive
inventory
event in the expenditure cycle and a
sales
(or deliver inventory) event in the sales
cycle.
RULES FOR COMBINING REA
DIAGRAMS
•
An event that occurs in one cycle can be
linked to:
– An event that is part of one transaction cycle; or
– An event that is part of another transaction cycle;
– But not both!
– Example: A
cash disbursement
is to pay an
employee (payroll) or buy inventory (expenditure), but
not both.
RULES FOR COMBINING REA
DIAGRAMS
• Remember: A minimum of one means that
each instance of that entity has to be
associated with at least one instance of
the other entity.
• Each cash disbursement is linked to either
a recording of hours or a receipt of
RULES FOR COMBINING REA
DIAGRAMS
• Merging two transaction cycles on a common event may
also affect the minimum cardinalities between the
merged event and the agent participating.
• Same basic reasoning:
– A
cash disbursement
in the expenditure cycle is a payment to
a supplier, so every cash event is linked to at least one supplier.
– A
cash disbursement
in the payroll cycle is a payment to an
employee, so every cash event is linked to at least one
employee.
– A
cash disbursement
in the two cycles combined is linked
either to a supplier or an employee, but not both.
Employees
(Supervisor)
Order
Inventory
Employees
Suppliers
Inventory
Call on
Customer
Take Cust.
Order
Employees
(Salesperson)
Customer
Employees
(Salesperson)
Sales
Receive
Inventory
Customer
Suppliers
Employees
(Cashier)
Receive Cash
Employees
(Cashier)
Disburse
Cash
Cash
Employee
Time
Time Worked
Employees
(as Payees)
Employees
(Supervisor)
Order
Inventory
Employees
Suppliers
Inventory
Call on
Customer
Take Cust.
Order
Employees
(Salesperson)
Customer
Employees
(Salesperson)
Sales
Receive
Inventory
Customer
Suppliers
Employees
(Cashier)
Receive Cash
Employees
(Cashier)
Disburse
Cash
Cash
Employee
Time
Time Worked
Employees
(as Payees)
RULES FOR COMBINING REA
DIAGRAMS
•
Validating the accuracy of integrated
REA diagrams
– Chapter 15 presented three basic principles
for drawing REA diagrams for individual
cycles.
RULES FOR COMBINING REA
DIAGRAMS
• An integrated REA diagram must satisfy these five rules:
– Every event must be linked to at least one resource.
– Every event must be linked to at least two agents.
– Every event that involves disposition of a resource must be linked to an
event that involves acquiring a resource. (Reflects give-get economic
duality).
– Every resource must be linked to at least one event that increases the
resource and one that decreases it.
– If event A can be linked to more than one other event, but cannot be
linked simultaneously to all of those other events, then the REA diagram
should show that event A is linked to a minimum of zero of each of
RULES FOR COMBINING REA
DIAGRAMS
• The preceding five rules can be used to develop
an integrated REA diagram and can also be
used as “check figures” to validate the accuracy
of a completed diagram.
• Our integrated diagram is not yet complete
because the fourth rule is not satisfied for the
employee time
resource.
– Rule 4: Every resource must be linked to at least one
event that increases it and one event that decreases
it.
IMPLEMENTING AN REA DIAGRAM IN A
RELATIONAL DATABASE
• Once an REA diagram has been
developed, it can be used to design a
well-structured relational database.
• Creating a set of tables from an REA
diagram automatically results in a
well-structured relational database
that is not subject to the update,
IMPLEMENTING AN REA DIAGRAM IN A
RELATIONAL DATABASE
• The three steps to implementing an REA
diagram in a relational database are:
– Create a table for:
• Each distinct entity in the diagram.
• Each many-to-many relationship.
– Assign attributes to appropriate tables.
– Use foreign keys to implement one and
one-to-many relationships.
• As discussed previously, REA diagrams will
differ across organizations because of
IMPLEMENTING AN REA DIAGRAM IN A
RELATIONAL DATABASE
• The three steps to implementing an REA
diagram in a relational database are:
–
Create a table for:
•
Each
distinct
entity in the diagram.
• Each many-to-many relationship.
– Assign attributes to appropriate tables.
– Use foreign keys to implement one and
one-to-many relationships.
• As discussed previously, REA diagrams will
differ across organizations because of
Employees (Supervisor)
Order
Inventory
Employees
Suppliers
Inventory
Call on
Customer
Take Cust.
Order
Employees
(Salesperson)
Customer
Employees
(Salesperson)
Sales
Receive
Inventory
Customer
Suppliers
Employees
(Cashier)
Receive Cash
Employees
(Cashier)
Disburse
Cash
Cash
Employee
Time
Time Worked
Employees
(as Payees)
•
There are three distinct agent entities.
Employees (Supervisor)
Order
Inventory
Employees
Suppliers
Inventory
Call on
Customer
Take Cust.
Order
Employees
(Salesperson)
Customer
Employees
(Salesperson)
Sales
Receive
Inventory
Customer
Suppliers
Employees
(Cashier)
Receive Cash
Employees
(Cashier)
Disburse
Cash
Cash
Employee
Time
Time Worked
Employees
(as Payees)
•
The third agent entity is the employee. We label the
types of employees to make the diagram more
IMPLEMENTING AN REA DIAGRAM IN A
RELATIONAL DATABASE
• Total entities to be represented in
separate tables:
Events
8
Resources
2
Agents
3
IMPLEMENTING AN REA DIAGRAM IN A
RELATIONAL DATABASE
• The three steps to implementing an REA
diagram in a relational database are:
–
Create a table for:
• Each
distinct
entity in the diagram.
•
Each many-to-many relationship.
– Assign attributes to appropriate tables.
– Use foreign keys to implement one and
one-to-many relationships.
• As discussed previously, REA diagrams will
differ across organizations because of
Employees (Supervisor)
Order
Inventory
Employees
Suppliers
Inventory
Call on
Customer
Take Cust.
Order
Employees
(Salesperson)
Customer
Employees
(Salesperson)
Sales
Receive
Inventory
Customer
Suppliers
Employees
(Cashier)
Receive Cash
Employees
(Cashier)
Disburse
Cash
Cash
Employee
Time
Time Worked
Employees
(as Payees)
•
Let’s count the many-to-many relationships.
IMPLEMENTING AN REA DIAGRAM IN A
RELATIONAL DATABASE
• Total number of tables in database:
Events
8
Resources
2
Agents
3
13
Plus: Many-to-Many Relationships
7
IMPLEMENTING AN REA DIAGRAM IN A
RELATIONAL DATABASE
• Table names for these 20 entities
correspond to the names of the entities in
the REA diagram.
– The tables for M:N relationships are
hyphenated concatenations of the entities
involved in the relationship.
– Makes it easier:
• To verify that all necessary tables have been
created.
IMPLEMENTING AN REA DIAGRAM IN A
RELATIONAL DATABASE
• Table names for our integrated diagram:
• Call on Customer
• Take Customer Order
• Sales
• Receive Cash
• Order Inventory
• Receive Inventory
• Disburse Cash
• Time Worked
• Inventory
• Cash
• Customer
• Supplier
• Employee
• Call on Customer-Inventory
• Take Order-Inventory
• Sales-Inventory
• Sales-Receive Cash
• Order Inventory-Inventory
• Receive Inventory-Inventory
• Receive Inventory-Disburse
IMPLEMENTING AN REA DIAGRAM IN A
RELATIONAL DATABASE
• The three steps to implementing an REA
diagram in a relational database are:
– Create a table for:
• Each
distinct
entity in the diagram.
• Each many-to-many relationship.
–
Assign attributes to appropriate tables.
– Use foreign keys to implement one and
one-to-many relationships.
• As discussed previously, REA diagrams will
differ across organizations because of
IMPLEMENTING AN REA DIAGRAM IN A
RELATIONAL DATABASE
•
Step 2: Assign attributes to each table
– The next step is to determine which attributes
should be included in each table.
– The designer needs to interview users and
management to identify which facts need to
be included in the database.
– Should use the REA diagram to determine in
which tables those facts should be placed.
IMPLEMENTING AN REA DIAGRAM IN A
RELATIONAL DATABASE
•
Identify primary keys
– Every table in a relational database must have a
primary key.
• The primary key is an attribute or combination of attributes
that uniquely identifies each row in a table.
• It is typically a numeric identifier.
– The primary key is usually a single attribute.
– However for M:N relationship tables, it consists of two
attributes that represent the primary key of each
linked entity.
– Example: The primary key for a sales-inventory table
might be Invoice No-Item No.
– These multiple-attribute primary keys are called
IMPLEMENTING AN REA DIAGRAM IN A
RELATIONAL DATABASE
•
Keys for the entity tables we’ve identified might be
specified as follows:
– CALL ON CUSTOMER—Call No.
– TAKE CUSTOMER ORDER—Sales Order No.
– SALES—Invoice No.
– RECEIVE CASH—Cash Receipt No.
– RECEIVE INVENTORY—Receiving Report No.
– DISBURSE CASH—Check No.
– TIME WORKED—Timecard No.
– INVENTORY—Item No.
– CASH—Account No.
– CUSTOMER—Customer No.
– SUPPLIER—Supplier No.
– EMPLOYEE—Employee No.
•
Example: The primary
key for the
sales
IMPLEMENTING AN REA DIAGRAM IN A
RELATIONAL DATABASE
•
Assign other attributes to appropriate tables
– Attributes other than the primary key are also included
in tables:
• To provide for accurate transaction processing and the
production of financial statements; or
• To facilitate effective management of the entity’s resources,
events, and agents.
– Any attribute in a table must be a fact about the object
represented by the primary key.
IMPLEMENTING AN REA DIAGRAM IN A
RELATIONAL DATABASE
• Some non-key attributes even need to be stored
in M:N tables.
• Example: The inventory-sales table may include
a “quantity sold” attribute.
– The quantity sold can’t be placed in the
inventory
table, because there can be many sales of any
particular inventory item, and each sale produces a
different quantity ordered.
– The quantity sold can’t be placed in the
sales
table,
because an individual sale can include several
inventory items.
– The quantity sold is placed in the
sales-inventory
IMPLEMENTING AN REA DIAGRAM IN A
RELATIONAL DATABASE
•
Price and cost data
– Information about prices and costs are stored
as attributes in several different tables.
– The
inventory
table stores the suggested list
price, which is generally constant for the fiscal
period.
IMPLEMENTING AN REA DIAGRAM IN A
RELATIONAL DATABASE
– Just like sales prices, the standard and actual
purchase costs
of each item are stored in
different tables.
– General rule:
• Time-independent data (such as standard costs or
list prices) should be stored as an attribute of a
resource or agent.
IMPLEMENTING AN REA DIAGRAM IN A
RELATIONAL DATABASE
•
Cumulative Data
– Attributes like “quantity on hand” or “account
balance” are cumulative data.
– Quantity on hand is calculated as:
• Sum of quantities purchased from the table linking
inventory
to the
receive inventory
event.
• LESS: Sum of quantity sold from the
sales-inventory
table.
– Customer balance:
• Sum of all sales to the customer.
IMPLEMENTING AN REA DIAGRAM IN A
RELATIONAL DATABASE
• The preceding types of items do not have
to be stored and can be calculated.
• However, explicitly storing them may
improve response time to queries.
– Should be done if the DBMS has the
capability to automatically update these
IMPLEMENTING AN REA DIAGRAM IN A
RELATIONAL DATABASE
• The three steps to implementing an REA
diagram in a relational database are:
– Create a table for:
• Each
distinct
entity in the diagram.
• Each many-to-many relationship.
– Assign attributes to appropriate tables.
–
Use foreign keys to implement one-to-one and
one-to-many relationships.
• As discussed previously, REA diagrams will
differ across organizations because of
IMPLEMENTING AN REA DIAGRAM IN A
RELATIONAL DATABASE
•
Step 3: Use foreign keys to implement 1:1
and 1:N relationships.
– Many-to-many relationships have been implemented
by the creation of separate tables.
– One-to-one and one-to-many relationships still need
to be implemented in the database.
– But it is usually more efficient to implement them by
the creation of foreign keys.
– A foreign key is an attribute of one entity that is the
primary key of another entity.
–
Customer number
might appear in the
customer
IMPLEMENTING AN REA DIAGRAM IN A
RELATIONAL DATABASE
•
Using foreign keys to implement one-to-one
relationships
– Can be implemented by including the primary key of
one entity as a foreign key in the other.
– Minimum cardinalities may suggest which choice is
more efficient.
• Usually, best to insert the primary key of the entity that can
occur a minimum of one time as a foreign key in the entity
that can occur a minimum of zero times.
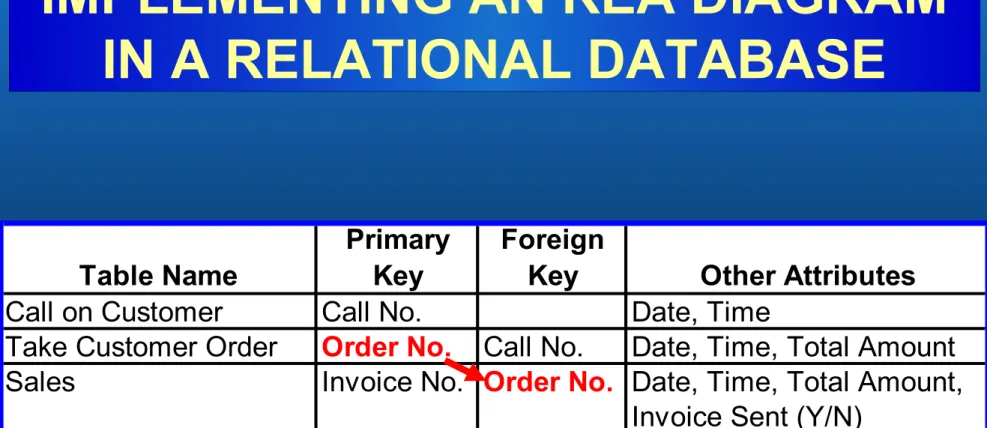
• When there are two sequential events, the primary key of the
event that occurs first is usually the foreign key in the event
that occurs second.
Employees (Supervisor)
Order
Inventory
Employees
Suppliers
Inventory
Call on
Customer
Take Cust.
Order
Employees
(Salesperson)
Customer
Employees
(Salesperson)
Sales
Receive
Inventory
Customer
Suppliers
Employees
(Cashier)
Receive Cash
Employees
(Cashier)
Disburse
Cash
Cash
Employee
Time
Time Worked
Employees
(as Payees)
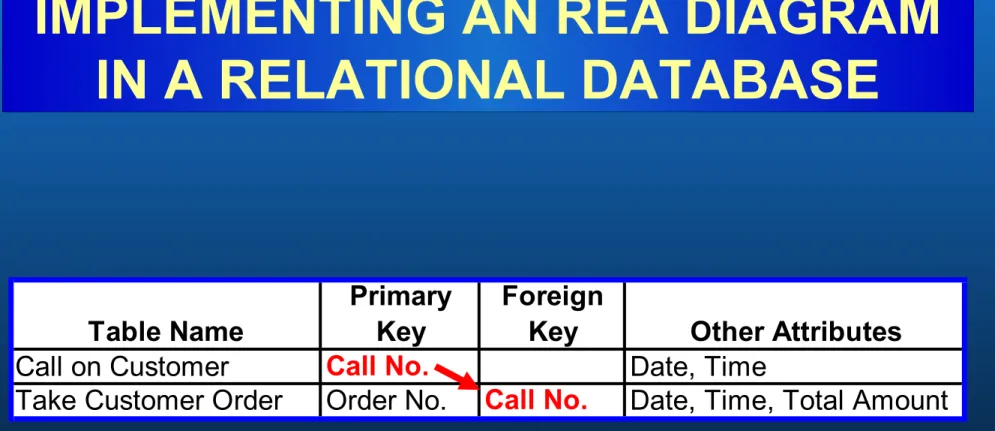
•
Let’s zoom in on the relationship between call on
customer and take customer order.
Call on
Customer
Take Cust.
Order
•
This relationship is a 1:1 relationship, but the minimum on
both sides is zero.
Table Name
Primary
Key
Foreign
Key
Other Attributes
Call on Customer
Call No.
Date, Time
Take Customer Order
Order No.
Call No.
Date, Time, Total Amount
Employees (Supervisor)