ISSN: 2278 – 7798 All Rights Reserved © 2014 IJSETR 2255
Bidirectional Serpentine Scan Based Error
Diffusion Technique for Color Image Visual
Cryptography
P.Mohamed Fathimal1 , Dr.P.Arockia Jansi Rani2
Abstract—Visual Cryptography is a cryptographic
technique which allows visual information (e.g. printed text, handwritten notes and pictures) to be encrypted in such a way that the decryption can be performed by the human visual system. A distinct property of visual cryptography is that it does not need any cryptographic knowledge to reconstruct the secret.. Error diffusion is a simple but efficient algorithm for image halftone generation. This paper discusses the color visual cryptographic scheme in which the data is divided into half toned shares and each share is embedded with the signature of the participants to ensure the authenticity of digital data. The shares are generated using the basic visual (2, 2) scheme with the pixel expansion of two. Each share is first authenticated and then the shares are superimposed to recover the desired image. This paper analyses the visual quality of the recovered image generated using various error diffusion techniques and suggests a new modified approach to error diffusion half toning by diffusing the error in both forward and backward direction in the image
Index Terms— Cryptography; Secret sharing;
Multi-secret sharing, Halftoning, ErrorDiffusion
I. INTRODUCTION
With the emerging trend of electronic commerce, there is a need to share the digital data either in a form of text or image through the internet .It is easy to make visually imperceptible modifications to the data which is being transmitted. To ensure the integrity and the authenticity of a digital data, many cryptographic techniques have been emerged. In 1994, visual cryptography was introduced by Noar and Shamir [1]. The notable feature of this scheme is it can recover images without any computation. Visual cryptography scheme eliminates complex computation problem in decryption process, and the secret images can be restored by stacking operation. This property makes visual cryptography especially useful for the low computation load requirement.
II. RELATED LITERATURE REVIEW Until the year 1997 visual cryptography schemes were applied only to black and white images. First color visual cryptography scheme was developed by Verheul and Van Tilborg[2]. Color secret images can be shared with the concept of arcs to construct a color visual cryptography scheme. For a color visual cryptography scheme with 𝑐 colors, the pixel expansion 𝑚 is 𝑐 ∗ 3. Yang and Laih [3] improved the scheme of Verheul and Van Tilborg [2] by decreasing the pixel expansion to 𝑐 ∗ 2. Both of these schemes shares generated were meaningless.
Hou [4] proposed a Color Visual Cryptographic schemes (CVS). Based on the halftone technique and color decomposition, the secret image is decomposed into three colors Cyan (C), Magenta (M) and Yellow(Y). By manipulating the three color values, the color pixels in the secret image could be represented.
Wang et. al.[5] produced halftone shares showing meaningful images by using error diffusion techniques. This scheme generates more pleasing halftone shares owing to errors diffused in neighbor pixels. Myodo[6] proposed a method to generate meaningful halftone images using threshold arrays. Anuprita Mande1[7] introduces a faster and easier color visual cryptography encryption method that produces meaningful color shares via error diffusion halftoning. The algorithm proposed by this scheme reduces a considerable time for encryption and decryption in a much easier way.
III. BASIC (2,2) VC SCHEME
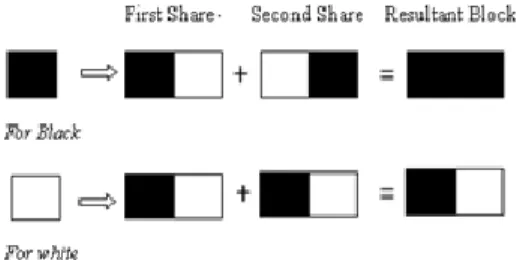
The (2, 2) VC scheme divides the secret image into two shares so that reconstruction of an image from a share is impossible. Each share is printed in transparencies. Decryption is performed by a two share stacking when the secret image is seen by the naked eye without any computation. Each Pixel is broken into two sub pixels as follows
ISSN: 2278 – 7798 All Rights Reserved © 2014 IJSETR 2256
Fig.1 a. Basic concept of VC Scheme
IV. DIGITAL IMAGE HALF TONING USING
ERROR DIFFUSION A. Digital Half toning
Image half toning converts a high-resolution image into a low-resolution image. Accordingly a 24-bit color image shall be converted to a three-bit color image or an 8-bit grayscale image to a binary image. The importance of this process arises from the fact that many color imaging systems use output devices such as color printers, low bit depth displays.
Half toning is more complicated than truncating to the low resolution intensity from multi bit intensity .Truncation gives poor image quality because the quantization error would be spread over all spatial frequencies. The goal of half toning is to shape the quantization noise because of bit depth reduction to frequencies and colors of least visual sensitivity
.
B.
Error Diffusion:
Error diffusion was introduced in 1976 by Floyd
and Steinberg. Error diffusion produces halftones of overall high visual quality of the produced binary images than classical screening, with the tradeoff of requiring more computation and memory. Screening amounts to pixel-based thresholding, whereas error diffusion requires a neighborhood operation and thresholding. The term "error diffusion" refers to the process of diffusing the quantization error along the path of the image scan. In case of a raster scan, the quantization error diffuses across and down the image. In serpentine scan, horizontal direction of scan alternates between lines. Error diffusion is particularly interesting to analyze because it involves a non-separable infinite impulse response filter in addition to the nonlinearity introduced by severe quantization
.
Fig 2 shows a binary error diffusion diagram where 𝑓(𝑚, 𝑛) represents the pixel at (𝑚, 𝑛 ) position of the input image. 𝑑(𝑚, 𝑛 ) is the sum of the input pixel value and the diffused errors 𝑒 𝑚, 𝑛 . 𝑔(𝑚, 𝑛 ) is the output quantized pixel value. Error diffusion consists of two main components.
The first component is the thresholding block where the output 𝑔(𝑚, 𝑛 ) is given by
g(m, n) = 1 , if d(m, n) ≥ t(m, n) 0 otherwise The second component is the error filter (𝑘, 𝑙 ) where the input 𝑒(𝑚, 𝑛 ) is the difference between d(𝑚, 𝑛 ) and 𝑔(𝑚, 𝑛 ). Finally, we compute 𝑑(𝑚, 𝑛 ) 𝑑 𝑚, 𝑛 = (m, n) − Σ h(k, l)𝑒 m−k,n−l (𝑘, 𝑙 ) ∈ 𝐻 where (𝑘, 𝑙 ) ∈ 𝐻. H is a two dimensional error filter.
Fig .2 Error Diffusion Method
A widely used filter is the error weight originally proposed by Floyd and Steinberg. Some of the drawbacks of this method is it produces clearly identifiable visually harmful artifacts in highlights and in dark areas referred to as worm artifacts. Visually disturbing patches of regular structure may appear .This uneven transition between “structured” and “unstructured” areas may be clearly visible and undesirable harmful visual perturbations due to uneven patches of regular structures should be avoided whenever possible.
To overcome these drawbacks two methods are suggested.
First is to change the scanning path from raster to serpentine
Second is to use modified error weights In order to reduce these artifacts, modified error weights were suggested that diffuse the error to a large number of pixels Jarvis, Judice and Ninke and stucki introduced 12-elements error filter . Anuprita Mande1[7] introduces a modified 4 elements error filter
.
Current pixel 7/16
3/16 5/16 1/16
a.Floyd and Steinberg Error Filter
d(m,n) Threshold T(m,n) Error Filter e(m,n) + _ Input f(m,n) Ouput g(m,n)
ISSN: 2278 – 7798 All Rights Reserved © 2014 IJSETR 2257
Current pixel 3/8
3/8 1/8 1/8
b. Fast Floyd and Steinberg Error Filter [7]
Current pixel 7/48 5/48
3/48 5/48 7/48 5/48 3/48
1/48 3/48 5/48 3/48 1/48
c..Jarvis, Judice and Ninke Filter
Current pixel 8/42 4/42
2/42 4/42 8/42 4/42 2/42
1/42 2/42 4/42 2/42 1/42
d. Stucki Error Filter Fig 3 Error Filters
V. PROPOSED WORK A. Encryption Process
The secret color image is split into channels of red, green and blue. Each channel is treated as a grayscale image to which half toning and visual cryptography are applied independently.
All the half toning methods described earlier pushes the error in forward direction. This proposed method suggests error filters that use serpentine scan and also distribute the error in both forward and backward directions (Fig.5). This technique is applied to all the above discussed four error filters. Thus the halftone image to be produced may contain the error distributed uniformly to each of the neighbouring pixels. In this method the quantization error of one pass is collected and used during the next pass as quantization error of the future pixels
Floyd and Steinberg in Forward Direction Fast Floyd and Steinberg in Forward
Direction
Jarvis, Judice and Ninke in Forward direction
Stucki in forward direction
Floyd and Steinberg in Serpentine Scan Forward and backward direction(SBD) Fast Floyd and Steinberg in Serpentine Scan
Forward and backward direction(SBD) Jarvis, Judice and Ninke in Serpentine Scan
Forward and backward direction(SBD) Stucki in Serpentine Scan Forward and
backward direction(SBD)
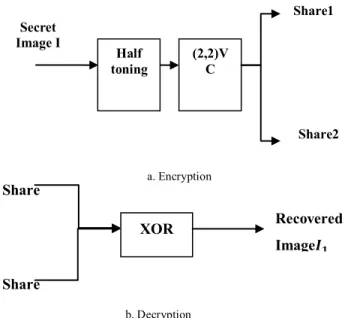
After the monochrome shares are generated for each channel, channels are combined separately to create the color shares. Each share is then embedded with the signature of the receiver. The shares are distributed to the receivers. (Fig.4)
a. Encryption
b. Decryption Fig.4. Block diagram of the proposed scheme
3/32 5/32 1/32
7/32 Current pixel 7/32
3/32 5/32 1/32
a.Floyd and Steinberg in Serpentine Scan Forward and backward direction Error Filter
3/16 1/16 1/16
3/16 Current pixel 3/16
3/16 1/16 1/16
b. Fast Floyd and Steinberg in Serpentine Scan Forward and backward direction Error Filter
1/96 3/96 5/96 3/96 1/96 3/96 5/96 7/96 5/96 3/96 5/96 7/96 Current pixel 7/96 5/96 3/96 5/96 7/96 5/96 3/96 1/96 3/96 5/96 3/96 1/96
c.Jarvis, Judice and Ninke in Serpentine Scan Forward and backward direction Error Filter
1/84 2/84 4/84 2/84 1/84 2/84 4/84 8/84 4/84 2/84 4/84 8/84 Current pixel 8/84 4/84 2/84 4/84 8/84 4/84 2/84 1/84 2/84 4/84 2/84 1/84
d. Stucki in Serpentine Scan Forward and backward direction Error Filter
Fig. 5 Proposed Error Filters
B. Decryption Process
In the decryption, the signature is first
extracted from each share to check authenticity
Secret Image I (2,2)V C Half toning Share1 Share2 Share 2 Share 1 XOR Recovered Image𝑰𝟏
ISSN: 2278 – 7798 All Rights Reserved © 2014 IJSETR 2258 .Then the secret image is recovered by stacking
the shares together (using XOR operation).
VI. EVALUATION METRICS
Various parameters are recommended by researchers to evaluate the performance of visual cryptography scheme. Naor and Shamir [1] suggested two main parameters: pixel expansion m and contrast α. Pixel expansion m refers to the number of sub pixels in the generated shares that represents a pixel of the original input image. It represents the loss in resolution from the original picture to the shared one. Contrast α is the relative difference in weight between combined shares that come from a white pixel and a black pixel in the original image.
Jung-San Lee et al [8] advised security, pixel expansion, accuracy and computational complexity as a performance measures. Security is satisfied if each share reveals no information of the original image and the original image cannot be reconstructed if there are fewer than k shares collected. Accuracy is considered to be the quality of the reconstructed secret image and evaluated by peak signal-to-noise ratio (PSNR) measure. Computational complexity concerns the total number of operators required both to generate the set of n shares and to restructure the original secret image.
A. Peak Signal to Noise Ratio (PSNR)
The simplest and most widely used pixel wise error based measures are Mean Squared Error (MSE) and Peak Signal-to-Noise Ratio (PSNR). The MSE is the squared intensity differences between the reference and the test image pixels and is defined by
𝑀𝑆𝐸 =mn1 [ Im1 n1 ij− I′ij]2 -- (3)
PSNR = 20 * log10(𝑚𝑎𝑥𝑓 sqrt(𝑀𝑆𝐸)) (4)
Legend:
𝐼-original image of size 𝑚 ∗ 𝑛. 𝐼′-recovered image of size 𝑚 ∗ 𝑛.
𝒎𝒂𝒙𝒇- maximum intensity value that exists in the original image (255).
The higher the PSNR, the better image has been reconstructed.
B. Weighted Signal-to-Noise Ratio (WSNR)
WSNR is calculated in the spatial frequency domain. Human Visual System is a nonlinear,
spatially varying system. Signal-to-Noise-Ratio (SNR) is computed. wsnr = log10 X i,j CSF i,j 2 n j=1 m i=1
X i,j −X′ i,j CSF i,j 2 n
j=1 m
i=1 -- (5)
Where 𝑋𝑖,𝑗, 𝑋′𝑖.𝑗 𝑎𝑛𝑑 𝐶𝑆𝐹𝑖,𝑗 represents the discrete Fourier transform (DFT) of the input image, reconstructed image and frequency response termed as Contrast Sensitivity Function CSF, respectively [9].
C. Universal Image Quality Index (UQI)
It is defined by modelling the image distortion relative to the reference image as a combination of three factors: loss of correlation, luminance distortion, and contrast distortion.
UQI = 4σ𝑥𝑦𝑥 𝑦
( σx2+σy2)∗ (x 2+y 2) -- (6)
The range of values for the index UQI is [-1, 1]. The best value 1 is achieved if and only if the images are identical.
VII. EXPERIMENTAL RESULTS
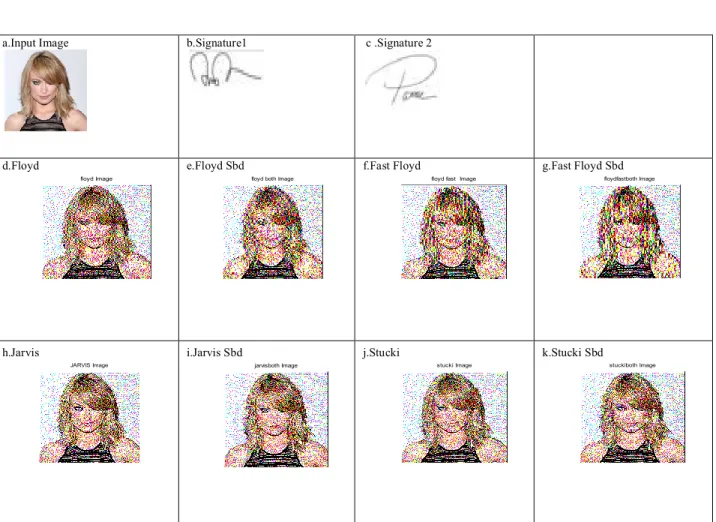
The experimental simulation is conducted by using the image processing software package (MATLAB). The color image (RGB image) is stored in MATLAB as an M- by- N-by-3 data array that defines red, green, and blue color components for each pixel. The input image of size 225 *225 and the two signature images of size 50*38 to be embedded within the shares are shown in the Fig.7. The recovered image obtained by using different error diffusion techniques are shown in figure .Comparative analysis for PSNR, UQI and WSNR for different error diffusion techniques given in the figure shows that increasing the number of elements over which the error is diffused requires twice the amount of floating point and memory access operations and is even slower than the existing ones. But it improves the visual quality of the reconstructed image. The proposed serpentine scan bidirectional method has better visual quality when compared to the existing forward direction error diffusion Techniques. Floyd SBD performs better than other proposed SBD based techniques.
ISSN: 2278 – 7798 All Rights Reserved © 2014 IJSETR 2259
Im1.jpg
Im2.jpg
Im3.jpg
Im4.jpg
Fig.6 Sample Input Images b. Signature 1 c. Signature 2
a.Input Image b.Signature1 c .Signature 2
d.Floyd e.Floyd Sbd f.Fast Floyd g.Fast Floyd Sbd
h.Jarvis i.Jarvis Sbd j.Stucki k.Stucki Sbd
Fig 7.Input and Output of the different Error Diffusion Techniques
Table I PSNR value for different Error diffusion Techniques
S.No Method
Input Images
Im1.jpg Im2.jpg Im3.jpg Im4.jpg
1 Floyd 27.37 28.63 28.68 27.09 2 Floyd SBD 27.38 28.66 28.70 27.09 3 FloydFast 27.31 28.61 28.60 26.94 4 Floyd Fast SBD 27.37 28.66 28.69 27.06 5 Jarvis 27.35 28.60 28.66 26.98 6 Jarvis SBD 27.36 28.61 28.66 26.99 7 Stucki 27.36 28.62 28.65 27.01 8 Stucki SBD 27.37 28.63 28.69 27.01
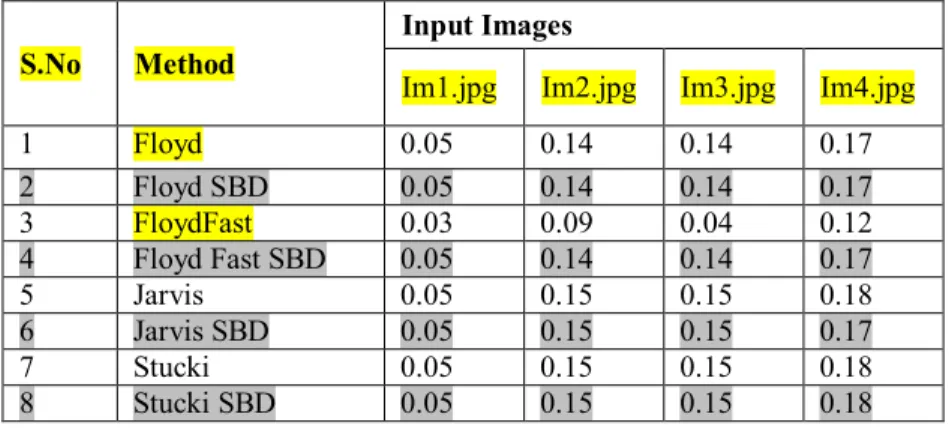
Table II UQI values for different Error diffusion Techniques
floyd Image floyd both Image floyd fast Image floydfastboth Image
ISSN: 2278 – 7798 All Rights Reserved © 2014 IJSETR 2260
S.No Method
Input Images
Im1.jpg Im2.jpg Im3.jpg Im4.jpg
1 Floyd 0.05 0.14 0.14 0.17 2 Floyd SBD 0.05 0.14 0.14 0.17 3 FloydFast 0.03 0.09 0.04 0.12 4 Floyd Fast SBD 0.05 0.14 0.14 0.17 5 Jarvis 0.05 0.15 0.15 0.18 6 Jarvis SBD 0.05 0.15 0.15 0.17 7 Stucki 0.05 0.15 0.15 0.18 8 Stucki SBD 0.05 0.15 0.15 0.18
Table III WSNR values for different Error diffusion Techniques
S.No Method
Input Images
Im1.jpg Im2.jpg Im3.jpg Im4.jpg
1 Floyd 12.46 17.42 16.03 10.60 2 Floyd SBD 12.48 17.42 16.05 10.60 3 FloydFast 12.01 15.48 14.22 9.98 4 Floyd Fast SBD 12.21 17.35 15.95 10.41 5 Jarvis 12.38 16.97 15.48 10.29 6 Jarvis SBD 12.39 17.00 15.49 10.35 7 Stucki 12.30 17.17 15.76 10.50 8 Stucki SBD 12.35 17.17 15.76 10.50 VIII. CONCLUSION
The main focus of the paper is to improve the quality of the image by using digital half toning with error diffusion in color VC. From the experimental results we can observe that Serpentine scan both direction (SBD) algorithms gives maximum PSNR and WSNR. Hence, we can conclude that SBD algorithms are best suited for the proposed VC scheme.
REFERENCES
[1] M.Naor and A. Shamir, Visual Cryptography, in “Advanced in Cryptology – EUROCRYPT‟ 94”, A. De. Santis, Ed., Vol. 950 of Lecture Notes in Computer Science, Springer-Verlag, Berlin, PP. 1-12,1995.
[2] E. R. Verheul and H. C. A. Van Tilborg, ,“Constructions and Properties of k out of n Visual Secret Sharing Schemes”,. Designs,
Codes, and Cryptography, Vol. 11 No. 2 (1997) pp. 179–196
[3] C. Yang and C. Laih, “New Colored Visual Secret Sharing Schemes”. Designs, Codes and cryptography, 20,pp. 165–335, 2000.
[4] Y. C. Hou, “Visual cryptography for color images,” Pattern
Recognit., vol. 36, pp. 1619–1629, 2003.
[5] Wang, Z., Arce, G.R.: Halftone visual cryptography through error diffusion. In:ICIP, pp. 109–112 ,2006.
[6]Myodo, E., Sakazawa, S., Takishima, Y.: Visual cryptography based on void-andclusterhalftoning technique. In: ICIP, pp. 97–100 ,2006.
[7] Anuprita Mande1, Manish Tibdewal ,”A Fast Encryption Algorithm for Color Extended Visual Cryptography” International Journal of Emerging Technology and Advanced Engineering
,Volume 3, Issue 4, April 2013.
[8]Jung-San Lee, T. Hoang Ngan Le, “Hybrid (2, N) Visual Secret Sharing Scheme For Color Images”, 978-1-4244-4568-4/09, IEEE, 2009.
[9]Niranjan Damera-Venkata, Thomas D. Kite “Image Quality Assessment Based on a Degradation Model” , IEEE Transactions On Image Processing, Vol. 9, No. 4, April 2000.
P.Mohamed Fathimal received her BE and ME in Computer
Science and Engineering from Manonmanium Sundaranar University.Tirunelveli ,Tamilnadu.She has 10 years of Teaching Experience .Currently She is Pursuing Phd in Manonmanium Sundaranar University .Her research interests include Digital Image Processing and Network Security
Dr.P.Arockia Jansi Rani B.E, M.E, PhD is an Assistant
Professor in the department of Computer Science and Engineering in Manonmanium Sundaranar University. She has more than 12 years of Teaching Experience Her research interests include DataMining and Digital Image Processing.