1
Modeling Agent Mobility with UML Sequence Diagram
Mario Kusek and Gordan JezicDepartment of Telecommunications Faculty of Electrical Engineering and Computing
University of Zagreb Unska 3, Croatia, HR-10000
[email protected], [email protected],
Abstract: This paper presents a proposal for modeling agent mobility using UML Sequence Diagram. Our
notation is focused on representing agent migration path and includes modeling of three basic mobility elements: agent creation, mobility path and current agent location. Four variants of graphical notation are presented. In a case study we explain one variant of notation that is the most suitable for given scenario.
1. Introduction
Agent concepts and mobile software agents have become a part of the system and service architecture of the new generation networks. Application areas include the use of the agents in operation and management of networks, systems and services. This is where agent's mobility offers important advantages.
There are several kinds of diagrams for modeling agent mobility, but these diagrams can be hardly used for representing moving and execution path. In this paper we propose four variants of a graphical notation for modeling agent mobility that is based on UML Sequence Diagram: stereotyped mobility diagram, swimlaned mobility diagram, state representation mobility diagram, and frame fragment mobility diagram. Our proposal is based on the problem that moving path is hardly to read from existing notations agent. Three basic mobility elements are modeled: agent creation, mobility path, and current location. In case study we explain one variant of notation that is the most suitable for presented price searcher scenario.
The paper is organized as follows: Section 2 represents related work. Section 3 elaborates modeling agent mobility using UML Sequence Diagram and includes four variants of possible graphical notation. Finally, Section 4 gives a case study with price searcher scenario in which one variant of notation is explained, and Section 5 concludes the paper.
2. Related Work
There exist several diagrams for modeling agent mobility. Some of them are: FIPA modeling area - deployment and mobility [1], extending Activity Diagrams to model mobile systems [2], modeling mobile agent applications in UML 2.0 Activity Diagrams [3], Sequence Diagram for mobility [4], and Agent Modeling Language (AML) [5].
AUML supports modeling of agent mobility in Deployment and Activity Diagram [1]. In AUML Deployment Diagram it is possible to capture the reason (the why) an agent moves to a different node and the location (where) it moves. In AUML Activity Diagram it is capable
2
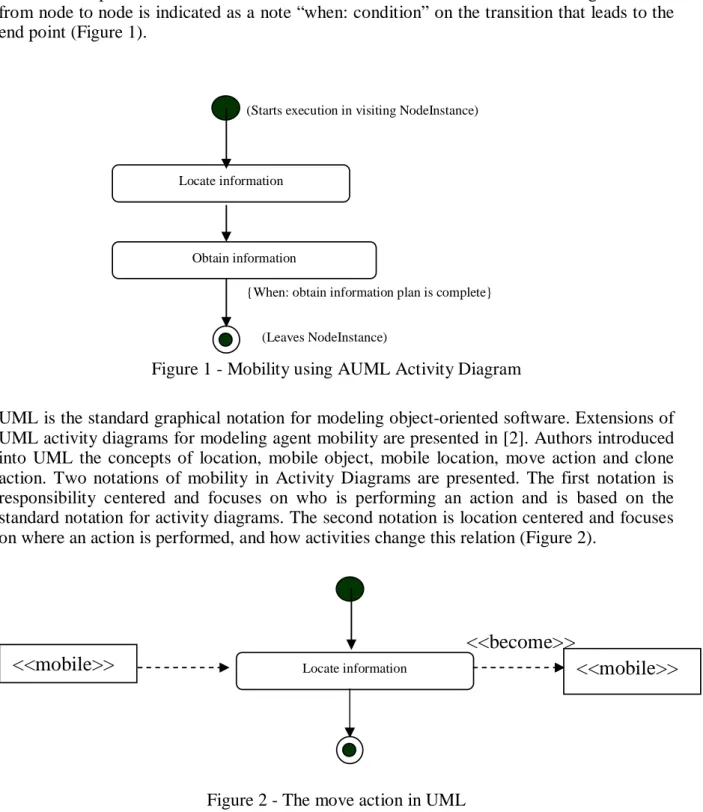
to capture the when (timing) a mobile agent leaves a node to move to another. The activity nodes model plan, while the transitions model events. The when, the mobile agent moves from node to node is indicated as a note “when: condition” on the transition that leads to the end point (Figure 1).
Locate information
Obtain information
(Starts execution in visiting NodeInstance)
(Leaves NodeInstance)
{When: obtain information plan is complete}
Figure 1 - Mobility using AUML Activity Diagram
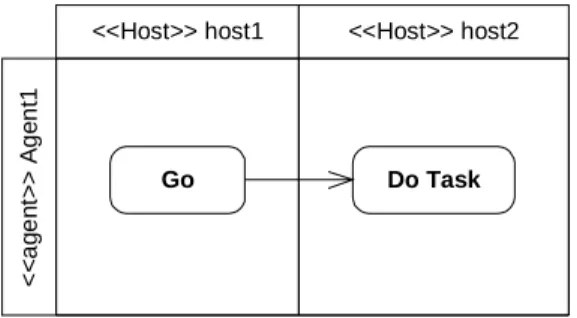
UML is the standard graphical notation for modeling object-oriented software. Extensions of UML activity diagrams for modeling agent mobility are presented in [2]. Authors introduced into UML the concepts of location, mobile object, mobile location, move action and clone action. Two notations of mobility in Activity Diagrams are presented. The first notation is responsibility centered and focuses on who is performing an action and is based on the standard notation for activity diagrams. The second notation is location centered and focuses on where an action is performed, and how activities change this relation (Figure 2).
Locate information
<<mobile>>
<<mobile>>
<<become>>
Figure 2 - The move action in UML
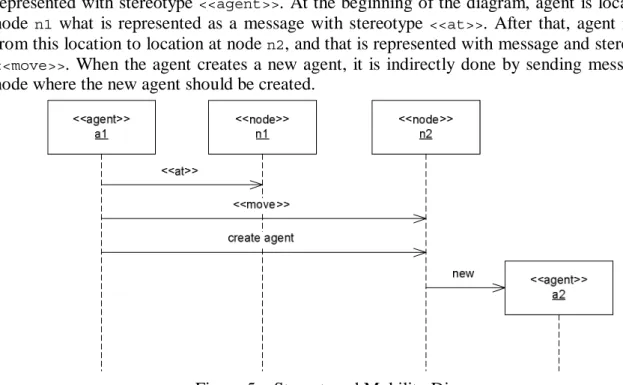
In [3] authors proposed an extension of Activity Diagrams in UML 2.0. A new stereotype <<Host>> + parameter is introduced for a swimlane, which represents the location with a unique name (address) as a parameter in order to capture mobility of agents. Agent communication and cloning are also defined by existing model elements with a rule for subactivities. Agent moving from location “host1” to “host2” is represented by using “Go”
3
activity (Figure 3).
<<Host>> host1 <<Host>> host2
<< ag en t> > A g e n t1 Go Do Task
Figure 3 - “Go” action in UML 2.0
The notation for modeling agent mobility based on UML Sequence Diagram is used in [4]. Author presents Sequence Diagrams for Mobility (SDM), an extension of UML Sequence Diagrams for modeling mobile objects, interaction between objects and the network topology of nested objects.
Agent Modeling Language (AML) [5] defines metaclasses used to model structural and behavioral aspects of entity mobility. Move is depicted as a UML Dependency relationship with the stereotype <<move>> (Figure 4). MobilityAction is used to model mobility action of
entity and MoveAction is used to model an action that results in a removal of the entity from its current hosting location.
Host 1 <<move>> Host 2
Figure 4 - Mobility in AML
3. Agent Mobility with Sequence Diagrams
During the modeling agent mobility using existing notations it is noticed that modeling agent mobility with activity or deployment diagram does not give you the overall view about agent moving and execution path. Our proposal is to show it using Sequence Diagram. There are three basic mobility elements that must be shown in diagrams:
• Current agent location, • Agent mobility path, • Location of agent creation.
In next section we introduce four variants of representing agent mobility in sequence diagram.
4
3.1. Stereotyped Mobility Diagram
In stereotyped mobility diagram we introduce three stereotypes (Figure 5). Agent is represented with stereotype <<agent>>. At the beginning of the diagram, agent is located at
node n1 what is represented as a message with stereotype <<at>>. After that, agent moves
from this location to location at node n2, and that is represented with message and stereotype <<move>>. When the agent creates a new agent, it is indirectly done by sending message to
node where the new agent should be created.
Figure 5 – Stereotyped Mobility Diagram
This representation of mobility is similar to [4]. Mobility is based on representing the change of the state of object that moves from one location to another. Agent moves by sending stereotyped message to the node where it wants to go. This representation gives overall view of nodes and agent mobility path. The downside of this notation is that for each node there is an object that represents the node. In the case of large number of nodes, the diagram is useless.
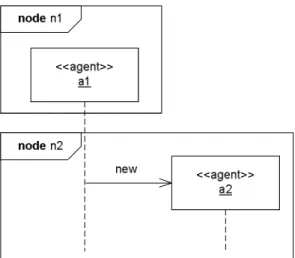
3.2. Swimlaned Mobility Diagram
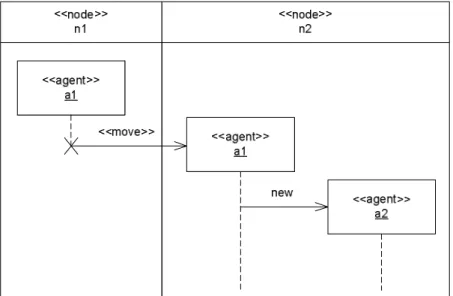
In swimlaned mobility diagram (Figure 6) a node is represented by swimlane with stereotype
<<node>>. Swimlane represents execution at the specified node. An agent moved from one
node to another is represented by message with stereotype <<move>> but the lifeline of agent
at source is terminated and new representation at destination is created. Creating new agent is represented by message new and agent is created at the same node. Indirect creation of agent can not be represented in this diagram.
5
Figure 6 – Swimlaned Mobility Diagram
The diagram has clear representation of mobility and needs less space than stereotyped diagram but in the case of large number of nodes it is also useless.
3.3. State Representation Mobility Diagram
Idea for this diagram is taken from [4] where the mobility is represented by changing the state of the moving agent. In this diagram (Figure 7), mobility is represented with the state element in sequence diagram as specified in UML 2.0 specification [6]. State element starts with “at node” and the rest is node name where agent is placed. When an agent moves from one node to another, a new state represents mobility. Creating new agent is represented with new message and after creation; agent must have state with specified node.
6
This diagram is good solution for notation of agent moving and execution in the multi-agent system with large number of nodes. The shortcoming is poorer representation of mobility. This diagram consumes more space in vertical representation than the former. In the practice, programming and debuging agents, for instance JADE [7] agents, programmer is using Sniffer agent [8] to represent message exchanging in Sequence Diagram. This diagram is candidate for implementing mobility in Sniffer agent because it is very similar to classic Sequence Diagram.
3.4. Frame Fragment Mobility Diagram
Frame Fragment Mobility diagram represents mobility with frame fragments in sequence diagram (Figure 8). Each frame fragment, with interaction operation node, represents execution on that node. Agent mobility is represented by entering next fragment.
Figure 8 –Frame Fragment Mobility Diagram
This diagram it better than state representation mobility diagram because mobility is more clear and occupied space is smaller. In some cases it is not possible to order agents in a way that one frame fragment can represent agents at the same node.
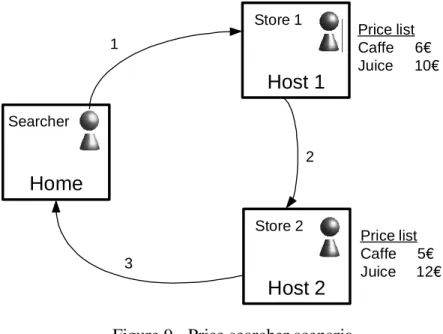
4. Case study: Simple price searcher
The case study includes (Figure 9) three network nodes: Home, Host1 and Host2. On Host1 and Host2 resides store agent, which is responsible for providing pricelist. The Searcher agent is created on Home node. Input parameters are list of nodes and the item. The Searcher agent migrates from Home node to Host1 node and requests Store1 agent to give it the price list. The Store1 agent responds with the whole pricelist. The Searcher extracts the price for the item and migrates to the next node. After visiting all nodes the Searcher agent migrates back to the Home node and informs the user where and at what price it has found the specified item.
7 Price list Caffe 5€ Juice 12€
Home
SearcherHost 1
Store 1Host 2
Store 2 1 2 3 Price list Caffe 6€ Juice 10€Figure 9 - Price searcher scenario
This case study is shown using Stereotyped Mobility Diagram (Figure 10). Stereotyped Mobility Diagram is chosen because the system includes only mobile agents and small number of nodes. This notation clearly represents agent execution and mobility path.
<<host>> home <<agent>> searcher create agent new <<host>> host1 <<agent>> store1 <<host>> host2 <<agent>> store2 get request <<move>>
get price list price list
<<move>>
get price list price list <<move>>
show results
8
5. Conclusion
The motivation of this paper is to model agent mobility and focusing on notation of agent migration path. We proposed four variants of modeling agent mobility based on UML Sequence Diagram notations. Stereotyped Mobility Diagram can be used for modeling agent systems with small number of nodes. It clearly represent agent execution and mobility path. Swimlaned Mobility Diagram needs less space than Stereotyped Mobility Diagram but it is not suitable for large number of nodes. Multi-agent systems with mobile agents and large number of nodes can be modeled with State Representation Mobility Diagram in which mobility is represented with the state element in Sequence Diagram. The approach which requests smaller space in notation is Frame Fragment Mobility Diagram suitable for large number of nodes where mobility is represented by entering next fragment. It is not always possible to use Frame Fragment Mobility Diagram and in this case agent mobility path would be represented with State Representation Mobility Diagram.
6. References
[1] FIPA Modeling TC, FIPA Modeling Area: Deployment and Mobility, 2003/05/13, http://www.auml.org/auml/documents/DeploymentMobility.zip
[2] Baumeister, Nora Koch, Piotr Kosiuczenko, and Martin Wirsing. Extending Activity Diagrams to Model Mobile Systems. In M. Aksit, M. Mezini, and R. Unland, editors, Objects, Components, Architectures, Services, and Applications for a Networked World. International Conference NetObjectDays, NODe 2002, Erfurt, Germany, Oct. 7-10, 2002. Revised Papers, volume 2591 of LNCS, pages 278-293. Springer Verlag, 2003.
http://www.pst.informatik.uni-muenchen.de/~baumeist/publications/netobjectdays2002.pdf
[3] Miao Kang, Lan Wang, and Kenji Taguchi, Modelling Mobile Agent Applications in UML 2.0 Activity Diagrams, 2004/04/21, http://www.auml.org/auml/supplements/UML2-AD.pdf
[4] P. Kosiuczenko, Sequence Diagrams for Mobility, Krogstie J. (ed.): Proc. of MobIMod workshop Tampere, Finland, October 2002, LNCS, Springer, Berlin to appear Springer http://www.pst.informatik.uni-muenchen.de/personen/kosiucze/SDM.pdf
[5] Radovan Cervenka, Ivan Trencansky, Agent Modeling Language, Language Specification, Version 0.9, Whitestein Technologies AG, 2004/12/20, http://www.whitestein.com/resources/aml/wt_AMLSpecification_v0.9.pdf
[6] OMG, Unified Modeling Language: version 2.0 (UML 2.0), Final Adopted Specification, 2003, http://www.uml.org/#UML2.0
[7] Java Agent DEvelopment Framework (JADE), http://jade.tilab.com/ [8] JADE Sniffer Agent, http://jade.tilab.com/doc/tools/sniffer/index.html