Available at http://www.ijcsonline.com/
Automatic Test Data Generation using Genetic Algorithm using Sequence
Diagram
Anju Bala, Dr. Rajender Singh Chhillar
Department of Computer Science & Applications, M.D. University, Rohtak, India
Abstract
The most striking feature of SDLC is software testing. It is very labour-intensive and expensive process in software development and handling as well as maintenance of software. The main objective of this paper is to extend the testing technique. Testing is to show the incorrectness and is considered to succeed when an error is detected [Myers79]. Today’s automatic testing has replaced manual testing with a great extent. Automating testing is very helpful in reducing human efforts to generate test cases or test data. Test data or test case is a very tiresome task in software testing. It has multiple set of values or data that are used to test the functionality of a particular feature. All degrees of the test values and conditions maintained in separate files and stored as test data. Test case or data generation is a set of conditions or rules that are developed for finding the failure points in a developing software. Nowadays, many researches have paid considerable attention, focusing on test data generation techniques. This paper adopts a case study and proposes a technique for test data generation, based on genetic algorithm using critical path. Critical path testing is considered to solve the looping problem and improving the testing efficiency. Test data scenario is derived from sequence diagram. Sequence diagram reveals the sequence of calls in a system using exchange of messages among the objects of system.
Keywords: Genetic Algorithm, UML, Sequence diagram and graph, Test-data generation.
I. INTRODUCTION
Software testing is recognized as a key feature or an inevitable part of software development life cycle. It is the most exhaustive and critical phase but unavoidable, in SDLC. Software testing is the phenomena of executing a program with the intent of finding an error or fault to make the software error-free and satisfy the end-user. Testing is a very essential phase, though very labour-intensive and expensive process in software development and handling as well as maintenance of software. It accounts for taking a large part of total cost, up to 50 percent for a entire software development [1]. Due to advancement in technology, the software system as well as testing process has becomes very complex, to overcome from all these issues, testing process should be automated, proportional to cost of developing software should be reduced significantly. So, a challenging part of this phase, entails to the generation of test cases or data. This generation is very crucial to the success of testing, because it is very hard part of software, to obtain a fully tested program, given that the large number of test cases will be able, if needed to find maximum number of faults in less number of iterations. Software program is infinite, and a suitable design of test cases will be able to detect a maximum number of faults. For the requirement of good and effective software quality assurance, the technique for automatic generation of test data, make efforts efficiently to systematically uncover the different types of errors with a minimum amount of time and efforts. A test data is a set of data performed in a sequence and related to a test objective, which will produce a number of tests input values, observed output, expected output or test oracle needed for the test to run, such as environment prerequisites [2].
A good test case should have the quality to cover every aspect of test objective and high rate of fault detection. This method is used for automatic generation of test case usually based on efficiently searching or finding small set of test cases with high probability of detecting as-yet undiscovered error [1]. There have been few efforts on representing a considerable attention, which covers all existing automatic test case generation approaches. In this paper, we extend a general classification for automatic test data generation approaches with comparison between existing approaches, to show that the existing approaches are resource-intensive as well as limited budget. So, this paper presents a generic approach i.e. Genetic Algorithm, is the most acceptable approach to generate automatic test data or test case.
This paper is presented as follows: Section 2 review the related work of data generation techniques. Many test-data generation techniques have been developed. Section 3 gives an overview on introduction of UML and its diagram, notation and terminology of sequence diagram. Section 4 gives the introduction of GA. Section 5 describes the proposed approach for generation of test data. Section 6 presents case study of on-line appointment in hospital. Section 7 presents conclusion and future work of this paper.
II. RELATED WORK
Many researches have been done in the field of test data generation technology. Recently, many techniques have been proposed, all related to Genetic Algorithm.
path in Software under Test (SUT). Weights are assigned to edge of CFG by applying 80-20 rules. Xanthakis et al. [8] present genetic algorithm to generate the test data. Genetic algorithms are used for generation of test data for structure. A path is selected by the user and the relevant branches are executed from program. Fitness function is calculated by summation of branch predicated. V. Mary Sumalatha, G.S.V.P. Raju [9] presents the test case generation by means of UML sequence diagram using genetic algorithm from which best test cases optimized. Genetic algorithm applied on sequence graph. All paths discover from source to destination with loops and calculate the fitness value. Sangeeta Sabherwal [7] proposed a technique for prioritization of test cases scenario derived from activity diagram and state chart diagram using genetic algorithm concepts, stack and information flow (IF) diagram. Stack based application is adopted for assigning the weight to each node of activity and state chart diagram. Bo Zhang and Chen Wang [3] use simulated annealing algorithm into genetic algorithm to generate the test data for path testing. A simulated annealing algorithm is inspired by the annealing of metals. In this method, solid is heated from high temperature and cooled down slowly to maintain thermodynamic equilibrium of system. The adaptive genetic simulated annealing algorithm is proposed by Zhang to automatically generate the test data. The steps if this algorithm is shown in his paper. The fitness value, crossover, mutation another modification are applied in genetic algorithm procedure. M. Harman [4] focused on automated test data generation using search based software engineering. Automated test data generation using genetic algorithm is based on search based software engineering. Sultan H. Aljahdali [8] presented the limitation of genetic algorithm in software testing. The majority of software test-data generation techniques are based on genetic algorithm. It attempts to compare and classify the combinatorial problems according to genetic algorithm feature and parameters.
III. UML
The Unified Modeling Language (UML) is standard modeling language, is widely used to visualize, specify, construct and document the main artifacts of software system. UML is used in business modeling and many architectural modeling, but here mainly in software development modeling to design and implement for component-based applications. In software development, it is very popular to generate test cases or data with the help of graphical notation i.e. rectangles, lines, ellipses etc provided by UML. It has own syntax and semantics. Apart from all of the aforementioned techniques adoption of UML, there is inevitable nature of UML is, once the model is developed, then a variety of problems solved i.e. analysis, specification, code and test case or data generation, visualize and understand the problem and working of the software testing. It is also helpful in bridging the gaps between the designers and testers. The most important modeling language has been invented by Grady Booch, Jim Rumbaugh in 1994 to combine the diagramming notations of two most popular methods of Booch and OMT (Object Modeling Techniques).The UML and its diagrams are widely used to visually depict the static structure and more importantly, the dynamic behavior of applications. UML constructs different types of
diagrams, categorized into two groups-structural diagrams and behavioral diagrams [Vaughan07]. There are many types of diagram to capture five different behavior of the system i.e. Class diagram, Component diagram and Deployment diagram are to represent the static behavior of system. Activity diagram, Sequence diagram, State diagram are used to represent the dynamic behavior of the system. Here, the focus is on sequence diagram and activity diagram because sequence diagram is most popular in UML diagram to generate test data or cases.
A. Sequence Diagram
A sequence diagram is also called an interaction diagram and most common behavior diagram. It is very popular artifact of UML for dynamic modeling. It focuses on behavior of your system. Sequence diagram only focuses on processes how they interact to one–another and in what order. It constructs the message sequence chart. It shows all interaction of objects in timely manner. It reveals the exchange of information between objects and classes in a scenario. It shows the functionality of a scenario. Sometimes, it is called event diagram or event scenario. Structure of sequence diagram represented by following notations i.e. class name is written in boxes with colon, parallel vertical lines, different processes, horizontal arrow represents message exchanged between objects, this scenario also shows in graphical run time scenario.
Sequence diagram is better than other dynamic diagram. In this paper, a brief idea is given on comparison of sequence diagram to activity diagram with the intent of showing that the sequence diagram is better to generate test data.
Activity diagram focuses on a particular operation of an object. But sequence diagram focuses on the way of process execution in sequence, operations and its parameters but activity diagram reveals the workflow of operations.
Sequence diagram keeps track on the interaction between objects, this feature extends its usability for dynamic modeling. But in activity diagram, it focuses on how the process flow of an object.
Fig1. Basic notation of sequence diagram
view, it shows how the business currently working by showing the interaction between objects or how will be performed in future. Sequence diagram looks like as shown in Figure 1.
B. Basic Notation of Sequence Diagram
The basic notations that are used in sequence diagram are described below:
I. Actor: A participant or entity that interacts with the system.
II. Lifeline: A vertical line reveals the sequence of events, participate during an interaction.
III. Unit: Represent a module or subsystem, component, unit or run-time entity in the system.
IV. Separator: Represent an interface or boundary between subsystem, components or units.
V. Group: Header elements into subsystem or components.
VI. Synchronous Message: The sender waits for a response to a synchronous message before all continuous.
VII. Asynchronous message: A message that does not require a response before sender continuous. An asynchronous message shows only a call from the sender.
VIII. Execution occurrence: A vertical shaded rectangle that appears on a participant’s lifeline and represents the period when participates executing the operation. IX. Callback message: A message returns to a participant that is waiting for a return back. The resulting execution occurrence shows on top of existing one.
X. Self message: A message from participants to itself. The resulting execution occurrence appears on the top of sending execution.
XI. Create message: create a message to invoke the first participant. If it receives it should be first.
XII. Destroy message: Represents the destruction of a header elements as a result of a call for another element.
XIII. Comment: A comment is additional information can be attached to any point on a lifeline.
XIV. Time start: it is a starting point..
XV. Time expiration: it shows the expiry time. IV. GENETIC ALGORITHM
A. INTRODUCTION
Genetic Algorithm is based on natural phenomena. The fundamental concept behind GAs is “natural selection” and “genetic inheritance”. The founder of GA is John Holland, university of Michigan (1970) in U.S.A developed a remarkable idea in the field of heuristic search. It is based on the evolutionary principle. GA belongs to the class of probabilistic algorithm. GA empirically provides directed search algorithms rely on the mechanics of biological evolution. The best part behind to use GA than other
searching algorithm is that GA performs a multi-directional search by maintaining the optimized solutions not a single point. Main application areas of GA are- AI, business, scientific and engineering circle etc. But these can be used in many forms like to generate automatic test cases etc. GA is a class of probabilistic optimization algorithm. Genetic Algorithms are categorized as global heuristic search or GA is good heuristic search for combinatorial problems [20].
Ex.TSP, pen movement of a plotter, measure real world routing of school, prisoner’s dialemma.
The simple form of GA is given by following. This algorithm is stopped when population covers all the optimal solution.
Simple genetic algorithm:
Simple_Genetic_Algorithm( ) {
Initialize the population; /*generate the initial population*/
Calculate fitness function; /* calculate fitness value for each individual */
While(Fitness Value != Optimal Value) {
Selection; /* randomly select individual for mating*/ Crossover; /* apply crossover and mutation for getting best individual */
Mutation; /* Calculate fitness value of new individual and discard old individual by maintaining the fitness criteria of individual. If population reaches to stopping criteria or reach best individual or population has converged than finish = true. */
End End
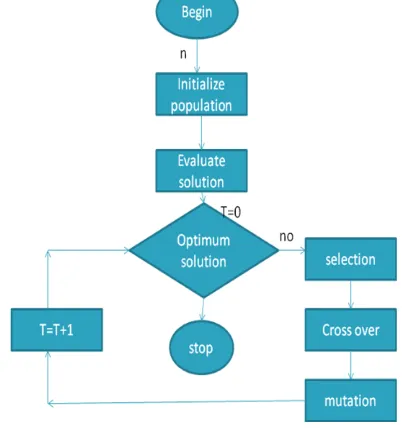
The basic steps of genetic algorithm a shown in this step:
Genetic Algorithm has basically three operators used for population to generate new offspring.
Initialization is the very first operator of genetic algorithm, it creates an initial population of chromosomes, at the beginning of execution. Selection of population is random in initialization. Selection operator is a process to select two
chromosome from the population for reproduction. There should be a selection mechanism, how these chromosomes will be selected. Mainly expectation is to select, such chromosomes that gives the better individual. So, selecting such chromosomes at higher probability will produce better population after each iteration of algorithm. Selection must be balanced by maintaining the diversity of population needed for exploration. So, too strong selection and so weak selection will reach to slow evolution. Roulette-Wheel, Rank-based, Tournament, Uniform and Elitism is the classic selection method in
GA.[Goldberg89], [Holland92].
Crossover is a very important process to generate new individual. Crossover probability should be more than mutation probability to get better individual. It is a very practical method of sharing the information between two chromosomes. In GAs operator, crossover is most valuable feature especially where building blocks (i.e. schemas) exchange is necessary [Arabas94]. Its implementation and representation is closely related to problem domain or problem dependent. Single - point crossover is most important crossover operator. In this type of operator position is chosen by randomly and element of two parents before and after mutually exchanged to produce a better individual.
Mutation is a process to trap the local optima and pruning on dead state. Its probability is always less than crossover to give better outcome. Mutation–operator alters one or more bit value in the chromosomes to enhance the structural probability. Mutation operator play the best role to protect the population against pre-mature convergence at any particular area of the entire search space[Mitchell96]. It works only on one chromosome at a time not more than one like in crossover.
Most common methods of mutation are as follow: 1. Bit-flip mutation: chromosome’s bit value is
changed with a mutation probability.
2. Uniform-mutation: bit select randomly and change its value.
Evaluate function or fitness function is also called objective function, it calculates the quality of candidate solution. Based on fitness function, measurement of single chromosome to rest of the population. This function gives the value of specific chromosome. It is not necessary that it will reach to its fitness value. The fitness value is typically
obtained by a transformation function called scaling and it is worthwhile to simplify the evaluation function as much as possible because the evaluation process itself has been found to be very expensive due to the time and resources it consumes [Arabas94].
Upon completion of crossover and mutation operation, there will be original parent population and new individual population. A fitness function determines which of these parents and offspring will survive in next generation. These operations are iterated until the expected goal is achieved.
V. PROPOSED APPROACH
To generate appropriate test data for testing process. We will have to follow these steps:
I. Draw the sequence diagram.
II. Convert the sequence diagram into sequence graph. For every conditional message two edges takes place. One edge for true condition and another edge for false condition.
III. Generate set of path from sequence diagram with the intent to cover every branch of graph. Suppose some loop occurs
in the diagram, it becomes very difficult and puzzling. So we give our best to try to find critical path in graph using the stack weight assignment approach by this algorithm:
Algorithm:
1. For every node of graph i =1….n;
2. By DFS approach, Push node of graph on stack.
3. Determine smax of stack( the maximum size); 4. For = 1 to smax, assign weight w=smax-k to
each node of graph, where smax is maximum size of stack and k is path followed by nodes of graph.
5. For each decision node d.
6. Assign the same weight to branching nodes. 7. Updates loops by Inserting the next neighbor
node of branching nodes. 8. End
IV. Fitness value of each node is calculating of graph by using addition of flow of information and popping operation require to a node. Flow of information is determined by using this equation:
Flow of information = incoming (a) * outgoing (b) Incoming means how many edges are inserting into a node and outgoing means how many edges are leaving a node.
V. Selection of chromosome bits or test data depends upon conditional nodes of graph.
VI. Calculate the fitness value of each possible path that is followed by conditional nodes of graph.
VII. Now, probability of selection for each path is calculated by Roulette wheel selection :
Pi= F(xi) / F(xi)
After probability, calculate cumulative probability Ci for each path:
Ci = Pi
VIII. Generate random number for each test-data.
IX. To select the chromosomes determine value of column N where need to find how many test data number that has cumulative probability is greater than random number.
X. The value of mating pool column is determining number of times a test-data appear in N column. XI. Select the corresponding chromosome or test data
that has higher value appear in N column.
XII. Pair-wise single point crossover is applied and select those child that has maximum fitness value. The probability of crossover operator is 0.8. Crossover is carried out only if the random number is less than 0.8 otherwise mutation operator s applied.
XIII. Bit-flip mutation is applied to interchanging of single bit in test-data or chromosome.
XIV. Recalculate the fitness value of new generation. XV. Repeat this process until maximum fitness value is
reached or all paths are covered in graph or no stopping criteria is met.
VI. CASE STUDY
In this section, we study an approach by using sequence diagram of on-line appointment in hospital. In Online appointment user will have to follow this step:
1. The patient requests for appointment.
2. The receptionist checks the appointment, appointment is available or not according to doctor’s schedule.
3. If appointment is not available, then system generate message and we can’t take the appointment.
4. If appointment is available, then the user can consult to the doctor. If patient has a minor problem, the doctor suggests some prescription. 5. If the patient has a major problem, the doctor
checks his or her record.
6. According to the patient’s record, the doctor suggests more prescription and gives appointment again.
7. If the patient becomes ok after next appointment, then patient can leave, otherwise can take appointment again.
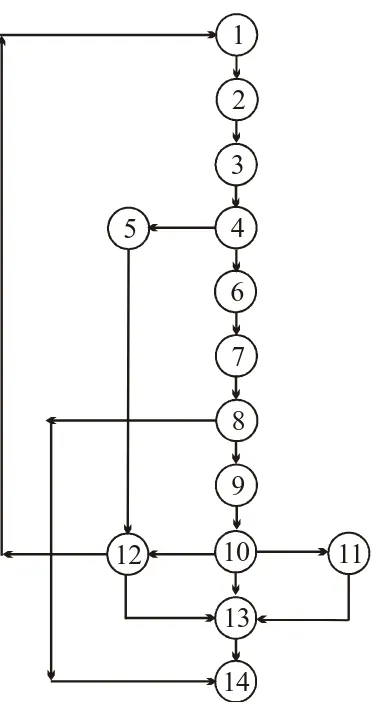
8. If no need of appointment any more, then the appointment will be available for next the patient. Sequence diagram is constructed according to these steps. In this diagram, patient, receptionist, doctor and nurse play the role of objects, they will exchange the messages among themselves for giving and taking online appointments. Sequence diagram shown in figure 3. Further, Sequence diagram is converted into sequence graph as shown in figure 4.
: Patient
: Receptionist
: Doctor
: Nurse
Take Appointment
Check Appointment
Cannot meet
Consult Doctor
Check Patient
Patient need more treatment Patient Ok
Check Patient Record
Patient OK
If not OK appoint again Treat again
Leave
1
2
3
4
5
6
7
8
9
10
11
12
13
14
Fig 4. Sequence graph of online-appointment.
Now critical path is determine by stack weight assignment approach as shown below in this table:
Table 1. Critical path is determined
Node Path
followed by node, k
Stack size, smax
Weight= smax-k
1 0 1 12
2 1 2 11
3 2 3 10
4,12 3 4 9
5,6 4 5 8
7,12 5 6 7
8,13 6 7 6
9,14 7 8 5
10 8 9 4
11,12, 13
9 10 3
13,14 10 11 2
14 11 12 1
Now complexity of each node is determined by using this table:
Table 2. Complexity of each node calculated
Node Popping operation, a
Informati on Flow, b
Fitness value= a+b
1 12 0*1=0 12
2 11,8,6,4 1*2=2 13,10,8,
6
3 10 1*1=1 11
4 9 1*2=2 11
5 8 2*1=2 10
6 8 1*1=1 9
7 7 1*1=1 8
8 6 1*2=2 8
9 5 1*1=1 6
10 4 1*2=2 6
11 6,3 1*1=1 7,4
12 7,5,3 2*2=4 11,9,7
13 1 1*1=1 2
14 1 1*1=1 2
Initial possible populations are: 1000, 1010, 1011, 1111, and 0000. The path 1,2,3,4,6,7,8,9,10,12,13,14 is followed by the 1000 chromosome and corresponding fitness value is 12+13+11+11+9+8+ 8+6+6+11+2+2=99. The next chromosome 1010 follow the path 1,2,3,4,6,7,8,9,10,11,13,14 and corresponding fitness value is 12+13+11+11+9+8+8+6+6+7+2+2=95.
The chromosome 1011 follow the path is 1,2,3,4,5,12,13,14 and corresponding fitness value is 12+13+11+11+10+11+2+2=72. The chromosome 1001 follow the path is 1,2,5,12,13,14 and corresponding fitness value is 12+13+10+11+2+2=50. The chromosome 0000 follow the path is 1, 2, 3, 4, 6, 7,8 14 and corresponding fitness value is 12+13+11+11+10+9+8+2=76.
The chromosome 1111 follow the path 1,2,3,4,6,7,8.9,10,12 and corresponding fitness value is 12+13+11+11+9+8+8+6+11=89.
Selection of new generation are shown in tables where, X is test data, F(X) is fitness value if test data, Pi is probability, Ci is cumulative probability, S is Selection, C is Crossover and M is Mutation.
Table 1. Fitness value of initial population
S. No. X F(x) Pi Ci R
1 1000 99 0.2757 0.2757 0.245
2 1010 95 0.2646 0.5403 0.257
3 1111 89 0.2479 0.7882 0.667
Table 2. New generation selection
S.No .
Selectio n
Crossov er point
Crossov er
Mutatio n
F(x )
1 1000 3 1000 1000 99
2 1000 3 1010 1010 95
3 1010 2 1011 1011 72
4 1111 2 1011 1011 95
Table3. Fitness Value of initial population
S.No X F(X) Pi Ci R
1 1000 99 0.2742 0.2742 0.2622
2 1010 95 0.2631 0.5373 0.1240
3 1011 72 0.1994 0.7367 0.8760
4 1010 95 0.2631 0.9998 0.6790
Table 4. New Generation Selection
S. no .
Selectio n
Crossove r point
Crossove r
Mutatio n
F’( X)
1 1010 3 1010 1000 99
2 1000 3 1000 1010 95
3 1011 2 1011 1111 89
4 1011 2 1010 1000 99
Table 5. Fitness Value of initial population
S.No
X F(X) Pi Ci R
1 1000 99 0.2591 0.2591 0.2486
2 1010 95 0.2486 0.5077 0.4706
3 1111 89 0.2329 0.7406 0.6880
4 1000 99 0.2591 0.9997 0.8990
Table 6.New Generation Selection
S. No .
Selectio n
Crossove r point
Crossove r
Mutatio n
F’( X)
1 1010 3 1010 1000 99
2 1011 3 1000 1000 99
3 1011 2 1000 1000 99
4 1010 2 1010 1010 95
Table 7.Fitness Value of initial Population
S.No. X F(X) Pi Ci R
1 1000 99 0.2525 0.2525 0.345
2 1000 99 0.2525 0.505 0.624
3 1000 99 0.2525 0.7575 0.867
4 1010 95 0.2423 0.9998 0.894
Table 8. New Generation Selection
S. N
Selecti on
Crossover point
Crossover Mutation F’(x)
1 1000 3 1000 1000 99
2 1000 3 1000 1000 99
3 1000 3 1000 1000 99
4 1010 3 1010 1000 99
After 8th iteration as shown in table 8, we find test data 1010 has highest fitness value 85 among all of them. So path corresponding to this chromosome is 1,2,3,4,6,7,8,9,10,12,13 tested first.
This paper makes an efforts, to extend the previous work that is also related to test data generation by activity and state chart diagram using prioritization genetic algorithm. In this paper, we adopt sequence diagram for test-data generation with comparison to activity diagram. Sequence diagram is very convenient, easy to draw and understand and gives fast result than activity diagram. Sequence diagram has most challenging features to gives us all details i.e. order of message between objects, assign responsibilities and timer. With the help of sequence diagram, changing can be made very easily and efficiently with well understanding. Naïve user can makes the correction easily in real time environment. Sequence diagram is one of the popular than others UML diagrams because it is the most formal level of refinement. So one can say that sequence diagram is more acceptable than the activity or the state chart diagram. Besides in this article, selection of test data for next generation is based Roulette –
Wheel Selection ( comparison between cumulative
probability and random number generation) which help in reducing the iterations of tables.
VII. CONCLUSION
software testing and help in improving the more testing efficiency.
REFERENCES
[1] R. Blanco, J.Tuya and B. Adenso-Díaz, “Automated test data generation using scatter-search approach”, Information and Software technology, vol. 51, Issue 4, (2009), pp. 708-720. [2] Xanthakis S, Ellis C,Skourlas C, Le Gall A, “Application of
Genetic algorithms to Software Testing”. In 5th International Conference on Software Engineering and its Applications pp. 625-636.
[3] T. Blickle, L. Thiele, A Comparison of Selection Schemes used in Genetic Algorithms. TIK-Report, Zurich, 1995.
[4] B. N. Biswal, S. S. Barpanda and D. P. Mohapatra, International Journal of Computer Applications, vol. 1, Issue 14, (2010). [5] Bo Zhang, Chen Wang, “Automatic Generation of Test Data for
Path Testing by Adaptive Genetic Simulated Annealing Algorithm”, IEEE, 2011, pp. 38-42.
[6] M. A. Ahmed, I. Hermadi, “Genetic Algorithm based multiple paths test data generator”, Computer and operations Research (2007).
[7] Parveen Ranjan Srivastava, Tai-hoon Kim, “Application of Genetic Algorithm in Software Testing”, International Journal of Software engineering and its Application, Vol. 3, No.4, October 2009, pp. 87-95.
[8] Snageeta Sabharwal, Ritu Sibal, Chanyanika Sharma, “Prioritization of test cases scenarios derived from activity diagram using genetic algorithm”, ICCCT, IEEE, 2010, pp. 481-485. [9] Sangeeta Sabharwal et al., “Applying Genetic algorithm for
Prioritization of test cases Scenario derived from UML diagrams”, International journal of computer science, Vol.8, Issue 3, No.2, May 2011.
[10] Sultan H. Alijahdali et al, “The Limitation of Genetic Algorithm in Software Testing”, pp. 1-8.