B2C E-Commerce Acceptance: The Moderating Effect of Gender
Blanca Hernández-Ortega, University of Zaragoza, Zaragoza, Spain, [email protected]Julio Jiménez-Martínez, University of Zaragoza, Zaragoza, Spain, [email protected] Mª José Martín-De Hoyos, University of Zaragoza, Zaragoza, Spain, [email protected]
Abstract
The objective of this paper is to test the moderating effect of gender on e-purchasing behaviour. With this aim, we analyse a group of e-customers (males and females) with experience in online shopping through an extended Technology Acceptance Model. The results obtained show that there are significant differences derived from gender e-customer. The attitude of males has a greater influence on their intention to purchase online. Females give more importance to the effect of ease of use on attitude. The most important perceptions, self-efficacy and perceived usefulness, are the same in the behaviour of any e-customer.
Keywords: Gender differences, E-purchasing behaviour, Self-efficacy, Technology Acceptance Model.
1. Introduction
The study of the influence of gender on purchasing decisions and behaviour has been an especially interesting topic in the field of marketing. The two genders process information differently (Venkatesh and Morris, 2000), which leads them to have different perceptions of product characteristics (Meyers-Levy and Maheswaran, 1991).
Gender differences have been analysed in the acceptance of new information technologies (IT) (Lerouge et al., 2005; Huang, 2005) because males and females may value their characteristics and benefits differently (Gefen and Straub, 1997; Venkatesh and Morris, 2000). Some papers have analysed gender differences in IT and indicate that women are laggards in IT use, knowledge and skills (Brosnan and Lee, 1998, in the UK; Balka and Smith, 2000, in the USA). Nevertheless, these differences are not completely accepted by all the studies because, as users acquire knowledge and experience of IT, both genders may tend to stabilise their behaviour.
The objective of our research is to analyse the differences in e-purchasing behaviour that come from customer gender. We analyse the e-purchasing behaviour of a group of e-customers (males and females) who have carried out at least one purchase, through an extended Technology Acceptance Model. Our results contribute to the discussion on the difference between genders in IT use. Furthermore, practitioners and researchers can better understand how gender influences the attitudes of customers and predict how they will
respond to the characteristics and stimuli of e-commerce.
In the following section, the theoretical framework is explained and the hypotheses are formulated. In Section 3, we explain the methodology and, in Section 4, we carry out the relevant empirical analyses. Finally, we present the discussion of the results and the conclusions.
2. Theoretical Approach
In this section, the research model is developed. Firstly, we analyse the relationships that exist in e-customer behaviour. Secondly, differences in technological behaviour between males and females are explained.
2.1. Extended TAM
The Technology Acceptance Model (TAM) is an adaptation of the Theory of Reasoned Action (TRA), which is a general structure designed to explain almost all human behaviour and is based on how important an individual’s beliefs are for the prediction of his/her behaviour (Fishbein and Ajzen, 1975). The TAM focuses exclusively on the analysis of information technology (Davis, 1989; Davis et al., 1989) and, in contrast to TRA models, establishes a priori two key elements that determine technological behaviour: perceived ease of use (PEOU) and perceived usefulness (PU). Perceived usefulness is the degree to which an individual considers that the use of a particular system may improve his/her performance while ease of use concerns the degree to which an individual considers that the application of a specific technology does not require additional effort (Davis, 1989).
Recently, researchers have included other new concepts, either as antecedents of PEOU and PU or as intermediaries between these two variables and the final concept (intention or intensity of use). Their inclusion allows us to explain the individual’s behaviour more accurately. The factors considered are very varied and the most important are those related to internal motivations, such as perceived self-efficacy or attitude (Chen et al., 2002; Bruner and Kumar, 2005).
Perceived self-efficacy (PSE) is defined as “people's judgement of their capabilities to organize and execute a course of action required to attain designated types of performances” (Bandura, 1977). In the case of e-commerce, to be able to
carry out an efficient action, the individual must feel capable of handling and controlling the IT during the purchase act (Chau and Hu, 2001; Fagan et al., 03/04). We have extended the TAM to include perceived self-efficacy as this strongly affects the final behaviour of the e-customer (Vijayasarathy, 2004; Choi and Geistfeld, 2004; Yu et al., 2005). Perceived self-efficacy exerts a significant effect on other perceptions such as ease of use and usefulness, thus indirectly determining the intention to purchase online (Ong and Lai, 2006; Yi et al., 2006; Wu et al., 2007). The following hypotheses have been formulated to verify the effect of self-efficacy:
H1: Perceived self-efficacy has a positive influence on the perceived ease of use of e-commerce. H2: Perceived self-efficacy has a positive influence on the perceived usefulness of e-commerce.
Attitude (ATT) is another concept which is widespread in models that study the acceptance of new technologies. It has also been included both in one of the original formulations of TAM (Davis et al., 1989) and in later studies (Chen and Tan, 2004; Schneberger et al., 07/08). In all of them, attitude has played an intermediary role between perceptions and final behaviour (Ahn et al., 2004; Yu et al., 2005).
According to Winter et al. (1998), individuals who have a positive attitude towards computers make greater use of them than others because they perceive less anxiety and phobia before, during and after their action. In the case of e-commerce, PEOU and PU explain the attitude towards a certain technology (Chen and Tan, 2004; Schneberger et al., 07/08). Furthermore, attitude determines the intention to purchase online (BI) and thus the e-purchaser´s final behaviour (Ahn et al., 2004; Vijayasarathy, 2004). We have, therefore, formulated the following hypotheses:
H3: Perceived ease of use has a positive influence on attitude towards e-commerce.
H4: Perceived usefulness has a positive influence on attitude towards e-commerce.
H5: Attitude towards e-commerce positively affects the intention to make an electronic purchase.
In the following section, we test the differences that exist in these relationships between genders.
2.2. Gender differences in e-purchasing behaviour
As we have explained, the behaviour of e-customers with new IT may be conditioned by their gender (Hess et al., 2003; Yi et al. 2006).
Previous research has found that communication on the Internet may vary according to gender (Sussman and Tyson, 2000) and that there may be differences in web navigation strategies (Balka and Smith, 2000). Griffiths (1999) argued that ‘Internet addiction’ was likely to be male, while Morahan-Martin and Schumacher (2000) found ‘pathological Internet use’ to be 4 times more likely amongst males than females. Nevertheless, there is little research that takes this factor into account as a moderating effect of human behaviour on IT diffusion (as Sun and Zhang, 2006 claim).
The relationships tested with the basic TAM formulation, between perceived ease of use, perceived usefulness, attitude and intentions, vary according to the gender of the e-customer (Venkatesh et al., 2003; Yi et al., 05/06). So, these relationships must be separately analysed for both groups (males and females).
There is empirical evidence that females typically display higher levels of computer anxiety (McIlroy et al., 2001; Durndell and Haag, 2002; Huang, 2005) and lower levels of self-efficacy towards computers, the Internet and e-commerce (Comber et al., 1997; Broos, 2005). Todman (2000) found that the male-female gap in computer anxiety increased through the 1990s in the UK (with females becoming more anxious), whilst McIlroy et al. (2001) considered this difference to be falling slightly but persisting in the USA.
Ong and Lai (2006) conclude that the effect of self-efficacy on PEOU and PU is bigger in the case of females because they have a higher tendency toward emotion (Fisk and Stevens, 1993). However, Brosnan and Lee (1998) provide, with a study developed in Hong Kong, one of the few examples of the opposite finding for anxiety and self-efficacy where males were more computer anxious than females. We consider that the fact that females feel less confident than males in using IT implies that self-efficacy has less influence on usefulness and ease of use (as Shashaani, 1994 and Rozell and Gardner, 2000 state). Following this line of argument, we have formulated the following hypotheses:
H6: The effect exerted by perceived self-efficacy on perceived ease of use is greater for males than for females.
H7: The effect exerted by perceived self-efficacy on perceived usefulness is greater for males than for females.
Previous research has demonstrated that females perceive less ease of use in IT. This is considered to be one of the most important barriers to
technological development (Moon and Kim, 2001). Based on this idea, Venkatesh and Morris (2000) and Ong and Lai (2006) consider that females are especially motivated by PEOU, a perception that exerts a stronger effect on their attitude towards IT. Venkatesh et al. (2003) propose a unified theory of acceptance and use of technology (UTAUT) which considers the moderating effect of gender. For these authors, as for Im et al. (2008), the effect of PEOU on intention is stronger for females. The following hypothesis has been considered:
H8: The effect exerted by perceived ease of use on attitude is greater for females than for males.
As for perceived usefulness, prior studies have concluded that male students consider computers more useful than female students do (Shashaani and Khalili, 2001). Males are more pragmatic than females because they are more focused on satisfying their needs (Minton and Schneider, 1980), which leads them to give more importance to PU and to have a more positive attitude (Venkatesh et al., 2000; Shashaani and Khalili, 2001). Moreover, males appreciate more benefits from the use of some IT (Dholakia and Uusitalo, 2002; Citrin et al., 2003). Venkatesh and Morris (2000) analysed behaviour at three different moments in time and indicated that, in all cases, males considered PU or productivity-related factors to a greater extent than females. Thus, the effect of PU on attitude was stronger for males (as Venkatesh et al., 2003 and Im et al., 2008 state):
H9: The effect exerted by perceived usefulness on attitude is greater for males than for females.
Finally, much research has demonstrated that males have more positive attitudes towards IT and, thus, have more intention of using them (INT) (Rozell and Gardner, 2000; Sumner and Niederman, 2003/2004; and Broos, 2005). Males are more likely to adopt and use new IT, even in the first stages of learning, whereas females are more conservative (Abouserie et al., 1992).
H10: The effect of attitude on intention to purchase online is greater for males than for females.
In Figure 1, we can observe the relationships between the variables and the moderating effect of gender.
3. Methodology
The research tool used was Computer-Assisted Telephone Interviewing (CATI). In order to guarantee population representativeness, a random sampling method by proportions was used, according to age and gender criteria. A pre-test had been carried out to correct possible defects and foresee any doubts and problems that those polled might have during the information collection process.
A total of 2,615 telephone calls were made. After the refining process, 225 (27.95%) valid cases were obtained and corresponded to e-customers. All the variables were measured using 7-point Likert scales. The items included in the survey were those which have most commonly been used in previous TAM studies (Davis, 1989; Shih, 2004; Yu et al.,
2005).
Fig 1. Research Model 4. Results
4.1. Reliability and validity analyses
The initial reliability studies focused on eliminating all indicators with an item-total correlation of under 0.3 (Nurosis, 1993), or those whose exclusion raises the value of Cronbach's alpha over 0.7 (Nunnally,
1978). All the scales used were above these minimum recommended values (Table 1). The unidimensionality of the scales was analysed through a factorial exploratory analysis of the
H8 INTENTION TO
PURCHASE H5
PERCEIVED
SELF- EFFICACY ATTITUDE
H2 H1 H4 H3 PERCEIVED EASE OF USE PERCEIVED USEFULNESS GENDER H10 H6 H7 H9
principal components. In all cases (PSE, PEOU, PU, ATT and INT), the results obtained were clearly satisfactory.
The second step was a confirmatory factor analysis to guarantee the reliability and validity of the
scales. Statistical software EQS version 6.1 and the robust maximum likelihood estimation was used, as it does not require that sample complies with the normality properties (Bentler, 1995).
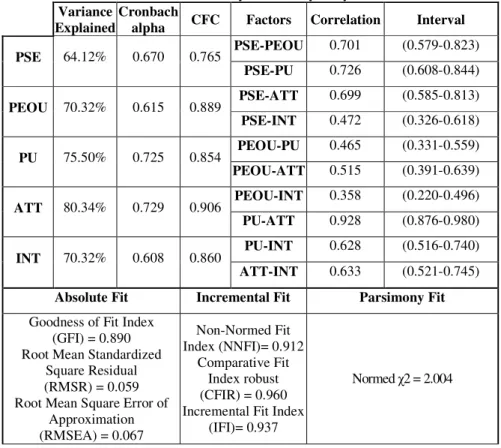
Table 1: Reliability and validity analysis
Variance
Explained
Cronbach
alpha CFC Factors Correlation Interval
PSE-PEOU 0.701 (0.579-0.823) PSE 64.12% 0.670 0.765 PSE-PU 0.726 (0.608-0.844) PSE-ATT 0.699 (0.585-0.813) PEOU 70.32% 0.615 0.889 PSE-INT 0.472 (0.326-0.618) PEOU-PU 0.465 (0.331-0.559) PU 75.50% 0.725 0.854 PEOU-ATT 0.515 (0.391-0.639) PEOU-INT 0.358 (0.220-0.496) ATT 80.34% 0.729 0.906 PU-ATT 0.928 (0.876-0.980) PU-INT 0.628 (0.516-0.740) INT 70.32% 0.608 0.860 ATT-INT 0.633 (0.521-0.745)
Absolute Fit Incremental Fit Parsimony Fit
Goodness of Fit Index (GFI) = 0.890 Root Mean Standardized
Square Residual (RMSR) = 0.059 Root Mean Square Error of
Approximation (RMSEA) = 0.067 Non-Normed Fit Index (NNFI)= 0.912 Comparative Fit Index robust (CFIR) = 0.960 Incremental Fit Index
(IFI)= 0.937
Normed χ2 = 2.004
We progressively eliminated indicators that failed to satisfy one or more of the criteria proposed by Jöreskog and Sörbom (1993)1: weak convergence (Steenkamp and Van Trijp, 1991), strong convergence (Steenkamp and Van Trijp, 1991) and explanatory coefficient (R² < 0.3). All the items achieved acceptable values in the three criteria, so we tested the measures of fit of the measurement model. The values obtained from this exceeded the optimal levels (Table 1), so the last step before the structural analysis was to study the reliability and validity of the constructs (Churchill, 1979; Gerbing and Anderson, 1988).
Following the initial test of Cronbach's alpha, the reliability of the scales was tested using the composite reliability coefficient (CRC). The results
1
The weak convergence criterion eliminates items that do not present significant factorial regression coefficients (Steenkamp and Van Trijp, 1991). The strong convergence criterion implies rejecting non-substantial indicators –i.e., those whose standardised coefficient is less than 0.5 (Steenkamp and Van Trijp, 1991).
achieved exceeded the recommended limit of 0.6 (Bagozzi & Yi, 1988) in all cases. With regards to validity, this is divided into convergent and discriminant validity. The first of these is satisfied since we find that the standardised loadings exceed 0.5, and they are also significant at the 99% confidence level (Steenkamp & Van Trijp, 1991). The discriminant validity is established by calculating the confidence interval between different factors and verifying that 1 is not included in any of them (Table 1).
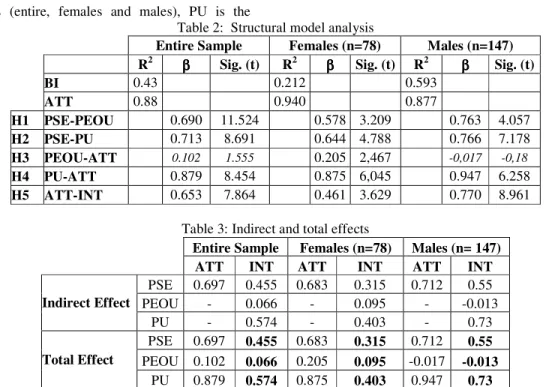
4.2. Structural model analysis
The next step was to analyse the formulated causal relationships. First of all, we have tested the structural model with the data from the entire sample (i.e. females and males pooled together) and each of the sub-samples (i.e. females and males taken separately). We find that the models have a good fit, since the majority of indices achieve the optimal theoretical values (Hair et al., 1999). Standardised path coefficients and their significance and the R2 for
attitude and intentions to purchase are shown in Table 2.
Four of the hypotheses formulated in the first set are validated by the entire sample with the exception of the one that relates ease of use to attitude. For the female sample, the five initial hypotheses are supported, whereas, for males, H3 is rejected.
The direct, indirect, and total effects of self-efficacy, PEOU and PU on attitude and intention to purchase are summarised in Table 3. In all the samples (entire, females and males), PU is the
strongest total effect on attitude and on intention to purchase. Moreover, the indirect effect of self-efficacy on final behaviour, via PEOU and PU, makes it the second most important motivation. Perceived ease of use has no significant influence on attitude in the whole sample, so it does not play an important role in future purchase behaviour. The PEOU of the female sample, despite achieving a significant value on attitude, has a reduced total effect on purchase intention.
Table 2: Structural model analysis
Entire Sample Females (n=78) Males (n=147)
R2 ββββ Sig. (t) R2 ββββ Sig. (t) R2 ββββ Sig. (t)
BI 0.43 0.212 0.593 ATT 0.88 0.940 0.877 H1 PSE-PEOU 0.690 11.524 0.578 3.209 0.763 4.057 H2 PSE-PU 0.713 8.691 0.644 4.788 0.766 7.178 H3 PEOU-ATT 0.102 1.555 0.205 2,467 -0,017 -0,18 H4 PU-ATT 0.879 8.454 0.875 6,045 0.947 6.258 H5 ATT-INT 0.653 7.864 0.461 3.629 0.770 8.961
Table 3: Indirect and total effects
Entire Sample Females (n=78) Males (n= 147)
ATT INT ATT INT ATT INT
PSE 0.697 0.455 0.683 0.315 0.712 0.55 PEOU - 0.066 - 0.095 - -0.013 Indirect Effect PU - 0.574 - 0.403 - 0.73 PSE 0.697 0.455 0.683 0.315 0.712 0.55 PEOU 0.102 0.066 0.205 0.095 -0.017 -0.013 Total Effect PU 0.879 0.574 0.875 0.403 0.947 0.73
4.3. Analysis of the differences between females and males
Having studied the TAM model of each sample, the next step was to test the differences between the male and female samples posed in H6 to H10, using a multisample analysis. The tool we used was the Lagrange multiplier (LM), using the chi-square test (Bentler, 1995). Before analysing each relation we checked that the fit indices for the multisample model achieved optimal values: GFI= 0.837; RMSEA 0.071; NFI= 0.888; CFI 0.908; IFI 0.911; Normed X2 = 2.14.
From the results obtained (Table 4), we can conclude that there are significant differences in the behaviour of male and female e-customers. Firstly we observe that, in the female sample, PEOU has a stronger influence than in the male sample, so H8 is accepted. Secondly, males have a more positive attitude towards e-commerce, which exerts a stronger effect on intention to purchase. Thus, H10 is satisfied.
Table 4: Multisample analysis
Hypothesis Chi-square Probability Result
H6 PSE-PEOU Males> Females 0.029 0.864 Rejected
H7 PSE-PU Males> Females 0.022 0.882 Rejected
H8 PEOU-ATT Females> Males 4.057 0.044 Satisfied
H9 PU-ATT Males> Females 0.366 0.545 Rejected
With regard to the other relations, although the gender differences present the tendency theoretically expected (males>females), none of them achieves significant values. Therefore, H6, H7 and H9 are rejected. Likewise, the effects of PSE on PEOU and PU do not show significant differences between males and females. The effect of PU on attitude has the same importance (Table 4).
Our study verifies the existence of differences in the behaviour of e-customers derived from their gender. Therefore, past experiences and perceptions of online purchasing were conditioned by the gender of the user, which, at the same time, determines future intentions of purchase.
5. Discussion
The objective of our research has been to analyse the differences in e-purchasing behaviour that come from customer gender. To do so, we analyse e-purchasing behaviour in a group of e-customers with experience in online shopping and test for differences between males and females.
The results show that self-efficacy is a key perception in the development of e-commerce as it exerts a significant and positive effect on two TAM factors, namely, ease of use and usefulness. These results are similar to those obtained by the Decomposed Theory of Planned Behaviour (Taylor and Todd, 1995) and the Social Cognitive Theory (Bandura, 1977), which consider that self-efficacy drives the individual to behave more efficiently. We should point out that the effect of this factor is the same, regardless of gender. So, we should reject statements that defend a bigger anxiety in females when interacting with IT.
This similarity in self-efficacy is probably caused by the experience of the sample analysed. E-customers have already carried out several online purchases and the anxiety produced during the first interactions is overcome. Differences related to self-efficacy may exist prior to first purchases but, once the first purchases are made, males and females perceive a similar control level. There are several studies which revealed that IT experience plays a role in narrowing the gender gap (Rainer et al., 2003; Wong and Hanafi, 2007).
Perceived ease of use influences female behaviour but is rejected in the male sample. On the other hand, perceived usefulness has the strongest effect on e-purchasing behaviour and shows no difference between genders.
As for the R2, the model tested fits the male behaviour better, reaching 60% as opposed to the
21% for the females. The lower R2 of purchase intention for the female sample is probably due to the lack of variables to explain her e-purchasing behaviour; these variables may not be so important in the male sample. This supports the idea of gender differences.
6.- Conclusions
The results obtained have important implications for business and future research. As for the research contributions of this paper, the proposal of gender as a moderating variable in e-commerce is an interesting variation with respect to the traditional approach. Research carried out in recent years has treated all e-customers in the same way, considering that the limited development of e-commerce prevented any differentiation that depended on moderating socio-demographical variables. However, e-commerce has increased considerably, so e-purchasing behaviour can be analysed according to the gender of the e-customer. Our study has demonstrated that, although some perceptions are the same, others vary between males and females.
On the one hand, males show a more positive attitude to the idea of buying products via the Internet, which increases intention to purchase. On the other hand, females give more importance to the effect exerted by ease of use on attitude. The effect of PEOU is rejected for the entire and the male samples, but has a relevant role in the study of female behaviour. The most important perceptions (self-efficacy and perceived usefulness) are the same for e-customer.
The differences we have found between males and females in user perceptions towards e-commerce shows the necessity of taking gender into consideration in the development of new theories. Furthermore, models previously tested should be adapted to take these differences into account. The different explanatory power between genders implies that future research into female behaviour should include factors that are not necessary in the case of male studies.
The differences obtained in this study are not the same as those found in others about potential e-customer purchasing behaviour. We can conclude that the differences vary according to the customers' experience with this IT.
Managers and developers can increase intention to purchase through PU and self-efficacy. Companies can provide training courses to improve knowledge about the benefits of e-commerce compared to traditional purchasing channels. Training increases perceptions of self-efficacy and ease of use and allows e-customers to develop gradually in their use
of e-commerce and IT. Furthermore, public administration should encourage technological knowledge at all levels of society, from primary school to vocational training. The diffusion of this knowledge will lead to a homogenous level of technological implementation and an increase in social welfare.
As for the limitations of our research, we wish to point out that the analysis of purchasing behaviour has been based on a general definition of e-commerce that does not define the type of product bought. The type of product exchanged may modify the user's behaviour and perceptions about e-commerce. The same risk is not taken with an intangible good as with a tangible one (see Brown et al., 2003). Therefore, future research must distinguish between the different types of product and the perceptions that affect each purchase.
6. References
[1] Abouserie, R., Moss, D., and Barasi, S. “Cognitive style, gender, attitude toward computer assisted learning and academic achievement”, Educational Studies (18:2), 1992, 151-160.
[2] Ahn, T., Ryu, S., and Han, I. “The impact of the online and offline features on he user acceptance of Internet shopping malls”,
Electronic Commerce Research and Applications (3), 2004, 405-420.
[3] Bagozzi, R. P. and Yi, Y. “The evaluation of structural equation models”, Academy of Marketing Science (16:1), 1988, 74-94. [4] Balka, E., and Smith, R. Women, work and
computerization: charting a course to the future, Kluwer Academic Publishers, 2000, Boston, MA, 58-69.
[5] Bandura, A. Social learning theory,
Englewood Cliffs, N.J., 1977, Prentice-Hall Inc.
[6] Bentler, P. M. EQS structural equations program manual, 1995, Multivariate Software, Inc., C.A.
[7] Broos, A. “Gender and information and communication technologies (IT) anxiety: male self assurance and female hesitation”,
CyberPsychology and Behaviour (8:1), 2005, 21-31.
[8] Brosnan, M., and Lee, W. “A cross-cultural comparison of gender differences in computer attitudes and anxieties: the United Kingdom and Hong Kong”, Computers in Human Behavior (14:4), 1998, 559-577.
[9] Brown, M., Pope, N., and Voges, K. “Buying or browsing?: an exploration of shopping orientations and online purchase intention”,
European Journal of Marketing (37:11/12), 2003, 1666–1684.
[10]Bruner, G.C., and Kumar, A. “Explaining consumer acceptance of handheld Internet devices”, Journal of Business Research (58:5), 2005, 553-558.
[11]Chau, P. Y. K., and Hu, P. J. “Information technology acceptance by individual professionals: a model comparison approach”,
Decision Sciences (32:4), 2001, 699-719. [12]Chen, L., and Tan, J. “Technology adaptation
in e-commerce: key determinants of virtual stores acceptance”, European Management Journal (22:1), 2004, 74-86.
[13]Chen, L., Gillenson, M., and Sherrel, D. “Enticing online consumers: an extended technology acceptance perspective”,
Information and Management (39), 2002, 705-719.
[14]Choi, J., and Geitsfeld, L. V. “A cross-cultural investigation of consumer e-shopping adoption”, Journal of Economic Psychology
(25:6), 2004, 821-838.
[15]Churchill, J. R. “A paradigm for developing better measures of marketing construct”,
Journal of Marketing Research (February), 1979, 64-73.
[16]Citrin, A., Stem, D. E., Spangenberg, E. R., and Spark, M. J. “Consumer need for tactile input: An internet retailing challenge”, Journal of Business Research (56:11), 2003, 915. [17]Comber, C., Colley, A., Hargreaves, D. J., and
Dorn, L. “The effects of age, gender and computer experience upon computer attitudes”,
Educational Research (39:2), 1997, 123–33. [18]Davis, F. D. “Perceived usefulness, perceived
ease of use and user acceptance of information technology”, MIS Quarterly (13:3), 1989, 319-39.
[19]Davis, F. D., Bagozzi, R., and Warshaw, P. “User acceptance of computer technology: a comparison of two theoretical models”,
Management Science (35:8), 1989, 982-1002. [20]Dholakia, R. R., and Uusitalo, O. “Switching to
electronic stores: consumer characteristics and the perception of shopping benefits”,
International Journal of Retail and Distribution Management (30:10), 2002, 459-469.
[21]Durndell, A., and Hagg, Z. “Computer self efficacy, computer anxiety, attitudes towards the Internet and reported experience with the Internet, by gender, in an East European sample”, Computers in Human Behavior
(18:5), 2002, 521-535.
[22]Fagan, M. H., Neill, S., and Wooldridge, R. B. “An empirical investigation into the relationship between computer self-efficacy, anxiety, experience, support and usage”, The Journal of Computer Information Systems
[23]Fishbein, M., and Ajzen, I. Belief, attitude, intention, and behavior: an introduction to theory and research, 1975, Addison-Wesley. [24]Fisk, S. T., and Stevens, L. E. “What’s so
special about sex?. Gender stereotyping and discrimination”, In S. Oskamp and M. Costanzo (Eds.), Gender issue in contemporary society, 173-196, 1993, Newbury Park, CA: Sage.
[25]Gefen, D., and Straub, D. W. “Gender differences in the perception and use of e-mail: an extension to the technology acceptance model”, MIS Quarterly (1:4), 1997, 389-400. [26]Gerbing, D. W., and Anderson, J. C. “An
updated paradigm for scale development incorporating unidimensionality and its assessment”, Journal of Marketing Research
(25), 1988, 186-192.
[27]Griffiths, “Internet addiction: fact or fiction”,
The Psychologist (12), 1999, 247-250.
[28]Hair, J. F., Anderson, R. E., Tatham, R. L., and Black, W. C. Multivariate Data Analysis. Prentice Hall, 1999, New Jersey.
[29]Hess, T. J., Fuller, M. A., and Mathew, J. “Gender and personality in media rich interfaces. do birds of a feather flock together?”, Proceedings of the Second Annual Workshop on HCI Research in MIS, Seattle, WA, December, 2003, 22-26.
[30]Huang, E. “The acceptance of women-centric websites”, The Journal of Computer Information Systems, 45(4), 2005, 75-84. [31]Im, I., Kim, Y., and Han, H. Y. “The effects of
perceived risk and technology type on users’ acceptance of technologies”, Information and Management (45:1), 2008, 1-9.
[32]Jöreskog, K., and Sörbom, D. “LISREL 8 Structural Equation Modelling with the Simplis Comand Language”, Scientific software International 1993, Chicago-Illinois.
[33]Lerouge, C., Newton, S., and Blanton, E. “Exploring the systems analyst skill set: perceptions, preferences, age, and gender”, The Journal of Computer Information Systems
(45:3), 2005, 12-24.
[34]Mcilroy, B., Bunting, K., Tierney, and Gordon, M. “The relation of gender and background experience to self-reported computing anxieties and cognitions”, Computers in Human Behavior (17:1), 2001, 21-33.
[35]Meyers-Levy, J., and Maheswaran, D. “Exploring differences in males' and females' processing strategy”, Journal of Consumer Research (18:June), 1991, 63-70.
[36]Minton, H. L., and Schneider, F. W.
Differential psychology, Monterey, 1980, CA: Brooks/Cole.
[37]Moon, J. W., and Kim, Y. G. “Extending the TAM for a World-Wide-Web context”,
Information and Management (38:4), 2001, 217-230.
[38]Morahan-Martin, J., and Schumacher, P. “Incidence and correlates of pathological Internet use among college students”,
Computers in Human Behavior (16:1), 2000, 13-29.
[39]Nunnally, J. Psychometric theory, McGraw-Hill, 2nd ed., 1978, New York.
[40] Nurosis, M. Statistical Data Analysis, SPSS Inc. 1993.
[41]Ong, C. S., and Lai, J. Y. “Gender differences in perceptions and relationships among dominants of e-learning acceptance”,
Computers in Human Behavior (22), 2006, 816–829.
[42]Rainer, K. Jr., Laosethakul, K., and Astone, M. K. “Are gender perceptions of computing changing over time?”, The Journal of Computer Information Systems (43:4), 2003, 108.
[43]Rozell, E. J. and Gardner, W. L. “Cognitive, motivation and affective process associated with computer related performance: a path analysis”, Computers in Human Behaviour
(16), 2000, 199-222.
[44]Schneberger, S., Amoroso, D. L., and Durfee, A. “Factors that influence the performance of computer-based assessments: an extension of the technology acceptance model”, The Journal of Computer Information Systems
(48:2), 2007/8, 74-91.
[45]Shashaani, L. “Gender differences in computer experience and its influence on computer attitudes”, Journal of Educational Computing Research (11:4), 1994, 347-367.
[46]Shashaani, L., and Khalili, A. “Gender and computers: similarities and differences in Iranian College Students’ attitudes toward computers”, Computers and Education (37:3), 2001, 363–375.
[47]Shih, H. “An empirical study on predicting user acceptance of e-shopping on the web”,
Information and Management (41), 2004, 351-368.
[48]Steenkamp, J. P., and Van Trijp, H. C. M. “The use of Lisrel in validating marketing constructs,” International Journal of Research in Marketing (8:November), 1991, 283-299. [49]Sumner, M., and Niederman, F. “The impact of
gender differences on job satisfaction, job turnover, and career experiences of information systems professionals”, The Journal of Computer Information Systems (44:2), 2003/4, 29-40.
[50]Sun, H., and Zhang, P. “The role of moderating factors in user technology acceptance”,
International Journal of Human-Computer Studies (64:2), 2006, 53-78.
[51]Sussman, N. M., and Tyson, D. H. “Sex and power: gender differences in computer-mediated interactions”, Computers in Human Behavior (16:4), 2000, 381-394.
[52]Taylor, S., and Todd, P. A. “Understanding information technology usage: a test of competing models”, Information Systems Research (6:2), 1995, 144-176.
[53]Todman, J. “Gender differences in computer anxiety among university entrants since 1992”,
Computers and Education (34:1), 2000, 27-35. [54]Venkatesh, V., and Morris, M. G. “Why don't
men ever stop to ask for directions?. Gender, social influence, and their role in technology acceptance and usage behaviour”, MIS Quarterly (24:1), 2000, 115-139.
[55]Venkatesh, V., Morris, M., and Ackerman, P. L. “A longitudinal field investigation of gender differences in individual technology adoption decision making processes”, Organizational Behavior and Human Decision Processes (83), 2000, 33-60.
[56]Venkatesh, V., Morris, M. G., Davis, G. B., and Davis, F. D. “User acceptance of information technology: toward a unified view”, MIS Quarterly (27:3), 2003, 425-478. [57]Vijayasarathy, L. R. “Predicting consumer
intentions to use on-line shopping: the case for an augmented technology acceptance model”,
Information and Management (41), 2004, 747-762.
[58]Winter, S., Chudoba, K., and Gutek, B. “Attitudes toward computers: when do they predict computer use?”, Information and Management (34), 1998, 275-284.
[59]Wong, S. L., and Hanafi, A. “Gender differences in attitudes towards information technology among Malaysian student teachers: a case study at Putra Malaysia”, Educational Technology and Society (10:2), 2007, 158-169. [60]Wu, J. W., Chen, Y. C., and Lin, L. M.
“Empirical evaluation of the revised end user computing acceptance model”, Computers in Human Behavior (23:1), 2007, 162-174. [61]Yi, M. Y., Jackson, J. D., Park, J. S., and
Probst, J. “Understanding information technology acceptance by individual professionals: toward an integrative view”,
Information and Management (43:3), 2006, 350-363.
[62]Yu, J., Ha, I., Choi, M., and Rho, J. “Extending the TAM for a t-commerce”, Information and Management (42:77), 2005, 965-976.
Copyright © 2008 by the International Business Information Management Association (IBIMA). All rights reserved. Authors retain copyright for their manuscripts and provide this journal with a publication permission agreement as a part of IBIMA copyright agreement. IBIMA may not necessarily agree with the content of the manuscript. The content and proofreading of this manuscript as well as and any errors are the sole responsibility of its author(s). No part or all of this work should be copied or reproduced in digital, hard, or any other format for commercial use without written permission. To purchase reprints of this article please e-mail: [email protected].