Zoltán Pápai
•
SUBSTITUTABILITY BETWEEN
FIXED AND MOBILE TELEPHONE SERVICES
The present paper discusses the results of an empirical study on substitution between fixed and mobile telephone services in the Hungarian retail market, carried out in 2008 and 2009. The study used a survey designed for examining fixed-mobile substitution; it was carried out using the stated preference method on a sample of 1000 people in September 2008. The effects of price changes were studied both with regard to access (telephone subscription) and usage substitution (the respondent’s last five calls). In addition to prices, the effects of lifestyle and demographic factors on demand were also studied, as were alternative substitution options and the “telecommunications budget” hypothesis. The results indicate that mobile telephone access demand has a rather low price elasticity (a value of less than –0.3 for a hypothetical price raise). Fixed-line demand, on the other hand, is elastic (–1.4). The rate of usage substitution is significantly lower in the short term (in the presence of existing subscriptions) than it is for longer-term access decisions.INTRODUCTION
The present paper discusses the results of a study on substitution between fixed and mobile telephone services, carried out in 2008 and 2009. In this period, the share and importance of mobile data services was significantly lower in Hungary than after 2010; the effects of the arrival of smartphones emerged only after the research was completed. Therefore, the data collected on voice service substitution are only valid with regard to the time period and market conditions in question; as a result, the results cannot be directly transferred to a smartphone dominated market environment. Nevertheless, the study was carried out at a time that was very interesting with regard to the development of telecommunications markets, and the effects of the events of this period are still felt to a significant extent today. Therefore, we feel that this analysis provides useful information regarding the de-velopment of markets and helps to understand the interactions of fixed-line and mobile services.
In September 2008 there were 3,145,000 fixed telephony connections on the Hungarian market. 91.4% of these were traditional PSTN or ISDN lines, while the
remaining 8.6% were IP on broadband lines provided by cable operators. At the same time, there were 11,771,000 mobile phone connections in the country, 61.4% of which were prepaid SIM cards. According to market research commissioned by the National Communication Authority of Hungary and carried out in fall 2008, 55.8% of households had a fixed phone, and 81.7% of families had at least one mo-bile phone. The use of fixed phones was already declining by this stage: the share of households with a phone had fallen by 17 percentage points compared to the 73% in 2002. Up to this period, mobile phone penetration was increasing, although the rate of growth was gradually slowing down.
The number and minute volume of fixed telephone calls had essentially fallen by half. The number of mobile calls increased by 76% in the same period, and their aggregate length tripled.
These trends, indicative of changes in the consumption of communication ser-vices, clearly show that substitution is taking place to some extent, but in them-selves they do not prove that this process constitutes substitution in the technical economic sense.
An analysis of fixed-mobile telephone service substitution is of great importance for understanding market changes and with a view to regulation. It also influences the definition1 of the market of fixed telephone services, which is being carried out
based on EU recommendations. Whether fixed and mobile telephone services are part of the same market depends, among other things, on the extent of demand substitution between the two services. Defining the market is the first step in any regulatory process based on the analysis of the market in question. Whether a regu-lator identifies market power in the affected markets defined by the regua regu-lator greatly depends on the definition of the market.
In the Hungarian regulatory framework, fixed and mobile services were not treated as part of the same market before 2009. The separation of these markets was not based on a market definition and analysis procedure carried out on economic grounds; it was primarily based on the differing characteristics of the products, and associated empirical studies also primarily targeted the characteristics of the servic-es. Studies had previously been published on the issue, using theoretical-method-ological approaches (e.g. Infrapont [2006]) or empirical research (e.g. Tárki [2004]) based on a subjective assessment of substitution, where respondents were asked if they felt that the services were substituted.
There are numerous theoretical and practical issues associated with measuring substitution between fixed and mobile telephone services. Our research attempted
1 Commission Recommendation 2003/311/EC of 11 February 2003 on relevant product and services markets within the electronic communications sector susceptible to ex ante regulation in accord-ance with Directive 2002/21/EC of the European Parliament and of the Council of 7 March 2002 on a common regulatory framework for electronic communications networks and services.
to find a solution to these problems and to allow fixed-mobile substitution to be measured in practice and analyzed. The relevant data were subsequently collected. The following section provides a short overview of the general economic frame-work of substitution between the two service types. After this section, we will briefly discuss the special characteristics of telephony services that need to be taken into account when analyzing substitution. Afterwards, we provide a very brief analysis of the methods and results reported in the international literature on fixed-mobile substitution, and then we discuss in detail the methodology of our research, the operational solutions for measuring substitution and the questions included in the questionnaire. When discussing the study results, we present the statistical distribu-tions of the use of telecommunicadistribu-tions services, consumers’ views on such services and their subjective opinions on demand and substitutions. We also provide a brief analysis of the effects of demographic factors on the demand for such services. The next section presents our findings on the extent of substitution, also calculated as elasticity indicators. At the end of the paper, an interpretation of the elasticity in-dicators is offered, and conclusions are drawn.
MEASURING SUBSTITUTION
The simplest case of demand (consumption) substitution is substitution between two different goods (products or services). The present study examines a situation of this type: substitution in demand between fixed and mobile telephone services. Demand substitution between two goods exists when some external factor causes consumers to change their demand for both goods, and there is a causal relationship between the changes in demand. In such situations, some factor affecting demand for one product or service also affects demand for the other; therefore, changes in the demand for either of the goods cannot be separated from changes in the de-mand for the other.
Substitution is measured using the demand function. The demand function shows how much of a product or service a consumer consumes (how much their demand is) as a function of price (the price of the product or service in question and those of other goods that affect demand), the consumer’s income and other relevant factors. The demand function used in demand analysis includes independent vari-ables the changes of which can provoke substitution. However, the most important factor is the price change. The effects of price changes on demand are described by the price elasticity of demand. With regard to demand substitution between two goods, a positive cross-price elasticity indicates substitutability, and the value shows how extensive the substitution is. However, demand for telephone services differs from demand for other goods in many ways; the next chapter provides an overview of its characteristics.
Characteristics of the demand for telephone services
One of the unique characteristics of the demand for telecommunications services is that it is made up of two components. One is the demand for individual, specific calls. This is called usage demand. Demand for telephone subscriptions or access de-rives from the fact that the possibility (the option) of making phone calls is valuable to consumers. Probabilities of initiating or receiving individual calls with available subscribers vary between 0 and 1. These probabilities and the usefulness of the calls (instances of communication) determine the user’s demand for a subscription. Therefore access demand depends on usage demand, i.e. the derived demand arising from expected usage (Taylor [1994]).
In the case of telephone services, the value of a connection to the network for a consumer also depends on how many other users have joined the network, i.e. the size of the network. How many people a consumer can reach through the telephone network and how many people can reach them affects how much they are willing to spend on the service. The larger the network – ceteris paribus – the more attrac-tive it is to consumers.2 This is called the network effect. Liebowitz–Margolis [2002]
provided a good overview of the network effect in telecommunications services. Subsequently, numerous studies have examined the issue with regard to mobile telecommunications; the findings of Kim–Kwon [2003], Fu [2004], Huang [2006] and Grajek [2007] confirm the existence of a network effect.
This network effect has an impact on the substitution or complementarity of the two services under examination. As the utility of a service depends on the number of users on the network, the interconnection of fixed and mobile networks meant that the number of mobile phone subscribers also provided a utility increase to fixed subscribers and vice versa, creating a complementary relationship. According to Liebowitz–Margolis [2002], as long as the number of mobile subscribers is low, there is a positive externality influence, and the two services are complementary. As prices fall and the number of subscribers increases, however, substitution becomes the dominant phenomenon.
Due to the fact that telecommunications demand can be split up into two sepa-rate elements, consumer decisions are often modeled as a two-phase decision process. In this framework, the consumer first decides whether to subscribe to the service
2 If the subscribers of all networks become accessible to users of all other networks due to the uni-versal interconnection obligation, then the network size is the same for every user, but the price of access and accessibility still differs between networks. In such situations, rational consumers make decisions based on the average price, which is determined by the cost of calling the people they wish to communicate with, i.e. their community of interest. This in turn depends on which network the people in question are using. Therefore, when there are several networks, deciding which one to subscribe to requires solving a coordination problem in addition to taking external-ities into account.
(this is a one-time discretionary decision). If the consumer has chosen to subscribe, they decide how much to use the service (this is a continuous decision).3 This
deci-sion can be modeled as two successive decideci-sions, or it can be seen as a simultane-ous decision situation.4 The model used in Train–McFadden–Ben-Akiva [1987] is
based on a simultaneous approach, while the findings of Miravete [2002], Miravete –Narayanan–Chintagunta [2007] and Iyengar [2004] underline the importance of
the temporal separation of the subscription decision and the usage decision. Empirical analyses carried out over the last few years (Lambrecht–Seim–Skiera
[2005], Huang [2006], Goettler–Clay [2006]) indicate that structural models must include the uncertainty of future usage, as the faulty expectations of consumers must also be taken into account when modeling demand.
Using telephone services requires the joint consumption decision of two parties, the calling party and the called party, which is to say that the call has utility not only for the calling party, who generates the demand, but also for the called party, who does not pay for the utility thus obtained (the incoming call). This is called call ex-ternality. Numerous studies examined call externality (see for instance Littlechild
[1975]), but its impact is presumably not particularly great, and there is a high likelihood of a type of reciprocity emerging between parties that call each other regularly, exchanging roles as the calling party and the called party. As a result of this, call externality is generally internalized.5
Another particular feature of telephony demand is that it can self-generate, in the sense that a call may cause further communication to become necessary later on, thus generating further calls (e.g. calling back the original calling party).
Over the last few decades, numerous new communication services haveemerged, such as e-mail, chat, or voice calls via the Internet (VoIP, of which Skype is a good exam-ple). These can replace telephone calls, as they can help people exchange information. There are also package offers on the market, in which telephone subscriptions are sold at a discount bundled with television or Internet subscriptions. The system of discounts makes modeling more difficult, as it creates a sort of complementary relationship between the elements of the package.
Demand for residential and business services should be analyzed separately, as further special factors need to be taken into account when examining the latter. The present study is not concerned with the business market, focusing exclusively on demand on the residential market.
3 Essentially, the concept of derived demand is also based on this characteristic.
4 It should also be mentioned that the decision on access is a long-term decision (and there is a switching cost associated with it), while, once access exists, the other decision can change dy-namically without switching cost in accordance with the consumer’s current needs and external factors (such as pricing).
5 As call externality emerges between a low number of parties (and is usually bilateral), it is likely to be internalized.
Fixed-mobile substitution
With regard to the modeling of fixed-mobile substitution, the fact that there are sep-arate demands for access and for usage means that there are two types of substitution when it comes to telecommunications services. With regard to fixed and mobile tele-phone services, access substitution means that, when certain factors are present, con-sumers cancel their fixed telephone subscription and purchase a mobile subscription (or vice versa, but this is less interesting from a practical perspective). Usage substitu-tion or traffic substitusubstitu-tion refers to changes in the quantity of fixed and mobile calls. The empirical literature contains the results of numerous measurements of usage substitution. Most of the models examining access substitution6 and usage
substitu-tion7 confirmed that substitution is taking place between mobile and fixed telephone
services. However, a comparison of the models also shows that both the questions posed by various research projects and the methods employed in them varied con-siderably: there is no standard procedure for studying fixed-mobile substitution.
With regard to usage substitution, for instance, Sung [2003] examined fixed-mo-bile usage substitution in Korea by modeling point-to-point demand, in which the calls on the incumbent’s network from region A to region B are affected by the price of long-distance calls and mobile calls from A to B. Ahn–Lee–Kim [2004] estimated the
ratio of fixed and mobile call minutes, also in Korea. The model’s explanatory factors include relative prices and the number of fixed and mobile subscribers. Ward–Woroch
[2004] measured the effects of fixed and mobile prices on fixed and mobile call minutes. The authors used a special data collection method for their research: they asked house-holds to submit their telecommunications bills for ten quarters (TNS “bill harvest”). With regard to access substitution, Sung–Kim [2002] did not model the number of fixed telephone connections, but rather the number of new subscriptions and cancellations. Rodini–Ward–Woroch [2003] also relied on telecommunications bills (TNS “bill harvest”) for data. In this model, the authors measured the effects of fixed prices on mobile subscriptions. Garbacz–Thompson [2007] undertook the task of estimating the demand for residential fixed and mobile services (and penetration) in 53 developing countries in the period between 1996 and 2003.
There are various models designed to examine product consumption that separate one particular product group from other products. Demand for this product group is modeled using a conditional/limited demand function, where a separate budget is es-tablished within the consumer’s income, designated by the consumer for this group of products (see for instance: Eales–Unnevehr [1988], Baker–Blundell–Micklewright
[1989], Hayes–Wahl–Williams [1990], Sellen–Goddard [1997], Edgerton [1997]).
6Sung–Lee [2002], Rodini–Ward–Woroch [2003], Horváth–Maldoom [2002], Garbacz–Thompson [2007].
This approach is based on the assumption that consumers make sequential decisions about how to spend their income. As a first step, the consumer divides their income between multiple product categories, and then proceeds to divide each sub-budget between the products of each category.
Hereinafter, the use of this two-step budgeting concept when analyzing the de-mand for telecommunications services will be referred to as the telecommunications budget hypothesis. According to this hypothesis, there is a sum that people devote to telecommunication, and if the price of one telecommunications service changes, they reallocate their consumption (spending) within this budget. When examining telecommunications service substitution, it is important to determine whether con-sumers apply the thinking posited by the telecommunications budget hypothesis, i.e. whether they tend to subscribe to new services if one of the services they use becomes cheaper.
RESEARCH METHODS
The goal of our research, funded by the Competition Culture Centre of the Hun-garian Competition Authority and the National Communication Authority, was to measure economic substitution between fixed and mobile telephone services using a questionnaire-based survey. Demand for mobile and fixed telephone services is affected by price as well as by numerous lifestyle-related, sociological and psycho-logical factors. Therefore, substitution was examined using demand models. Our research attempts to separate the effects of these two types of factors – prices on the one hand and other factors on the other. The effects of pricing were studied using a special type of preference analysis model that examines both revealed and
stated preferences, while non-price factors were studied using a set of questions about facts and opinions. As the stated preference methodology is not commonly used in economics studies for measuring the effects of pricing, we first discuss this method and the specific subtype chosen for this study, the combined model. This is followed by a discussion of the survey questions regarding access substitution, usage substitution and non-price factors.
The stated preference methodology
The stated preference methodology has frequently been employed in certain areas of demand analysis, for example in the evaluation of environmental resources (see the overview by Boxallet al. [1996]), and certain tourism-related studies (see the overview by Louviére–Timmermans [1990]). The methodology is rarely employed for modeling telecommunications services, although there are precedents for such use (Tseng–Tsiu [2005], Lee–Kim–Ahn [2006]).
The methodology is built on Lancaster’s [1966] and [1971] consumer decision models, conceptualizing goods as a linear combination of their main characteris-tics or attributes. This allows for the creation of a demand function that describes demand as dependent on the characteristics of the goods.
As part of the method, researchers compile a questionnaire in which respond-ents evaluate alternatives with differing features (in tourism surveys, for instance, features include distance, the type of activities available, accommodation and price). The method often relies on conjoint analysis when it comes to arranging and choos-ing alternatives and rankchoos-ings to be included in the questionnaire. The next step is establishing utility levels (estimating the utility function) based on consumers’ as-sessments, which is most often done using the ordinary least square (OLS) method. Then decisions are predicted based on a comparison of utility levels. Subsequently, expected market shares can be estimated on the basis of the distribution of indi-vidual decisions (Louviére–Timmermans [1990]).
A special kind of stated preference model is one that combines revealed prefer-ence and stated preferprefer-ence. This model takes into account the respondent’s previous decisions when choosing the alternatives to be offered to them. First, respondents are asked about their previous experiences (e.g. where they spent their holidays the previous year), then they are asked to compare these with a hypothetical product, which is a modified version of their previous choice. Compared to the traditional
(conjoint) analysis of stated preferences, this questioning method makes the deci-sion more realistic for the respondent, as it is tied to a real experience, which may theoretically help to increase the reliability of responses. As an added benefit, the method allows researchers to offer more relevant choices. The method’s drawback is that the proposed options are not independent of previous decisions, which in turn may depend on factors that are not being observed. This causes problems when it comes to estimating regression models; however, these econometrical issues can be managed by using mixed logit models (Train–Wilson [2008]).
The questionnaire
The objective when measuring substitution is to examine how changes in the pric-ing of fixed and mobile phone calls affect demand for the two services. Numerous other factors may also have an impact on demand and substitution. First, we present the method used for examining the effects of pricing, then we briefly discuss other factors. We start the examination of pricing effects by taking a closer look at con-sumers’ decisions on subscription (access substitution), then we move on to issues associated with telephone usage (usage substitution).
Access substitution • By purchasing a telephone subscription, consumers purchase the option to make calls at the per-minute rate of the tariff plan in question, and they purchase accessibility (other people can call them). Accordingly, the choice between a fixed and a mobile phone is determined by the fixed monthly fee and the price of calls. Decisions also depend on what subscriptions (fixed, mobile or neither) the consumer already has. This information was used when generating alternatives to choose from. People with only one type of subscription were asked about the effects of two price changes (for those who have only a fixed phone and those who have only a mo-bile phone, the questionnaire is perfectly symmetrical). 1. First the effects of raising the price of the consumer’s existing subscription were tested (fixed phone becoming more expensive). In this case, there are two possible reactions: simply purchasing the other subscription without making any other changes, and purchasing the other subscription while canceling the present one (i.e. either getting a mobile subscription in addition to the fixed phone, or getting a mobile subscription to replace the fixed subscription). 2. The other scenario for those who only have one subscription is the reduction of the price of the other service (in our example, the mobile becoming cheaper), with the two possible reactions being purchasing the now cheaper other subscription in addition to the existing subscription or replacing it (either getting a mobile subscription in addition to the fixed phone, or getting a mobile subscrip-tion and canceling the fixed subscripsubscrip-tion).
For those respondents who have both types of subscription, obviously the only possible action with regard to access is the cancellation of services. Own price effects and cross-effects were included in the questionnaire in this case; that is, canceling mobile subscriptions in case of mobile price increases, and canceling fixed phones in case of mobile price decreases. Similarly, the cancellation of mobile subscriptions in case of the reduction of fixed tariffs was examined, as was the cancellation of the fixed phone in case of raised fixed tariffs.
The situation is simpler for households that have neither type of access. In their case, the possible reaction to mobile phone service price reductions is to get a mo-bile subscription, and the possible reaction to fixed phone service price reductions is to get a fixed subscription.
Thus, the alternatives offered include questions regarding own-price and cross-price elasticity, with regard both to cross-price increases and to cross-price reductions.
Questions designed to test the telecommunications budget hypothesis can also be asked, determining whether a reduction in the price of one service leads to an increase in the demand for the other as more money is left in the telecommuni-cations budget (and vice versa). Estimating the effects of the telecommunications budget was not one of the principal aims of the research, but two options related to this issue were included in the questionnaire. These covered households with both types of subscription, using the above-described options (canceling the fixed phone if mobile prices rise and vice versa).
Access decisions merit a more detailed examination. Various types of subscrip-tion are available to consumers, and a price increase will not necessarily motivate them to cancel their subscription right away; they might only change tariff plans – or stick with the plan they have and use the phone less or more. The questionnaire included questions about these possibilities.
When framing the questions, we had to consider how much consumers know about their options and the associated prices. If we assume that they have a rea-sonably clear idea of the situation, the phrasing of the question may be based on price changes, such as: “Would you buy a fixed phone subscription if the prices were lowered by 20%?” On the other hand, if we assume that consumers lack this knowledge, we need to present hypothetical plans, such as: “Would you buy a fixed phone subscription if the monthly fee was 3200 HUF, half of which was usable as call credit and you could call fixed numbers for 10 HUF and mobile numbers for 60 HUF at any time of day?”. The drawback of presenting hypothetical packages is that there is significant variation in multiple dimensions (call prices to various networks, monthly fee, crediting the monthly fee towards calls, free calls at certain times of day). Therefore, the following solution was chosen:
• Basing the questionnaire item on the current fee if the respondent has a subscrip-tion of the type in quesa subscrip-tion;
• Presenting a hypothetical call plan if the respondent does not have a subscription of the type in question.
The advantage of the first option is that no detailed information is needed on the type of plan the respondent has (which the respondent might not be able to pro-vide) in order to ask about the hypothetical plan they would find suitable. However, it presumes that the respondent has a reasonably good grasp of their call patterns and their total telephone bill, based on which they can decide what they would do in case of a price increase or a price decrease. Price changes were framed as an iden-tical change to all elements of the bill; therefore, the price change does not depend on the call patterns of the respondent.
The advantage of the second option is that it does not presume that the respondent knows the price of services they do not currently use. Furthermore, in order to simplify things, we presumed that substitution is probably continuous, and therefore we proposed low-price retail phone plans similar to those that exist on the market to people who did not have a subscription. However, this may cause price elasticity to be somewhat under-estimated. Presumably, there is a relatively small group of people who would buy a larg-er subscription right away when signing a fixed or mobile contract, or buy a small-val-ue plan but choose a plan that is different in some way from the one we proposed. Two questions were asked in order to examine the effects of insufficient informa-tion. First, respondents were asked about a plan costing the same as plans on the
mar-ket at the time, then they were asked about a plan with a different price. Theoretically, this allows us to separate effects caused by a lack of information on prices (which we will call the information effect from now on) from those caused by price changes. By de-fault, only the second, ‘cleaned’ effect was taken into account for calculating elasticities.
Usage substitution • Usage substitution may be defined as follows: presuming an existing subscription, how would changes to the cost of call minutes change con-sumption habits? This definition complements the previously discussed concept of
access substitution, which is about the decision to change one’s subscription. In this framework, usage substitution is only available to consumers who have both types of subscription. Access at the workplace (via fixed or mobile phone) plays a special role in this regard. On the one hand, the research covers the residential telephony market, and thus the examination focused on private telephone conversations, and only sub-jects with a private subscription were taken into account. Subscriptions belonging to the respondent’s own business were considered private in this regard (and with regard to access substitution as well), as they can be considered private from the economic standpoint. However, use of a telephone at the workplace often exists as an option for people, and therefore it was included among the options offered to respondents. When it comes to studying usage substitution, the fact that consumers are unsure about the volume of their usage constitutes an additional difficulty compared to studying access substitution. As the majority of consumers presumably do not know the various types of call traffic listed on their telephone bill (even if they receive such a list), it is difficult for them to tell what percentage of their calls they would transfer to the fixed network if the fixed call prices were reduced by 10 percent. In this situation, using the stated preference method involves drawing up hypothetical scenarios – as was done in a previous similar study by Tárki-NHH (Tárki [2004]). The primary drawback of this approach is that we do not know how often these hy-pothetical situations arise in the respondent’s life, as respondents can probably only supply very imprecise estimates in this regard. Therefore, we used a method that combines stated and revealed preference in such situations. We asked respondents to think back to the last five calls they made and we asked them how they would have handled them if call costs had been different.
Decision options: • no change,
• different call length,
• initiating the call from a different network, • initiating the call from a workplace phone, • making the call at a cheaper time of day, • forgoing the call,
Unfortunately, we can only study substitution from one angle: we can find out if the respondent would still have initiated a call they made even if the prices were higher, but we cannot find out if they would have called somebody they did not call if the prices were lower.
Information collected on various call characteristics was also useful for analy-sis. This information includes the following: call length, call type (family, friends or business), how urgent it was and where the respondent was when the call took place. In addition to price, numerous social and lifestyle factors affect fixed-mobile sub-stitution, and the impact of these factors may be greater than that of price. Our work also involved analyzing these factors. Although the primary purpose is to examine residential consumption, subscriptions at the workplace are an important factor, as work telephones are often used for private calls, which makes them function essen-tially as a substitute for residential consumption. Discounted tariff plans available to employees of a company – which are often cheaper than regular plans available to the public – can encourage people to use their corporate phone.8 In such cases,
we need to determine who actually pays the bill (the employee or the company) and whether there is a formal or informal limit to the use of the corporate phone. Software tools enabling voice calls or instant messaging over the Internet can offer another possible substitute for the private telephone. Additionally, mobile phone service providers offer options that can, to a certain extent, serve as an alternative to cheap fixed calls. One of these is a call plan option allowing the subscriber to call a limited set of numbers for free.
Complementary services may also affect demand. For fixed phone subscriptions, ADSL Internet subscriptions are one such complementary service; at the time of our research project, ADSL Internet was significantly cheaper for subscribers who also had a telephone subscription.
There is also the aspect of the economies of scale when we consider a fixed phone subscription: a larger household can use it more, lowering the per-call cost of the fixed monthly fee.
Examining elasticities
Substitution is generally measured in economic terms with the use of elasticity as a metric. The extent of substitution between two products is often measured by calculating the cross-price elasticity. Cross-price elasticity shows how much more is bought of one product when the other becomes more expensive, and how much less is bought of one when the other becomes cheaper.
In the hypothetical monopolistic test applied to market determinations for the purposes of competition law and telecommunications regulation, one product is considered to substitute another when both of the following conditions are met: 1. if the price of the product sold by the presumed monopoly is raised by a small but significant amount for a long period of time, its demand falls to such an extent that the price rise does not generate a profit, i.e. the own-price elasticity is high; 2. in the test carried out with the inclusion of an alternative product, which is
func-tionally at least somewhat substitutive, and which is chosen based on cross-price elasticities, a price rise would be profitable.
The demand data collected using the survey method allowed us to estimate the own price and cross-price elasticities of the demand for various services. For our purposes, cross-product effects were most important, so estimating these was the main priority.
When drawing up the questionnaire, the primary goal was to investigate the background of substitution as deeply as possible, which also had a significant effect on elasticity estimations in many regards. A 20% price change was used in the survey to examine the effects of price changes. This rather substantial change was used on the assumption that significant and genuine reactions can only be expect-ed from consumers if they are presentexpect-ed with a decision that really merits consid-eration.
When calculating elasticity based on such larger changes, the baseline chosen for examining reactions becomes an important factor. Therefore, we did not study one point on the demand curve (point-price elasticity) but a longer section (arc elasticity). The extent of change was calculated based on the arithmetic mean of the values before and after the change, i.e. a mean-based arc elasticity was calculated.
Sample
The questionnaire-based data collection was carried out by Szonda-Ipsos in Sep-tember 2008. The target population included people over the age of 18 living in Hungary, and respondents were chosen on the basis of a sampling method that takes into account locality sizes. Responses were collected in person within the framework of an “omnibus” survey, in which various unrelated surveys are carried out at the same time by the same interviewers. The sample consisted of 952 people. Differences between the sample and the target population were corrected by Szonda-Ipsos using four-dimensional weighting based on age, sex, residence (vil-lage, town, city etc.) and educational qualifications. All analyses were carried out on the weighted sample.
RESULTS Telephone penetration
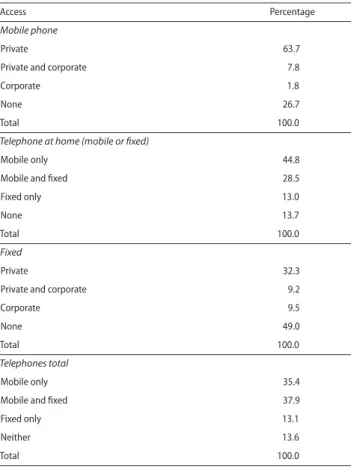
Our data indicates that 73.3% of the Hungarian population had at least one personal or corporate mobile phone subscription at the time of data collection, the share of fixed private subscriptions was 41.5% and a total of 51% of the population had access to some kind of fixed telephone network at home or at their workplace (see Table 1).
TABLE 1 • Distribution of access types and actual usage (N = 952)
Access Percentage
Mobile phone
Private 63.7
Private and corporate 7.8
Corporate 1.8
None 26.7
Total 100.0
Telephone at home (mobile or fixed)
Mobile only 44.8
Mobile and fixed 28.5
Fixed only 13.0
None 13.7
Total 100.0
Fixed
Private 32.3
Private and corporate 9.2
Corporate 9.5
None 49.0
Total 100.0
Telephones total
Mobile only 35.4
Mobile and fixed 37.9
Fixed only 13.1
Neither 13.6
Total 100.0
Taking into account all devices available at the consumer’s home, only 13.6% of the population lacked a home telephone subscription, and the proportion of those without a telephone connection at work was essentially the same. The only cause for any difference between the two is that a significant number of people who only use a mobile phone had access to a fixed phone at their workplace.
Main characteristics of telephone use
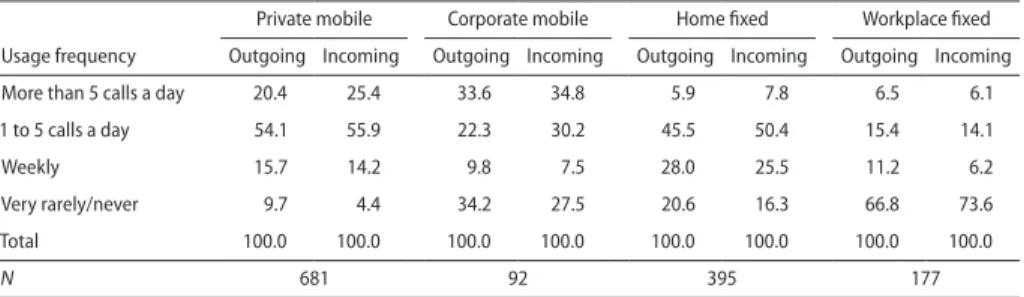
The data collected using the questionnaire provide a good overview of how frequently people use the services available to them through various channels for their personal calls (Table 2). With regard to telephone access at the workplace or through corpo-rate means, our analysis only examines private calls, as these are the calls regarding which consumers make independent decisions based on pricing and non-price fac-tors. Generally, using fixed phones at the workplace is the rarest usage scenario. Only 6.5% of respondents use a fixed phone at their workplace more than five times a day.
TABLE 2 • Main characteristics of private telephone usage (percentages)
Usage frequency
Private mobile Corporate mobile Home fixed Workplace fixed
Outgoing Incoming Outgoing Incoming Outgoing Incoming Outgoing Incoming
More than 5 calls a day 20.4 25.4 33.6 34.8 5.9 7.8 6.5 6.1
1 to 5 calls a day 54.1 55.9 22.3 30.2 45.5 50.4 15.4 14.1
Weekly 15.7 14.2 9.8 7.5 28.0 25.5 11.2 6.2
Very rarely/never 9.7 4.4 34.2 27.5 20.6 16.3 66.8 73.6
Total 100.0 100.0 100.0 100.0 100.0 100.0 100.0 100.0
N 681 92 395 177
A significant number, about one third of those with a corporate mobile phone, use their phone for making private calls; at the same time, a similar number of people use their corporate phone for private calls only very rarely or never. The frequency of usage is by far the highest for private mobile phones. Private mobile phones are the most frequently used means of communication both for outgoing and incoming calls. Irrespective of whether a phone is private or corporate, consumers use mobile phones much more often than fixed phones.
Nevertheless, the ratio of very rare usage is surprisingly high for both private mobile and private fixed phones. 20% of people with a home fixed phone use it very rarely or not at all (either for outgoing, or for incoming calls). The lack of outgoing calls is explained by the fact that many consumers declared that they only have a fixed phone for receiving calls. However, the rarity of incoming calls still requires further explanation. One possible reason is that the fixed phone was only kept be-cause it was bundled with an Internet subscription, or for security (many people feel that a fixed phone is worth having because of its reliability in emergency situations), or perhaps consumers simply did not get around to canceling it.
In the case of mobile subscriptions, the cause of the relatively large number of responses indicating rare or inexistent use (outgoing: 9.7 percent, incoming: 4.4 percent among those possessing a subscription) is likely to be security and aversion. The monthly bill of most private consumers was between HUF 2000 and HUF 4000 for both types of telephone subscription; on average, mobile phone costs are
not significantly higher than fixed telephone costs. It should be noted that these are not individual but household data, as home fixed phones are generally used by all members of the household (Table 3).
In the overwhelming majority of cases, the use of corporate fixed phones does not involve costs (and takes place at the workplace); even if there is a cost to the user, it is low (less than HUF 2000 per month). Corporate mobile phones are much more costly; 54.1% of users contribute to the costs, and 15% pay more than HUF 10,000 per month.
The goal of the questions regarding work-related issues was to identify the ex-tent to which work-related situations occur that make it difficult or impossible to replace mobile connections with fixed connections (Table 4).
22.4% indicated working at home as a typical situation, 20% travel a lot and anoth-er 20% work at frequently changing locations; the lattanoth-er two situations naturally make it impossible to rely on fixed phones. The most frequently indicated cause – marked by 47.8% of respondents – was that accessibility is important for work purposes.
TABLE 3 • Costs of private telephone use paid for by the user, listed by access type(percent)
Monthly expenditure (HUF)*
Mobile Fixed
Private Corporate Private Corporate
0 1.7 45.9 1.0 79.2 1–1,999 17.3 15.6 9.0 18.7 2,000–3,999 38.3 3.2 45.2 1.8 4,000–5,999 19.5 12.4 30.3 0.3 6,000–7,999 11.6 8.8 10.3 0.0 8,000–9,999 3.4 2.3 2.4 0.0 10,000–15,000 7.3 7.9 1.3 0.0 15,000–20,000 0.0 0.9 0.0 0.0 20,000+ 1.1 3.1 0.4 0.0 Total 100.0 100.0 100.0 100.0 Average (HUF) 4104 2053 3530 111 N 693 95 406 191
* At the time of data collection cca. 275 HUF = 1 EUR
TABLE 4 • Work characteristics (percent, N = 481)
Statement Yes No Total
Works at home often 22.43 77.57 100.00
It is important that colleagues or clients can reach them by phone at any time,
and that they can reach colleagues or clients at any time. 47.82 52.18 100.00
Travels a lot for work 21.11 78.89 100.00
Consumer attitudes and habits
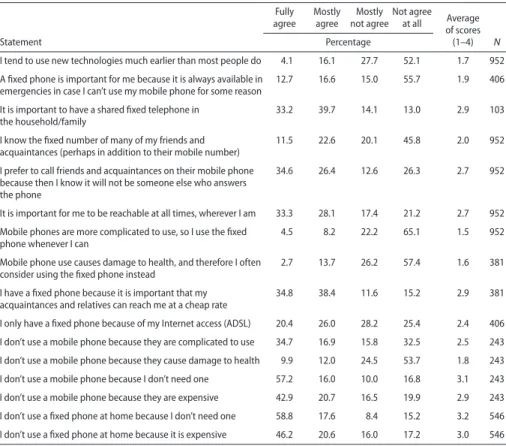
In the section on attitudes, respondents were given statements related to the choice between fixed and mobile phones and asked to indicate to what extent they identify with the statements. Scores ranged from 1 to 4 (4 = fully agree). The penultimate column of Table 5 shows the average of the scores.
According to the responses to the question on new technologies, only 4 percent of people are early adopters, while 51.3 percent do not see this as characteristic of them, with the average score being 1.7. However, most of the data indicate that this question has limited relevance to mobile phones, which cannot really be considered a new technology any longer.
Numerous questions were addressed to respondents who do not use a mobile phone. In many cases, the complicated nature of such phones caused a problem: for more than half of the respondents, difficulty of use was the reason for not using a mobile phone. The fear of adverse health effects – which have not been
scientif-TABLE 5 • Attitudes and habits related to technology
Statement
Fully
agree Mostly agree not agreeMostly Not agree at all Average of scores
(1–4) N
Percentage
I tend to use new technologies much earlier than most people do 4.1 16.1 27.7 52.1 1.7 952 A fixed phone is important for me because it is always available in
emergencies in case I can’t use my mobile phone for some reason 12.7 16.6 15.0 55.7 1.9 406 It is important to have a shared fixed telephone in
the household/family 33.2 39.7 14.1 13.0 2.9 103
I know the fixed number of many of my friends and
acquaintances (perhaps in addition to their mobile number) 11.5 22.6 20.1 45.8 2.0 952
I prefer to call friends and acquaintances on their mobile phone because then I know it will not be someone else who answers the phone
34.6 26.4 12.6 26.3 2.7 952
It is important for me to be reachable at all times, wherever I am 33.3 28.1 17.4 21.2 2.7 952 Mobile phones are more complicated to use, so I use the fixed
phone whenever I can 4.5 8.2 22.2 65.1 1.5 952
Mobile phone use causes damage to health, and therefore I often
consider using the fixed phone instead 2.7 13.7 26.2 57.4 1.6 381
I have a fixed phone because it is important that my
acquaintances and relatives can reach me at a cheap rate 34.8 38.4 11.6 15.2 2.9 381
I only have a fixed phone because of my Internet access (ADSL) 20.4 26.0 28.2 25.4 2.4 406 I don’t use a mobile phone because they are complicated to use 34.7 16.9 15.8 32.5 2.5 243 I don’t use a mobile phone because they cause damage to health 9.9 12.0 24.5 53.7 1.8 243
I don’t use a mobile phone because I don’t need one 57.2 16.0 10.0 16.8 3.1 243
I don’t use a mobile phone because they are expensive 42.9 20.7 16.5 19.9 2.9 243
I don’t use a fixed phone at home because I don’t need one 58.8 17.6 8.4 15.2 3.2 546
ically proven but are regularly discussed – received a score of 1.8. 55.1 percent of non-users firmly state that they do not need a mobile phone, and close to 40 per-cent clearly deem mobile phones too expensive. 43.3 perper-cent of respondents who do not use a fixed phone say the same thing about the price of fixed subscriptions, and more than 50 percent state that they do not need one.
Interestingly, the statement about maintaining a fixed phone subscription for ADSL alone received an average score of 2.4 (strong agreement: 20.2%). The reason for maintaining a fixed connection may be that it allows friends and relatives to call the consumer cheaply (2.9 points), providing a common telephone number for the household/family (2.9 points), reliable access in case of emergency (1.9 points) and the fact that the respondent considers mobile phones complicated to use (1.5 points). Generally, only one-third of respondents know the fixed phone number of their friends (average: 2.0 points) and only 15.5 percent prefer to initiate calls from their fixed phone due to concerns about health risks.
For a rather high number of respondents (cca. 60%), two-way “immediate” ac-cessibility (anyone can reach them and they can reach anyone) is important, which indicates the clear superiority of mobile phones. These are presumably the respond-ents who have a mobile phone in order to ensure accessibility (mobility).
Thus, those who use mobile phones mostly call mobile numbers and the primary consideration for them is to be accessible by phone at any time, anywhere (whatever the cost). Those who prefer fixed phones do so because of cheap rates and security.
Consumption characteristics affecting substitution
Whether a consumer replaces their fixed phone with a mobile phone depends – in addition to the price – on their habits and characteristics. This chapter examines the effects of three possible factors, first one by one, then as part of a unified model. These factors are: substitution options, household size and Internet subscription.
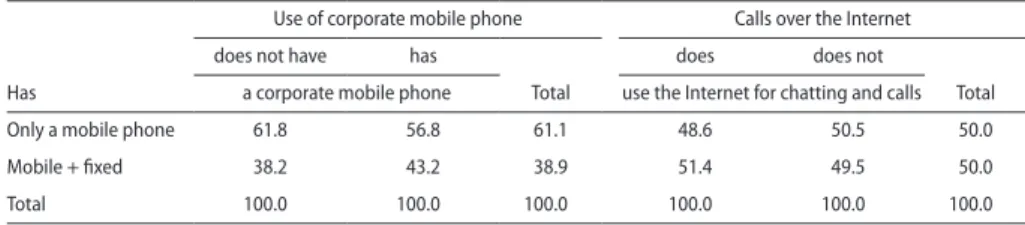
Fixed-mobile substitution can also be studied by examining whether a household is equipped with a fixed phone, or the respondent only uses a mobile phone at home. As previously shown, these are the two most typical arrangements. Accordingly, we compare these two groups, trying to identify the differences between mobile users who do not use a fixed phone and those who do. Among possible substitutes for a fixed phone, we consider Internet telephony and use of a corporate mobile phone (Table 6). The data show that respondents with a corporate mobile phone are more likely to have a fixed phone as well, which indicates that for them, substitution is less likely. In all probability, canceling the fixed phone is not important, as the two services do not significantly compete for a share of the family budget.
The role of Internet telephony was only studied among people with Internet access in order to eliminate any effect arising from the availability or absence of
an Internet connection. That examination showed no difference: no significant substitution between calls over the Internet and calls over fixed phones was de-tected. The observation of any such effect is made more difficult by the behavior of service providers, who often offer discounted fixed phone services along with Internet subscriptions.
Next, the effects of Internet access were analyzed. In principle, as ADSL In-ternet subscriptions are cheaper for users who have a fixed phone, interest in an Internet connection in itself should increase the likelihood that the consumer will purchase a fixed phone connection. Similarly, Internet service providers often offer discounted telephone services for their Internet subscribers (Table 7). The figures show that the proportion of respondents with a fixed phone is significantly higher among those who have an Internet connection. This indicates that the two services are complementary.
Finally, the impact of household size was studied. As all members of the hold may use a fixed phone subscription, but the monthly fee is fixed, larger house-holds in principle have lower per capita costs. To examine this issue, single-person households and multi-person households were compared. The results show that people who live alone are less likely to have a fixed phone subscription if they already have a mobile phone subscription (Table 8).
TABLE 6 • The effects of substitute services on fixed phone subscriptions (percentages)
Has
Use of corporate mobile phone Calls over the Internet
does not have has
Total
does does not
Total a corporate mobile phone use the Internet for chatting and calls
Only a mobile phone 61.8 56.8 61.1 48.6 50.5 50.0
Mobile + fixed 38.2 43.2 38.9 51.4 49.5 50.0
Total 100.0 100.0 100.0 100.0 100.0 100.0
TABLE 7 • The effects of having an Internet connection on fixed phone subscriptions
(percentages)
Has Does not have an Internet connection Has an Internet connection Total
Only a mobile phone 72.1 50.0 61.1
Mobile + fixed 27.9 50.0 38.9
Total 100.0 100.0 100.0
TABLE 8 • The effects of household size on fixed phone subscriptions (percentages)
Has Single-person household Household with multiple people Total
Mobile only 70.5 59.8 61.1
Mobile + fixed 29.5 40.2 38.9
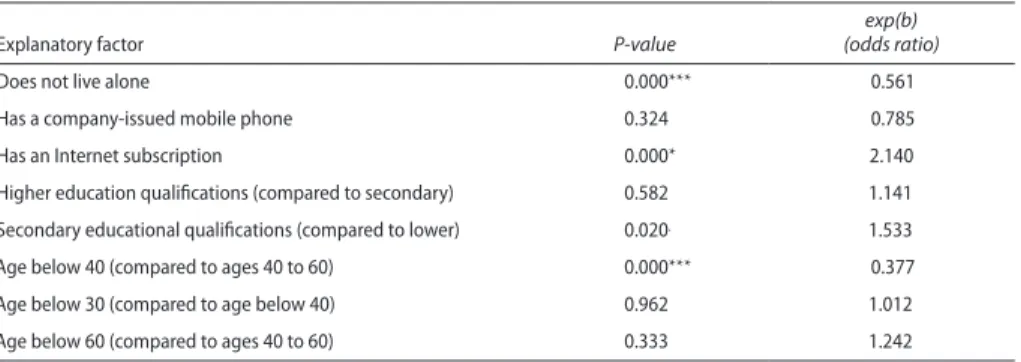
Next, the combined effects of these three factors on respondent’s decisions about whether or not to buy a fixed phone subscription will be examined (Table 9). Age can affect both household size and Internet subscription status, so it was included in the analysis as well. Additionally, having an Internet connection correlates with educational qualifications, so educational qualifications were also included as a con-trol variable. Due to the nature of the issue, a logistic regression model was used.
TABLE 9 • The combined effects of factors on fixed telephone subscription
Explanatory factor P-value (odds ratio)exp(b)
Does not live alone 0.000*** 0.561
Has a company-issued mobile phone 0.324 0.785
Has an Internet subscription 0.000* 2.140
Higher education qualifications (compared to secondary) 0.582 1.141
Secondary educational qualifications (compared to lower) 0.020. 1.533
Age below 40 (compared to ages 40 to 60) 0.000*** 0.377
Age below 30 (compared to age below 40) 0.962 1.012
Age below 60 (compared to ages 40 to 60) 0.333 1.242
* Significant at the 10 percent level, ** significant at the 5 percent level, *** significant at the 1 percent level.
When the three factors are examined together, and the effects of age and educational qualifications are controlled for, two factors remain significant: Internet access and the size of the household. The marginal effect of these factors is rather significant. Having an Internet connection in itself more than doubles the chance of a respondent having a fixed phone line. Interestingly, people who live alone are more likely to have a fixed phone in addition to their mobile phone than people with a family. These effects are independent of age. An analysis of age distributions indicates that 40 years is a clear demarcation line with respect to fixed phone subscription. People above 40 are almost three times as likely to have a fixed phone as those under 40. There are no other major dividing lines, though: there is little difference between people above 60 and those be-tween 40 and 60, or bebe-tween those under 30 and those bebe-tween 30 and 40. Addition-ally, people with secondary or higher level educational qualifications are 50 percent more likely to have a fixed phone than those with lower educational qualifications. Among the examined hypotheses, the one that was confirmed was that having an Internet subscription increases the likelihood of also having a fixed phone subscription, and to a rather significant extent. The use of alternative technologies (Internet calls, corporate mobile phone) does not significantly reduce the likelihood of having a fixed phone subscription. The hypothesis about household size was not confirmed: among respondents with the same age and educational qualifications: single respondents were more likely to have a fixed phone in addition to their mobile phone. We also identified a cultural demarcation line at the age of 40, and found a smaller difference between re-spondents who had obtained a secondary school leaving certificate and those who had not.
Access substitution
Access substitution was examined by studying the responses of four consumer groups to different offers and price changes. The four groups of respondents were the following:
• has own mobile phone, but not fixed; • has own fixed phone, but not mobile; • has both own fixed and own mobile phone; • has neither of the two.
The different groups were presented with different offers. The main types are the following:
• offer regarding a service type not currently used by the respondent at the current market price;
• offer regarding a service type not currently used by the respondent at 20% below the current market price;
• raising the price of a service currently used by the respondent by 20%.
We also asked respondents about other issues based on their responses whenever applicable. For instance, if a respondent said that they would buy a service they were not yet using, the next question covered effects on their preexisting other subscrip-tion, with the following options:
• cancellation; • reduced usage;
• reduced usage and switching to a different tariff plan; • continued usage without change.
Similarly, if the questions proposed a change in the price of the existing subscription (price increase), we asked respondents for their reactions regarding both technolo-gies in order to map crosswise influences as well.
Responses are presented in figures showing the entire decision tree. The figures indicate the number of people who provided a response to each question. In case of very low numbers, where showing the distribution would have been pointless, it was omitted. There were always three offers: one at the market price, one 20% lower and one 20% higher than the market price. Market prices were determined based on September 2008 pricing. Entry-level mobile or fixed call plan prices were chosen as the market price, assuming that if a respondent has no existing plan, they would most probably be interested in smaller plans. For fixed phones, this meant a hypothetical plan that largely matches the “Felező” plan offered by Magyar Tele-com, and for mobile phones, the plan was the cheapest prepaid plan where pricing is not dependent on the time of day and the network called.
In addition to the responses on substitution, the results of estimates on the elas-ticity of telecommunications demand also allow us to draw conclusions regarding the relationship between fixed and mobile technologies.
When processing this part of the questionnaire, we did not follow the established procedure for analyzing opinion surveys: we included “do not know” responses among the percentage of valid responses. As this response is closer to “no” when the question is whether the respondent would buy a proposed service, these respondents were included in the “no” category. This was done in order to counteract the ten-dency of respondents to overestimate their willingness to make changes compared to their subsequent real behavior.
Figure 1 shows the results of the four offers proposed to those who have neither a mobile phone nor a fixed phone of their own. Only 0.9 percent would take the market-price fixed phone offer, while the rate is 10.7 percent for the market-price mobile phone offer. Of the remaining respondents, 0 percent would subscribe for a fixed phone line at the reduced price, and 2.6 percent would do so for a mobile phone connection. These data lead to two conclusions. First, demand for fixed phone connections is completely inelastic in this consumer group. Although the proportion is very low for mobile phones as well, there is a highly significant difference between the two. Second, compared to the effect of the price change, a comparatively large number of respondents said that they would subscribe at the market price. This is presumably (partly) due to the fact that people do not keep up with market prices.
Source: Infrapont.
FIGURE 1 • Responses of people with no mobile or fixed phone of their own
People with no mobile or fixed phone of their own (N = 125)
Fixed phone offer at market price Reject: 100% Accept: 0.9% Accept: 0.0% Accept: 10.7% Accept: 2.6% Reject: 99.1%
Fixed phone offer with 20% discount
(N = 124)
Mobile phone offer at market price
Reject: 97.4% Reject: 89.3%
Mobile phone offer with 20% discount
The next group under examination is that of people with a mobile phone con-nection of their own and no fixed phone line of their own (Figure 2). For them, the new offer was for a fixed phone line at the market price, which 1.7 percent of re-spondents would accept.
3.2 percent of the remaining respondents would subscribe for the fixed offers at a 20% price reduction. The crosswise effect is similar, i.e. if mobile telephony be-came significantly more expensive, 3.8 percent would purchase a fixed connection. The relatively low values indicate that the overwhelming majority of those with only a mobile phone would not wish to have a fixed phone even if the price was significantly lower.
Further responses by people who gave a positive response regarding the sub-scription were omitted from the figure due to the very low sample size.
The third group under examination is that of people who do not have a mobile phone connection of their own but do have a fixed phone line of their own (Figure 3). For this group, the structure of the questions was the same as for the previous group. The proportion of respondents who would accept market price mobile phone sub-scriptions is clearly higher than the number of those who would accept a fixed phone
FIGURE 2 • Responses of people
with a mobile phone of their own and no fixed phone of their own
People with a mobile phone of their own and no fixed phone of their own (N = 421)
Fixed phone offer at market price Fixed phone offer with 20% discount Accommodate to increasing prices Canceling
the contract changeNo Accept: 1.7% Accept:3.2% Reject: 98.3% Impact on the mobile subscription (N = 6) Impact on the mobile subscription (N = 17) 20% increase in mobile phone price 20% decrease in fixed phone price Accept: 3.8% Impact on the mobile subscription (N = 15) Accommodate to increasing prices Canceling
the contract changeNo
Accommodate to increasing prices Canceling
the contract changeNo
subscription in the previous group. Still, the sample size for the second response (“What would you do if you subscribed…”) was still too low, as the size of the whole group is significantly lower than in the case of Figure 2. The reaction to the market price mobile subscription was 5.5% (information effect), and 3.6% of the remaining respondents stated that they would take the 20% cheaper offer. If fixed prices in-creased by 20%, 4.3% would buy a mobile phone subscription.
Overall, the results were similar to those of the second group: mobile phone price reductions did not lead to large amounts of substitution; at the same time, the willingness to make the change was almost twice as high as among those with a mobile phone only. This indicates that mobile phones are more of a substitute for fixed phones than the other way around.
With regard to substitution, the most interesting group is perhaps the one where both connection types are present(Figure 4 and Figure 5). Here, crosswise relation-ships are more clearly observable, and the difference between the reactions to fixed and mobile price changes is easier to see as well. Additionally, the effect of price changes on the shift of usage between the two networks (usage substitution) can also be studied in this group. In Figure 4 and Figure 5, consumers’ reactions to price changes in the two services in the same direction (up or down) are summarized.
FIGURE 3 • Responses of respondents
with a home fixed phone and no mobile phone of their own
People with a home fixed phone and no mobile phone of their own (N = 129)
Mobile phone offer at market price Mobile phone offer with 20% discount Canceling
the contract changeNo Előfizet
5,5% Előfizet3,6%
Reject: 94.5%
Impact on the fixed phone subscription (N = 11) 20% increase in fixed phone price Előfizet 4,3%
Impact on the fixed phone subscription
(N = 6)
Canceling
the contract changeNo the contractCanceling changeNo Impact on the fixed
phone subscription (N = 7) 20% decrease in fixed phone price Accommodate to
increasing prices Accommodate toincreasing prices Accommodate toincreasing prices
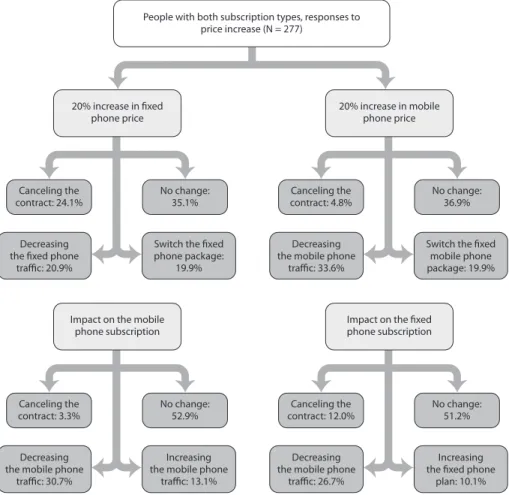
FIGURE 4 • Responses of respondents with both subscription types to raising prices
People with both subscription types, responses to price increase (N = 277)
Decreasing the fixed phone
traffic: 20.9%
Switch the fixed phone package: 19.9% Canceling the contract: 24.1% No change:35.1% 20% increase in fixed phone price Decreasing the mobile phone
traffic: 33.6%
Switch the fixed mobile phone package: 19.9% Canceling the contract: 4.8% No change:36.9% 20% increase in mobile phone price Decreasing the mobile phone
traffic: 30.7%
Increasing the mobile phone
traffic: 13.1% Canceling the
contract: 3.3% No change:52.9% Impact on the mobile
phone subscription
Decreasing the mobile phone
traffic: 26.7%
Increasing the fixed phone
plan: 10.1% Canceling the
contract: 12.0% No change:51.2% Impact on the fixed phone subscription
Source: Infrapont.
Although price rises are contrary to the dominant pricing trends, this hypotheti-cal scenario tells us a great deal about how consumers value their two types of access: which of the two they consider more important. A significant group of consumers (about 35 percent) would not change their consumption if either service became 20 percent more expensive. However, while respondents tended to reduce their usage in response to rising mobile service prices, with only 4.8% canceling their contract, the same price increase would cause 24.1% to cancel their fixed phone contract. Thus, as opposed to the elastic reaction seen with fixed price rises, mobile access appears much more indispensable to consumers, making it less price sensitive.
The differences observed in cross-price influences are also worth noting. If fixed subscriptions became more expensive, only 3.3% would cancel their mobile
People with both subscription types, responses to price reductions (N = 277)
Increasing the fixed phone
traffic: 16.3%
Switch the fixed phone package: 11.9% No change: 71.8% 20% decrease in fixed phone price Decreasing the mobile phone
traffic: 30.4%
Increasing the mobile phone
traffic: 5.4% Canceling the
contract: 0.8% No change:63.4% Impact on the mobile
phone subscription
Decreasing the mobile phone
traffic: 20.8%
Increasing the fixed phone
plan: 4.9% Canceling the
contract: 5.9% No change:68.4% Impact on the fixed
phone subscription Increasing
the mobile phone traffic: 15.8%
Switch the mobile phone package: 9.8% No change: 74.4% 20% decrease in mobile phone price
subscription. On the other hand, however, 12% of consumers would cancel their fixed line if mobile access became more expensive, which, in accordance with the presented results, indicates a rather significant difference between consumers’ as-sessment of the two access types.
The examination of price increases also shows a non-negligible amount of usage substitution between the two services. If fixed prices were to rise by 20 percent, 13 percent of respondents would increase their mobile usage, while if mobile prices rose by 20 percent, 10 percent of respondents would use their fixed phone more. In other words, if a service becomes more expensive, a significant subset of consumers will reduce their usage (perhaps even cancel their subscription) and substitute it by using the other type of service more.
FIGURE 5 • The responses to price reductions
of users with both access types
Among users who have both types of access, the number of consumers who, if faced with one service raising prices, would reduce their demand for the other service, the price of which is unchanged (by canceling the service or reducing their usage) is exceptionally high. This supports the previously discussed hypothesis of the telecommunications budget.
Only 0.8 percent of respondents would cancel their mobile subscription as a result of a reduction of fixed prices. On the other hand, 5.9 percent would cancel their fixed subscription as a result of a reduction of mobile prices. This indicates that there is a group of consumers who use a fixed phone as a secondary telephone in order to take advantage of cheaper rates, and members of this group would cancel their fixed service if mobile prices fell far enough. In the opposite direction, any such effect is negligible. Canceling a service due to the reduction of the price of the other service is not widespread for either type of service, but adaptation by reducing usage is signifi-cant in both cases (30.4% and 20.8%). This clearly indicates usage substitution, i.e. if a consumer has both types of subscription and reduces their use of one service with an unchanged price when the price of the other service falls, the explanation is that the consumer is using the now cheaper service instead.
The difference between the strength of the phenomenon in the two directions is worthy of note. When mobile prices fall, consumers re-route their traffic from fixed to mobile less than in the opposite direction when fixed prices fall. The reason for this is that the demand for fixed telephone services is more elastic (more affected by price changes) than the demand for mobile services.
The telecommunications budget hypothesis
We need to examine to what extent the data support the telecommunications budget hypothesis. According to this hypothesis, changes to the price of one service should cause a similar response affecting both services. That is, if either fixed or mobile access becomes more expensive, we would expect both fixed and mobile demand to fall, and we would expect demand for both services to increase in response to price reductions. Data on this are presented in Table 10.
TABLE 10 • Data on the telecommunications budget hypothesis (percentages)
Fixed Mobile
Response (reduction of use + cancellation)
Price increase Fixed – 30.7 + 3.3
Mobile 26.7 + 12 –
Response (increase)
Price reduction Fixed – 5.4
Table 10 shows that the proportion of people whose responses match the tele-communications budget hypothesis is higher – about 35% in both directions – in case of price increases. In case of price reductions, the effect is much smaller, but there is still a non-negligible proportion of 5% (i.e. when one service type becomes cheaper, about 5% of consumers increase their use of the other service).
This basically confirms that the effect outlined in the telecommunications budget hypothesis does exist, but it is present alongside other effects and is definitely not the only factor affecting behavior. In other words: the money lost or gained due to price changes is partly but not exclusively compensated (redirected) within the envelope of telecommunications expenses.
Usage substitution
Regarding the study of usage substitution, we previously discussed how many peo-ple stated that they would use a given service less or more as a result of changes in fixed or mobile pricing. In the next section, we examine the same issue using a different method. We asked respondents about the last five calls they initiated, inquiring about what they would have done if prices had been different. We also asked respondents about various characteristics of the calls (Table 11).
The results indicate that people use their own mobile phones most of the time (72.07%), with home fixed phones accounting for 23.47%, which means that when it comes to private calls, mobile phones are used more than three times as frequently as fixed phones. Telephones at work are used very rarely (4.5% in total).
Table 12 indicates that users generally call mobile phones from mobile phones and they call fixed phones from fixed phones: only 10.2% of calls crossed from one network type to the other.
Examining the phenomenon in greater detail, Table 13 indicates that this char-acteristic is more powerful in the case of calls from mobile phones and to mobile phones (93.8 percent and 92.4 percent compared to 77.9 percent and 81.4 percent, respectively).
The data on the location of the calling party show that 91.4% of people use a fixed network call, unsurprisingly, from their homes. However, at close to 50%, the proportion of people calling from home is high even for mobile phone users
(Table 14). Two-thirds of calls initiated from a fixed phone reach the called party at their home, 22% at their workplace or school; these proportions are lower for mobile phones as well.
With regard to the called parties, no significant differences were found between the two technologies: respondents called family members the most, 55.0% of the time, followed by friends and acquaintances (28.4%). The remaining calls were dis-tributed fairly evenly between official and work-related calls (Table 15).