SUPPLY CHAIN MODELING AND SIMULATION USING
AGENTS
SHA MENG
(B.Eng. (Hons.), NUS)
A THESIS SUBMITTED
FOR THE DEGREE DOCTOR OF PHILOSOPHY
DEPARTMENT OF CHEMICAL AND BIOMOLECULAR
ENGINEERING
NATIONAL UNIVERSITY OF SINGAPORE
2014
i
Acknowledgements
First and foremost, I would like to express my deepest gratitude towards my research supervisors Prof. Rajagopalan Srinivasan and Prof. I. A. Karimi for their continued invaluable guidance, advice and support throughout my research work. Prof. Rajagopalan Srinivasan is not only a scientist with great vision but also importantly a resourceful thinker, whose ideas simulate developments in many areas throughout the course of this research work. Without him, my research would not be successful. His trust, scientific excitement, wealth of knowledge and accurate foresight have greatly impressed and enlightened me. I am indebted to him for his care and advice not only in my academic research but also in my daily life.
I sincerely thank Prof. I. A. Karimi and Prof. Tan Kay Chen, whom constituted and chaired my research panel. Their frank and open suggestions remedy my shortsightedness in the research work.
I would like to thank all my lab mates, Mr. Arief Adhitya, Mr. Satish Natarajan, Dr. Kaushik Ghosh and Ms. Lau Mai Chan for their advices and helps to open my mind in the research. I also would like to place my thanks to the friends at Institute of Chemical & Engineering Sciences (ICES).
I am also grateful to my friends in NUS, and some academic staffs for their kind help in my daily life. In addition, I would like to give due acknowledgement to National University of Singapore(NUS), for granting me research scholarship and funds needed for the pursuit of my Ph.D. degree. It has been a wonderful experience for me to study and live in NUS. I sincerely thank NUS for this opportunity.
ii
Finally, this thesis would not have been possible without the loving support from my family. I would like to express my deep gratitude and love for my father, mother and my wife.
iii
Table of Contents
Acknowledgements ... i
Table of Contents ... iii
Summary ... vii List of Tables ... ix List of Figures ... xi Chapter 1 Introduction...1 1.1 Background ...1 1.2 Research Objectives ...2
1.3 Outline of the Thesis ...3
Chapter 2 Literature Review ...5
2.1 Supply Chain Management ...5
2.2 Supply Chain Modeling Approach ...8
2.3 Agent Based Modeling ...11
2.4 Survey of Agent-Based Models of Supply Chain ...14
2.4.1 Agent-Based Supply Chain Models of Chemical Supply Chains ...20
Chapter 3 BPMN Based Specification of Agent-Based Models ...22
iv
3.2 BPMN Elements ...23
3.3 Execution of BPMN Models ...30
3.4 BPMN Application ...32
3.5 Guidelines for Modeling Complex Supply Chain Systems ...34
3.6 Chapter Summary ...36
Chapter 4 A BPMN-Based Model of Integrated Supply Chain ...37
4.1 System Description ...37
4.2 BPMN-Based Model for Multisite Specialty Chemical Supply Chain ...41
4.3 Case Studies ...51
4.3.1 Validation ...54
4.3.2 Scenario 1 ...56
4.3.3 Scenario 2 ...57
4.3.4 Scenario 3 ...57
4.4 Conclusions and Discussion ...58
Chapter 5 Optimizing Tank Fleet in Chemical Supply Chains Using Agent Based Simulation ...61
5.1 Introduction ...61
5.2 Literature Review ...63
5.3 A Multisite Chemical Supply Chain ...67
5.4 Dynamic Simulation Model of the Chemical Supply Chain ...72
5.4.1 Market Agent ...73
5.4.2 Customer Agents ...74
5.4.3 Order Coordinator Agent ...77
5.4.4 Warehouse Agents ...78
v
5.4.6 Plant Agents...81
5.4.7 Logistics Agent ...84
5.5 Illustrative Simulation Results of the Chemical Supply Chain Model ...84
5.6 Tank Fleet Routing and Sizing Problem ...94
5.6.1 New Tank Routing Policies ...94
5.6.2 Market Demand Sensitivity Analysis ...102
5.6.3 Inventory Control Policy ...108
5.7 Conclusions and Future Work ...111
5.8 Nomenclature ...112
Chapter 6 Study in the Ease of Extensions ...116
6.1 Transportation Disturbance ...116
6.1.1 Impact of Transportation Disturbance ...117
6.1.2 Safety Stock ...127
6.1.3 Paranoid Production ...137
6.1.4 Concluding Remarks for Transportation Disturbance Study ...150
6.2 Multi-Product Chemical Supply Chains ...152
6.2.1 Case Study ...152
6.3 Chapter Summary ...159
Chapter 7 Conclusions and Future Work ...161
7.1 Conclusions ...161
7.2 Future Work ...163
7.2.1 Analysis of Agent-Based Supply Chain Models through Equation Free Approach ...163
7.2.2 Supply Chain Disturbance and Disruption Management ...164
vi
7.2.4 Realistic Model Extension ...165
Bibliography ...167
vii
Summary
Good supply chain management is crucial for business success in today’s increasingly complex, global, and competitive business environment. Agent-based modeling and simulation (ABMS) is a natural fit to supply chains as it uses a bottom-up approach by modeling each supply chain entity as an agent which can interact with one another and response to changes based on its own interest. ABMS has been implemented to investigate, analyze, and diagnose supply chains. However, most of existing ABMS approaches are complex, and resulting models are hard coded and difficult for non-technical users to understand, manipulate and analyze.
This thesis proposes a business process modeling notation (BPMN) based framework for modeling and simulation of integrated supply chains. BPMN is a widely recognized unified graphical modeling notation for business processes. A key advantage of BPMN is its ability to transform documentation of process flows to executable process model with simple notation. The proposed framework combines the advantages of ABMS and BPMN and it is validated by replicating an existing multisite specialty chemicals supply chain model built in MATLAB SIMULINK. The built BPMN-based model has a more natural representation of the chemical supply chain and faster simulation. Various scenarios also demonstrate that a BPMN-based supply chain model is easier to understand, manipulate, and has high level of scalability and flexibility.
The strict safety and environmental regulation on chemical storage and transportation, expensive purchasing, leasing and maintenance charge of tank fleet, and the serious consequences from tank cars shortage make tank fleet sizing become an essential part of chemical supply chain management. This thesis builds an agent-based simulation model of a multisite chemical supply chain through BPMN-based framework
viii
to address the tank fleet sizing problem. The simulation model explicitly takes into account of the independence of supply chain entities and their interactions across various supply chain operations such as replenishment planning and order assignment. Tank fleet is modeled as a set of objects that travel across the supply chain. The supply chain model is simulated with five tank fleet routing policies under different fleet sizes and various conditions. Optimal tank fleet routing policy and size are determined based on the comparison of the simulation results. This thesis also explores the impact of transportation disturbance on supply chain performance by introducing transportation delays into model, and studies the tank fleet switching problem involving multiple chemical products.
In conclusion, BPMN-based supply chain modeling and simulation framework make it easier to design, model, simulate and manipulate agent-based model of supply chains and it has high level of scalability and flexibility. BPMN-based model serves as a qualitative and quantitative tool to support decision making in chemical supply chains including handling chemical supply chain disturbances and policy evaluation.
ix
List of Tables
Table 4.1: Nominal values for entities’ model parameters (adopted from Adhitya et al.,
2010) ...51
Table 4.2: Nominal values for plant’s model parameters (adopted from Adhitya et al., 2010) ...52
Table 4.3: Comparison of performance indexes for validation ...55
Table 5.1: Classification of fleet sizing models (Turnquist and Jordan, 1986) ...63
Table 5.2: Values of system parameters ...85
Table 5.3: Tank states ...92
Table 5.4: System performance in three tank routing policies with tank fleet size of 122, market demand of 6000 and system settings listed in Table 5.2 ...99
Table 5.5: Distribution of states of all tank cars under five tank routing policies with tank fleet size of 122, market demand of 6000 and system settings listed in Table 5.2 ...100
Table 5.6: System performance in five tank routing policies with tank fleet size of 98 and system settings listed in Table 5.2 ...100
Table 5.7: Distribution of states of all tank cars under five tank routing policies with tank fleet size of 98 and system settings listed in Table 5.2 ...101
x
Table 5.8: Number of completed routes of five routing polices with tank fleet size of 98
and system settings listed in Table 5.2...105
Table 5.9: Number of completed routes of five routing policies with tank fleet size of 122 and system settings listed in Table 5.2...105
Table 5.10: Customer satisfaction of five routing policies when all customers running inventory control at (2000, 1000) with (a) 98 tank cars, (b) 122 tank cars ...109
Table 6.1 Average customer satisfaction for two scenarios ...157
Table 6.2 Average market satisfaction for Scenario 1 ...157
Table 6.3 Average market satisfaction for Scenario 2 ...157
xi
List of Figures
Figure 2.1: An example of supply chain (Moyaux et al., 2006) ...6
Figure 2.2: The bullwhip effect (Moyaux et al., 2006) ...8
Figure 2.3: An example of agent-based model of supply chain (Julka et al., 2002) ...14
Figure 3.1: Elements of BPMN ...24
Figure 3.2: Legend of Flow Objects ...25
Figure 3.3: Process Diagram of (S, s) inventory control ...26
Figure 3.4: Process Diagram for periodical review (S, s) inventory control ...29
Figure 3.5: (a) Details of Tasks and Connectors in (S, s) inventory control model; (b) Execution trails for (S, s) inventory control...31
Figure 4.1: Schematic of multi-site lube additive supply chain (Adhitya et al. 2010) ...38
Figure 4.2: (a) Sequence diagram of enterprise-level collaboration; (b) Sequence diagram of raw material inventory management; (c) Sequence diagram of plant production operation (Adhitya et al. 2010) ...40
Figure 4.3: Process Diagram for Customers ...42
xii
Figure 4.5: Process Diagram for Logistics ...46
Figure 4.6: Process Diagram for Suppliers ...47
Figure 4.7: Process Diagram for Plant: (a) Pool for (S, s) policy; (b) Poor for periodical review policy ...50
Figure 4.8: (a) Plant S Inventory profile for Raw Material 1, 2, 3, 4 and 5; (b) Plant S Inventory profile for Raw Material 6, 7 and 8 ...53
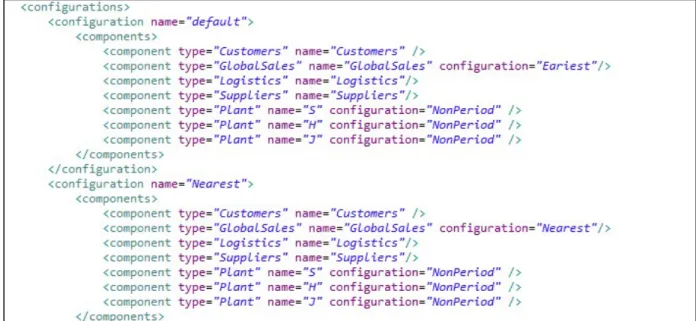
Figure 4.9: Configuration of BPMN-based model shown in Application XML file ...55
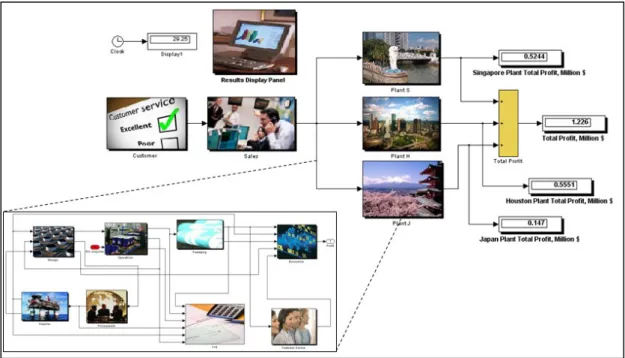
Figure 4.10: Schematic of MATLAB Simulink model of Multisite Specialty Chemicals Supply Chain (Adhitya et al. 2010) ...56
Figure 4.11: Process Diagram for Global Sales in Scenario 3 ...60
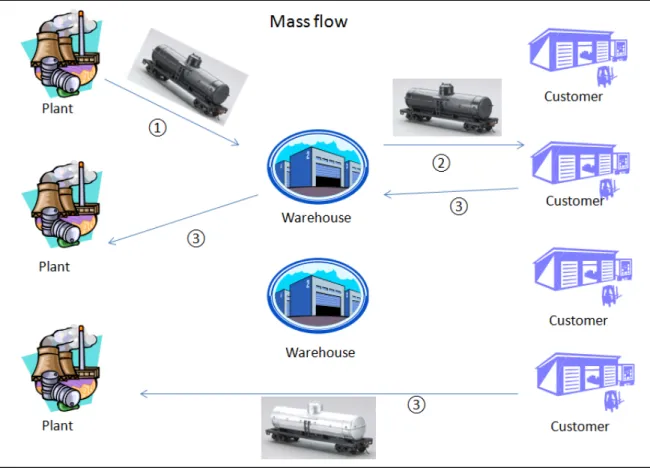
Figure 5.1: Schematic of a chemical supply chain: mass flow ...68
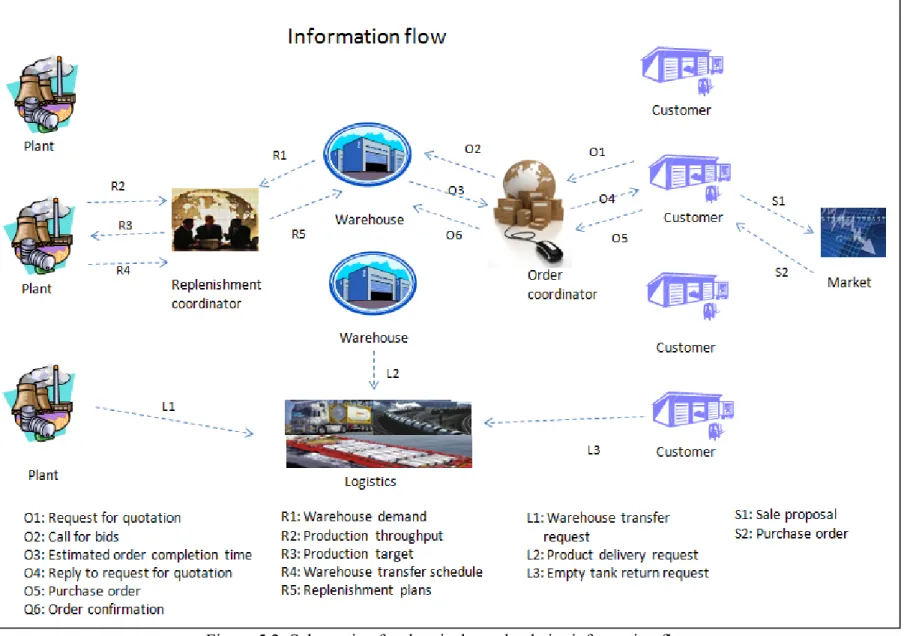
Figure 5.2: Schematic of a chemical supply chain: information flow ...69
Figure 5.3: Geographical locations of customers, warehouses and plants ...85
Figure 5.4: Customer sale of compound in a typical run ...86
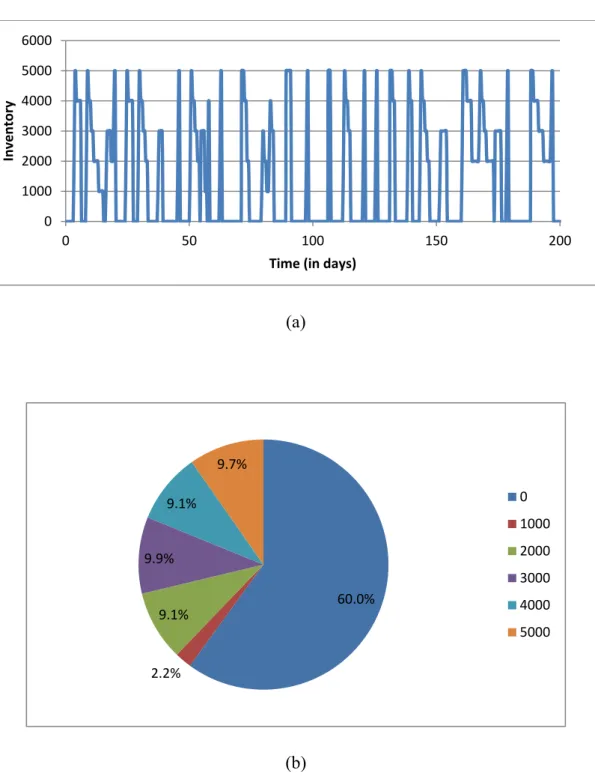
Figure 5.5: Inventory profile of Customer 1 in a typical run: (a) inventory vs. time (b) time proportion of different inventory level ...87
Figure 5.6: Customer 1 purchase order size distribution in a typical run ...88
Figure 5.7: Warehouse 1 inventory profile in a typical run ...89
Figure 5.8: Plant 6 production rate in a typical run ...89
xiii
Figure 5.10: One run simulation result: order quantity assigned to warehouses ...91
Figure 5.11: Plant production target in a typical run ...91
Figure 5.12: Warehouse-plant production target assignment in a typical run ...92
Figure 5.13: Time profile of tank states of a single tank car in a typical run ...93
Figure 5.14: Distribution of states of all tank cars in a typical run ...93
Figure 5.15: Profile of convergence index in customer satisfaction and market satisfaction versus number of simulation runs in the nominal policy ...98
Figure 5.16: Customer satisfaction profile of the five routing policies with (a) 98 tank cars, (b) 122 tank cars with system settings listed in Table 5.2 ...104
Figure 5.17: Market satisfaction profile of the five routing policies with (a) 98 tank cars, (b) 122 tank cars with system settings listed in Table 5.2 ...106
Figure 5.18: Shutdown duration profile of the five routing policies with (a) 98 tank cars, (b) 122 tank cars with system settings listed in Table 5.2 ...108
Figure 5.19: Market satisfaction profile when all customers running inventory control at (2000, 1000) with (a) 98 tank cars, (b) 122 tank cars ...110
Figure 6.1 Simulation results for supply chain model without transportation time delay: (a) customer satisfaction with 98 tank cars; (b) customer satisfaction with 122 tank cars; (c) market satisfaction with 98 tank cars; (d) market satisfaction with 122 tank cars ...119
Figure 6.2 Simulation results for supply chain model with maximum 50% transportation time delay: (a) customer satisfaction with 98 tank cars; (b) customer satisfaction with 122 tank cars; (c) market satisfaction with 98 tank cars; (d) market satisfaction with 122 tank cars ...122
Figure 6.3 Simulation results for supply chain model with maximum 100% transportation time delay: (a) customer satisfaction with 98 tank cars; (b) customer satisfaction with 122 tank cars; (c) market satisfaction with 98 tank cars; (d) market satisfaction with 122 tank cars ...124
xiv
Figure 6.4 Simulation results for supply chain model with maximum 200% transportation time delay (a) customer satisfaction with 98 tank cars; (b) customer satisfaction with 122 tank cars; (c) market satisfaction with 98 tank cars; (d) market satisfaction with 122 tank cars ...126
Figure 6.5 Simulation results for supply chain model with safety stock at warehouses and no transportation time delay: (a) customer satisfaction with 98 tank cars; (b) customer satisfaction with 122 tank cars; (c) market satisfaction with 98 tank cars; (d) market satisfaction with 122 tank cars ...129
Figure 6.6 Simulation results for supply chain model with safety stock at warehouses and maximum 50% transportation time delay: (a) customer satisfaction with 98 tank cars; (b) customer satisfaction with 122 tank cars; (c) market satisfaction with 98 tank cars; (d) market satisfaction with 122 tank cars ...132
Figure 6.7 Simulation results for supply chain model with safety stock at warehouses and maximum 100% transportation time delay: (a) customer satisfaction with 98 tank cars; (b) customer satisfaction with 122 tank cars; (c) market satisfaction with 98 tank cars; (d) market satisfaction with 122 tank cars ...134
Figure 6.8 Simulation results for supply chain model with safety stock at warehouses and maximum 200% transportation time delay: (a) customer satisfaction with 98 tank cars; (b) customer satisfaction with 122 tank cars; (c) market satisfaction with 98 tank cars; (d) market satisfaction with 122 tank cars ...136
Figure 6.9 Optimistic Production versus Paranoid Production (a) under normal operation, (b) under an incidence of shut-down ...140
Figure 6.10 Simulation results for supply chain model with Paranoid production policy and no transportation time delay (a) customer satisfaction with 98 tank cars; (b) customer satisfaction with 122 tank cars; (c) market satisfaction with 98 tank cars; (d) market satisfaction with 122 tank cars ...142
Figure 6.11 Simulation results for supply chain model with Paranoid production policy and maximum 50% transportation time delay: (a) customer satisfaction with 98 tank cars; (b) customer satisfaction with 122 tank cars; (c) market satisfaction with 98 tank cars; (d) market satisfaction with 122 tank cars ...145
Figure 6.12 Simulation results for supply chain model with Paranoid production policy and maximum 100% transportation time delay: (a) customer satisfaction with 98 tank
xv
cars; (b) customer satisfaction with 122 tank cars; (c) market satisfaction with 98 tank
cars; (d) market satisfaction with 122 tank cars ...147
Figure 6.13 Simulation results for supply chain model with Paranoid production policy and maximum 200% transportation time delay: (a) customer satisfaction with 98 tank cars; (b) customer satisfaction with 122 tank cars; (c) market satisfaction with 98 tank cars; (d) market satisfaction with 122 tank cars ...149
Figure 6.14 Example of tank car cleaning (http://www.kmtinternational.com) ...153
Figure 6.15 BPMN diagram of tank cleaning agent ...155
Figure 6.16 Market demand profile of Product A and B ...156
Figure 6.17 Customer satisfactions under constant market daily demand ...158
Figure 6.18 Market satisfactions under constant market daily demand ...159
Figure 7.1: A schematic of the equation-free approach (Kevrekidis et al., 2009) ...164
xvi
Chapter 1
Introduction
1.1
Background
A supply chain constitutes the various entities and activities involved in producing and delivering value to end customer in the form of product or service (Christopher., 1992; Ganeshan and Harrison, 1995; Lee and Billington, 1995). It is typically characterized by (1) material flows from the suppliers to the customers, (2) finance flows in the opposite direction, and (3) information flows in both directions. In reality, the organizations in most supply chains are not simply and sequentially linked; they can be cross-linked. For example, a plant might directly deliver products to retailers or customers. Thus, some researchers used “supply network” to describe the complex structure of supply chain (Harland and Knight, 2001). Through this whole thesis, “supply chain” is used as the standard term to describe this integrated system.
Supply chains commonly include operations for raw material procurement, storage, transportation, conversion, packaging, and distribution. These operations involve numerous heterogeneous entities with different (sometimes conflicting) interests, roles and dynamics with uncertainties, resulting in complex dynamics which in turn could lead to unforeseen domino effects. Management of these supply chain operations, termed supply chain management, is necessary to order to ensure that the supply chain performs smoothly and efficiently (Lummus and Vokurka, 1999). Supply chain management is achieved through a broad range of services, such as sourcing, contracting, planning, scheduling, monitoring, and financing. In today’s
increasingly complex, global, and competitive environment, enterprises consider supply chain management to be a key factor for achieving better profitability, efficiency and sustainability. These motivate the development of simulation models of the supply chain that can capture the behavior of these entities, their interaction and the resulting dynamics. These models should also allow users to manipulate the policies of particular entities and disturbance so that they can be used to evaluate the impact of specific decision-making or disruption on supply chain performance, to identify the bottleneck of the supply chain, and further to serve as valuable quantitative tools in decision-making in supply chain management.
Agent-based modeling, a relatively new computational modeling paradigm, is a powerful simulation modeling technique for complex dynamic systems. For the past few years, it has been implemented in various areas including market simulation and flow simulation. In agent-based modeling, a system is modeled as a collection of autonomous entities called agents (Bonabeau, 2002). Each agent has its own state and interest, and makes decisions based on series of rules. Agents can execute various behaviors commensurate with the system they represent, such as producing, delivering, buying or consuming. Agents are also able to interact with each other, and to perceive their environment and respond to changes. They can be even designed to be proactive. These characteristics make Agent-based modeling a suitable technique to model supply chains.
1.2
Research Objectives
There are two specific objectives for this proposed research:
1) To develop a new agent-based modeling approach for supply chains
Agent-based modeling of supply chain is challenging as entities in the supply chain have many complicated internal and external activities including pricing, bidding and negotiation, which are not easy to be described and analyzed. After an agent-based model is built, it is also very difficult to manipulate as a complex model might have hundreds of files and these files are poorly organized. If the modeler wants to make policy changes or
introduce disturbances, it would not be straightforward to figure out which specific file(s) should be modified. Our approach is to implement Business Process Management Notation (BPMN) into agent-based modeling of supply chain so that the activities in the supply chain can be described as a collection of flow objects. These flow objects represent behaviors or events appropriate for the system, such as sending a request or receiving an order. Related flow objects are linked with each other by sequence flow or message flow, organized as a specific workflow. In such a way, a supply chain can be easily modeled, well organized and directly visualized in the model itself. Moreover, the policies of entities (agents) and disturbance could be easily manipulated in the corresponding workflows. The proposed modeling framework is validated by replicating an existing multisite specialty chemicals supply chain model presented in previous studies.
2) To support tank fleet management through the developed new modeling
approach
The strict safety and environmental regulation on chemical storage and transportation, expensive purchasing, leasing and maintenance charge of tank fleet, and the serious consequences from tank car shortage make tank fleet sizing become an essential part of chemical supply chain management. Tank fleet sizing is not an isolated problem. It is closely related to tank fleet routing policy and other management policies and rules including inventory management policy. A complex chemical supply chain is presented and modeled through the proposed agent-based modeling framework. Subsequently, the developed agent-based model are used to formulate tank fleet management policies, study the performance of chemical supply chain under different scenarios and explore the effective strategies to manage tank fleet.
1.3
Outline of the Thesis
Chapter 2 discusses the supply chain management concept and provides a comprehensive literature review on agent-based modeling of supply chain and its applications. It also shows that agent-based modeling in chemical supply chain has not received adequate attention.
Chapter 3 describes BPMN and demonstrates how BPMN can be employed for development of agent-based models. Firstly, the advantages of BPMN and the possibility of implementing BPMN in agent-based model are discussed. Then the key elements of BPMN are introduced with simple supply chain operations as illustrations. The framework steps are described afterward.
Chapter 4 provides a case of multisite lube oil supply chain to illustrate the implementation of new agent-based modeling framework presented in previous chapter. It describes how supply chain entities, different policies, production operations, product transportation and also the supply chain conversations can be conceptualized into BPMN-based model.
Chapter 5 presents a new complex chemical supply chain model involving plants, warehouses, customers and market, as well as functional department such as order coordinator, replenishment coordinator and logistics department. Various tank fleet management policies are developed through case studies and implemented into the model. The performances of chemical supply chain under different scenarios are compared and discussed.
Chapter 6 demonstrates the advantages of the new ABMS framework by studying the ease of extension from the model developed in Chapter 5. The first section discusses the need for transportation disturbance studies in chemical supply chains, and compares the proposed tank fleet management strategies with two new local policies under the condition of transportation delays. The second section introduces the multi-product and tank fleet transition concept and demonstrates how tank fleet transition can be realized into the model described in the Chapter 5.
Chapter 7 presents the overall conclusion of this research thesis and a discussion of future research.
Chapter 2
Literature Review
2.1
Supply Chain Management
A supply chain is a network of organizations, people, resources and technology involved in the activities producing and delivering value to end customer in the form of products and services. Figure 2.1 shows an example of supply chain: raw material suppliers sell raw materials to tier suppliers that sell to primary manufacturers. Manufacturers produce products and send products to distribution warehouses that transport them to retailers. Finally, customers buy the products from retailers.
The Council of Supply Chain Management Professionals (CSCMP) defines supply chain management as follows:
“Supply chain management encompasses the planning and management of all activities involved in sourcing and procurement, conversion, and all logistics management activities. Importantly, it also includes coordination and collaboration with channel partners, which can be suppliers, intermediaries, third party service providers, and customers. In essence, supply chain management integrates supply and demand management within and across companies.”
Figure 2.1: An example of supply chain (Moyaux et al., 2006)
Supply chain management involves decision making at different levels. At the long term level, companies have to decide about the structure of supply chains over the next few years, such as the location of warehouses and plants, production system, the composition of the products and raw material supplier selection. At the midterm level, decisions have to be made on inventory policies, distribution planning policies, production capacity planning and contracts of raw materials. At the operational level, various decisions are made at different departments to ensure the smoothness of the material flows so that the customer orders can be fulfilled at a satisfactory level. For instance, warehouses decide the transportation plans for accepted orders, plants decide daily or weekly production plans, and procurement department decides on raw material ordering. The decision making across different levels requests a comprehensive systemic view of the supply chains so that they can be coordinated to achieve higher profit and improve customer service level.
Supply chains consist of independent entities that operate autonomously with different objectives and subject to different sets of constraints. The flow of materials, information and allocation of resources result in strong connections among the entities
which in turn determine customer service level, profit and costs. The welfare of any entity depends on the performance of the other entities and their willingness and ability to collaborate. Besides, lots of nonlinearities lie in the supply chains, such reliance on forecasts at each stage for base-stock decisions and differences in lot-sizing and transportation capacities. All these result in complexity and unpredictable domino effects. Hence, over the past decades, many scholars have studied supply chain dynamics from the perspective of complex systems (Choi et al. 2001; Peck, 2005; Surana et al., 2005; Datta et al., 2006).
For instance, increasing variability in market demand can get amplified along the supply chain due to bullwhip effect (shown in Figure 2.2), which increases uncertainty and results in the following consequences (Moyaux et al., 2006):
1) Excessive inventory investment: Since the bullwhip effect makes the demand more unpredictable, all upstream entities in the supply chain need to safeguard themselves with excessive inventory level to against the variations to avoid stock-out;
2) Poor customer service: In spite of having safety stocks there is still the hazard of stock-outs caused by the demand variance, resulting in a decrease in the customer service level;
3) Lost revenues and reduced productivity: In addition to the poor customer service level, stock-out may also cause lost revenues which in consequence would cause reduced productivity;
4) Ineffective planning and scheduling: Big variance in demand makes transportation planning, production planning and scheduling ineffective;
5) Difficult decision-making: Decision-makers have to react to demand fluctuations and adapt production and inventory capacities to meet peak demands;
6) High financial cost: The maintenance of higher safety stock and inventory level, and the ineffectiveness in production and transportation would induce a high financial cost.
Figure 2.2: The bullwhip effect (Moyaux et al., 2006)
Managing supply chains also faces the challenge from present increasingly complex, global, and competitive environment. In the last two decades, companies started to outsource their non-core activities to third party so that the fixed capital investment and operating costs can be reduced and more resources can be invested on their core competence. Global sourcing is one type of the sourcing which exploits global efficiency in the delivery of products and services in terms of low cost resources, low cost labor, low tax and other economic factors, such as low cost trained labor in China and low cost programmers in India. These practices make supply chain more complex and sometimes put companies in a riskier situation because of political risks, long lead time and difficulties of product quality monitoring. For instance, Apple returned as many as eight million iPhones to its major manufacture Foxconn due to quality problems in 2013. 2011 Thailand floods hit the global production of hard disk drives, which caused a worldwide shortage and the prices of most hard disk drives almost doubled. Many global electronic and automobile supply chains were greatly impacted. All these complexities make supply chain management difficult, and motivate the development of quantitative models for system analysis.
2.2
Supply Chain Modeling Approach
Supply chain modeling approaches can be characterized into mathematical programming and simulation modeling. In mathematical programming approaches, supply chains are modeled as a set of mathematical equations of system observables
such as flows and states, with objective(s) to be maximized or minimized and well-defined constraints which limit the solutions. These mathematical models are mix integer programming (MIP) based and require optimization algorithms to solve. Thus, mathematical programming approach requires:
1) A rigorous mathematical representation of the system 2) Solution/optimization algorithm
Therefore, a top-down methodology is implemented to formulate the problem. Objective(s) must be well quantified in the formulation of key state variables that define the system. The relationships between these state variables and those between state variables and local variables are also required. In order to make these variables mathematically tractable to construct the model, a number of assumptions have to be made to simplify the problems. For instance, multiple supplier or customers may be simplified and abstracted to one entity, the competition among entities may be ignored and the complexity of the supply chain architecture may be reduced. The simplification and the assumptions limit the extent to which the models reflect the reality of the complex relationships of supply chains, and the resulting optimal solution may be infeasible in the real supply chain.
Formulating the objective(s) to be optimized can be difficult, especially for modern supply chains composed of many independent elements. A clearly quantified objective(s) is not obvious in such systems. Take a multi-site manufacturing supply chain containing many plants for example. Each plant seeks to reduce its own costs and optimize individual profits, possibly at expense of the whole enterprise. In such situation, neither minimizing combined costs of all plants nor maximizing combined profits may be reasonable objectives.
The model formulation of mathematical programming approaches is brittle (North and Macal, 2007). A change in the formulation, e.g., continuous variable to discrete variable linear relation to nonlinear relation may require an entirely different solution algorithm. Besides, the solution of such models is also brittle. Some models may produce a highly optimal solution for a set of constrains and a static point in time, but these solutions may not prove to be robust in dynamic environments (Blackhurst et al., 2005). Optimal solution points are highly unstable once a slight change is made
in the problem data. As a result, these models are very brittle (Davidsson and Wernstedt, 2002; North and Macal, 2007). In this regard, mathematical programming approach is not suitable to implement in decision support on complex supply chains. It is more suitable to be employed in the operational level, such as production planning and scheduling, where the problem structure is fairly static and brittleness of the model is not an important concern.
Modeling and simulation is a promising approach for decision support in supply chains (Petrovic et al., 1998; Julka et al., 2002; Thierry et al., 2008; van Dam et al., 2009; Longo, 2011). Simulations can help managers identify the various behaviors that the real system could exhibit, gain deep insights into key system variables and their interactions, and enhance their ability to extrapolate and foresee the effects of events. Terzi and Cavalieri (2004) did a comprehensive review on over 80 papers and showed the features and benefits of modeling and simulation in the supply chain context: it allows enterprises to conduct what-if analysis and evaluate consequences of operational alternatives quickly before real implementation (Chang and Makatsoris, 2001). The simulation result changes as the assumptions and data used in the model change. It can effectively explore a board range of managers’ problems and situations that the enterprise may face (North and Macal, 2007)
Discrete event simulation is a common approach for supply chain modeling and simulation (Labarthe et al., 2007; Terzi and Cavalieri, 2004). It is a technique that models system processes as a chronological sequence of events (North and Macal, 2007). In discrete event simulation, time is represented only at discrete points, and each event (such as placing order) is scheduled to occur at these discrete time points. This in turn results in a sequence of events to be scheduled and processed. The state of the model changes over time which is triggered by these discrete events. No state change is assumed to occur between consecutive events, thus the simulation can directly jump from one event to the next.
Discrete event simulation focuses on fixed groups of entities that perform fixed sets of processes. The relationships between the entities and processes are typically defined at the start of simulation, rather than being generated or destroyed during the simulation. However, the system structure of supply chain varies over time. For example, enterprise may select new material suppliers; some customers may quit
the marketing network of the enterprise; enterprise may set up a new plant or sell a plant at certain time point; plant may change the production process because of the implementation of certain new technology. In such situations, discrete event simulation may not be a suitable modeling framework.
From the review of the modeling approaches discussed above, the requirements of a comprehensive modeling framework for supply chain can be summarized as follows:
1) It has to capture the changing in the system structure of supply chains over time.
2) It has to account for the independence of the various elements comprising supply chains, their decision structure and the strategic structure.
3) It has to account for the complex interactions between the entities in both technical and social level by integration of the material structure and the information structure into the model.
4) It has to capture the dynamically changing supply chain environment through modeling of the market mechanisms, and other agents and phenomena which is outside the supply chain but influences the various internal entities.
2.3
Agent-Based Modeling
Agent-based modeling and simulation (ABMS) can fulfill the requirements summarized in previous section. It uses a bottom-up approach. It starts by identifying the most basic building blocks, termed agents (entities in the supply chain, e.g. customer, warehouse and etc.) of the supply chain; specifying their individual behaviors and decision making mechanisms; and identifying the interactions and relationships between the agents and the external environment. As a result, the structure of the supply chain model is determined by all its elements (agents) and their aggregation to more complex systems across a number of hierarchical layers. The behavior of the overall supply chain model emerges as a result of behaviors of all its agents connected with each other and the environment the system is embedded in.
1) Agent-based model is natural description of the systems: It is technically easy but conceptually deep. The behavior of the system is larger than the sum of the parts;
2) Agent-based model is flexible: Modeler can tune the level of complexity in terms of heterogeneous agents and the way they interact. Learning and adaption can also be added into agent;
3) Agent-based model is scalable: Modeler can manipulate the number of agents and the layers of system hierarchy, according to the size of the problem he is interested in;
4) Agent-based model captures emergent phenomena: Agents behavior discontinuously and their interactions are heterogeneous, and thus can generate network effects.
As a new modeling and simulation technique, ABMS offers some advantages in the context of supply chains. Firstly, ABMS has a more natural fit to real industrial systems. The modeled elements are individuals in the supply chains, which leads to more realistic observations (Thierry et al., 2008). ABMS is not limited by process complexity and can deal with numerous interacting phenomena. It can capture the behavior of the entities in the system, their interactions and the resulting dynamics. Secondly, an agent-based model can be translated back to practice easily and thus supports direct experimentation (Parunak et al., 1998) since users can manipulate policies of particular entities in the model and evaluate the impact on the supply chain. Further, bottlenecks in the supply chain and possible solutions can be directly explored. Thirdly, information sharing is becoming crucial for efficient decision-making in today’s industries. A large amount of operational information is available to decision-makers at low cost because of the recent rapid developments in information and communication technology (Longo, 2011). ABMS offers an effective tool to identify and examine information sharing strategies to achieve a better supply chain performance (Ye and Farley, 2006). Besides, information technology provides sufficient amount of real data to train and validate supply chain models, and also offers a possibility to do real time evaluation of plans and schedules. As a result, ABMS serves as a valuable quantitative tool in decision-making for real-world supply chain management. A number of companies, such as Procter & Gamble (Garcia, 2005)
and Macy's (Bonabeau, 2002) have reported the use of ABMS in supply chain management.
The primary focus of agent-based modeling is the building block called agent. Agent is a discrete entity that has its own state and interest, and makes decisions based on series of rules. Agents can take independent behaviors commensurate with the system they represent. For instance, agents can perform behaviors as producing, delivering, buying or consuming in agent-based models of supply chain. Wooldridge and Jennings (1995) summarized the characteristics of agent:
(1) Autonomy: Agent operates without the direct intervention of humans or others, and has some kind of control over its actions and internal states;
(2) Social ability: Agent can interact with other agents via agent-communication language;
(3) Reactivity: Agent perceives environment and responds in a timely fashion to the changes that occur in it;
(4) Pro-activeness: Agents do not simply act in response to other agents and their environment; they are able to exhibit goal-directed behavior by taking the initiative.
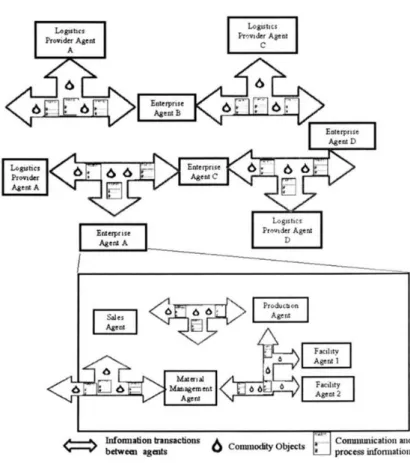
There is no rule to define or restrict the entity that should be modeled as an agent in agent-based models of supply chain. It is dependent on the size of the problem and the level of details that modeler is trying to capture in the model. Take the supply chain shown in Figure 2.3 for example. If the modeler is interested on the global supply chain of a specific chemical, he can model each enterprise involved as an agent as well as the logistics provider. Then he can build up the model by specifying the internal functions of each enterprise and logistics provider and their interactions (e.g. mass flow and information transactions). However, if the modeler is interested in the performance or decision-making process of a specific enterprise in the global environment, he can model this enterprise as a collection of agents. In this situation, for the particular enterprise, an agent could represent a single department or a combination of departments such as sales agent and production agent; for the other
enterprises, they can either be modeled as a collection of agents or modeled as a single agent.
Figure 2.3: An example of agent-based model of supply chain (Julka et al., 2002)
2.4
Survey of Agent-Based Models of Supply Chain
We have done a literature survey on agent-based models of supply chain, covering over one hundred journal papers from Scopus published in the five years from 2006 to 2010, and continued monitoring the new papers till the time of thesis writing (i.e. 2013). From our survey, most of the researchers working on agent-based models of supply chain focused on the following three aspects:
1) To enhance the functionality or intelligence of supply chain agents through implementation of widely used techniques including machine learning, optimization algorithms and neural network;
2) To develop new approaches for more efficient and effective coordination and negotiation among supply chain agents in various problems such as order management and replenishment planning;
3) To provide decision support through modeling and simulation of supply chain for specific industry or product.
Shen et al. (2006) did a comprehensive review on agent-based models of manufacturing system and argued that most of the researchers focused on the fundamental research to enhance intelligence of agents and effective collaboration mechanism. From our survey, the research focus remains unchanged in the past few years as the majority of the papers in our survey still focus on the enhancement of agent functionality and the development of collaboration framework. Some examples are illustrated as follows:
1) Learning of supply chain agent:
a. Kim et al. (2008) employed action-reward learning method and developed an asynchronous action-reward learning model which learned action cost faster than conventional action-reward leaning model. The authors built a simple two-stage serial supply chain model involving only supplier and retailer, and proposed two situation reactive inventory control models with non-stationary customer demand to study how the proposed learning model can be implemented to reduce average inventory cost.
b. Jiang et al. (2009) proposed a case-based reinforcement learning (CRL) algorithm for dynamic inventory control in an agent-based model of two-echelon supply chain involving retailer and customer. The parameter values of two inventory review methods were learnt using the proposed algorithm to satisfy target service level under nonstationary customer demand.
c. Valluri et al. (2009) applied agent-based modeling to investigate the comparative behavioral consequences of three simple reinforcement learning algorithms in a simple linear supply chain with five agents: customer, retailer, wholesaler, distributor and factory.
d. Chaharsooghi et al. (2008) addressed supply chain ordering management problem and implemented Q-learning algorithm to develop an effective reinforcement learning ordering mechanism for ordering management.
Majority of agent-based supply chain models in machine learning studies are simple sequential supply chains. Some even only have two echelons. Besides, the supply chain agents only have ordering and distribution functions. As a result, these developed algorithms might not be effective if they are implemented into a complex supply chain.
2) Optimization of supply chain operations:
a. Venkatadri et al. (2006) applied optimization in demand planning to help planner of the supplier make promise orders (price and due date) for the customers. The supply chain studied only have three entities (agents): one represents customers, one represents suppliers and the last represents centralized planner negotiating with customers.
b. Lin et al. (2008) employed genetic algorithm into supplier agent to plan quasi-optimal order fulfillment schedules to meet customers' demands. The supply chain in their study has two stages: supplier agent(s) and customer agent.
c. Mele et al. (2006) implemented genetic algorithm and simulation-based optimization to improve the operation of supplier under demand uncertainty. Each entity in the supply chain including plants, warehouses, distribution centers, and retailers, is represented as an agent. Beside, a central agent was employed to deal with the communication among the agents as well as the coordination through optimization and data analysis tools.
d. Ivanov et al. (2010) applied an optimization algorithm to solve the problem of planning and control in each agent along the supply chain and suggested a feed-back based, closed-loop adaptive supply chain optimization methodology for supply chain management. The agent-based model in their study contains enterprises and supply chain coordinator.
3) Decision making in supply chain agent:
a. O’Leary (2008) did an overview of decision support applications for time enterprises and a detailed investigation into supporting real-time supply chain decisions. The agents in their study are intelligent agent dealing with monitoring and data analysis of the supply chain and further served in adaptive planning and scheduling.
b. Wang et al. (2009) studied the mechanism of automatic decision making among software agents in service composition problem. Agents in their model deals with customer order services, procurement service, preprocess service, assembly service and prost-service.
Agents in such kind of studies are not used to model the actual entities but the controllers that can be placed in the system.
4) Cooperation and negotiation among supply chain agents:
a. Lin et al. (2006) integrated agent-based cooperative model and negotiation mechanism to resolve constraints in fulfilling supply chain orders by satisfying constraints. Intelligent agents were employed to model the supply chain entities: customer, manufacturers and supplier. Each agent has belief database, negotiation base, local scheduler, and coordination rules. Each agent communicated and cooperated with one another through coordination engine using proposals and counter-proposals.
b. Chan et al. (2006) proposed a coordination mechanism on early order completion contract with demand uncertainty to minimize the negative impacts of demand uncertainty. An agent-based simulation model including one retailer and four suppliers is built to evaluate the performance of proposed approach.
c. Zhang et al. (2010) identified and examined five information sharing strategies in B2B e-hubs. An agent-based E-Hub model was built which contained four types of agents: end customer, buyer, seller and supplier. Agents interacted with each other through orders, and their performances under different information sharing strategies were measured and analyzed.
d. Junga, et al. (2008) proposed a decentralized supply chain planning framework based on the minimal-information sharing between the manufacturer and the third party logistics provider. Manufacture and 3PL provider were modeled as agents that have their own database and planning systems.
The papers discussed above are related to various supply chain problems including order management and inventory management. Besides, planning strategy is also an essential topic in supply chain.
a. Frayret et al. (2007) combined agent-based technology and operation research tools, and proposed generic software architecture for the development of an experimentation environment to design and test distributed advanced planning and scheduling systems. The architecture was then configured into agent-based supply chain in lumber industry, which contains planning unit manager agent, source agent, deliver agent, make agent, and warehouse agent.
b. Forget et al. (2008) continued the work of Frayret et al. (2007), and developed a multi-behavior planning agent model using different planning strategies where decisions were supported by a distributed planning system by taking agility and synchronization into consideration.
c. Ivanov et al. (2010) introduced a new conceptual framework for multi-structural planning and operations of adaptive supply chains with structure dynamics considerations.
Some researchers are interested in the phenomenon of supply chain. For example, Fazel Zarandi et al. (2008) used a modified Hong Fuzzy Time Series with a genetic algorithm module to simulate the bullwhip effect and implemented a back propagation neural network for defuzzification and forecast the demand in fuzzy data. At last, an agent-based model of sequenced supply chain was developed to reduce the bullwhip effect. Their supply chain model contains manufacturer agent, distributor agent, wholesaler agent, retailer agent and other software agents that took in charge of information sharing and decision of best ordering policy through simulation module and genetic algorithm.
Among the papers in our survey, majority of them worked on simple sequenced generic supply chains, such as two-stage supply chain (e.g. supplier-customer or retailer-supplier-customer) and three-stage supply chain (e.g. supplier-retailer-customer). There are only ten papers working on specific industries or products: fashion industry, Canadian lumber industry, electricity supply chain, composite electronic products, chemical supply chain, and construction industry. As discussed above, Frayret et al. (2007) and Forget et al. (2008) worked on the planning strategy in Canadian lumber industry. In their model, some agents represent the core process operations while the others represent the control programs to coordinate the whole process. Lo et al. (2008) proposed an e-fashion supply chain management system with a web-based multi-agents design. Typical management information system development procedure was integrated into the system, making the system behavior more intelligent. There are two types of agents in this system: converting agents and application agents. Converting agents are acting on the interface between users and system. Their role is to manage the input and output information. Application agents are sitting on the layer between the database and conversation layer. Their role is to do scheduling and planning with the assistance of optimization tools. Xu et al. (2008) designed an agent-based model for simulating residential electricity consumption. The supply chain model contains consumer agent, power supply agent and policy maker agent. The author argued that the simulation model can serve as a useful tool to evaluate price policies.
From 2011 to 2013, there are two new journal papers studying on specific industries. One is working on the petroleum supply chain (Sinha, et al. 2011) and the other one is working on the pharmaceutical supply chain (Jetly et al., 2012). Sinha et al. (2011) applied agent based technology to model the petroleum supply chain from extraction till customer delivery. In their model, core operations rather than companies or departments are modeled as agents. Each operation agent also has subagents to represent their components. Negotiation framework was employed to ensure effective use of available resources so as to maintain sufficient inventory for processing at each stage of the supply chain. Jetly et al. (2012) developed a multi-agent simulation of the supply chains associated with the pharmaceutical industry. Manufacturers, suppliers and distributors were modeled as agents in their model,
which interacted with each other to produce and distribute drugs. Their model was validated using real financial data.
2.4.1
Agent-Based Supply Chain Models of Chemical Supply ChainsChemical industry is one of the world’s largest manufacturing industries, producing thousands of chemicals and formulations. Compared with other industries, chemical industries supply chain is very complicated because it involves numerous intrinsically complex sub-systems and there exists many interactions among these sub-systems. It is influenced by lots of external factors including fluctuating oil price and demand uncertainties. Chemical supply chain also has some specific features such as longer chains, complex transportation process, large inventory, complex manufacturing process, etc. (Srinivasan et al. 2006). Agent-based models are ideal for simulation and analysis of chemical supply chain.
For the past ten years, agent-based modeling in chemical supply chains did not receive adequate attention. Only a few researchers have implemented agent-based modeling into chemical supply chains. Srinivasan et al. (2006) proposed a new environment called G2 Multi-Agent Development Environment for agent modeling chemical supply chains and one easy to use framework to model the functions and activities within a supply chain. The new framework was demonstrated through illustration on refinery supply chain studies. Zhang et al. (2008) presented an agent-based model of a global specialty chemicals supply chain which considered various supply chain entities from upstream raw material suppliers to downstream customers. The specialty chemicals company was modeled as a collection of agents including centralized sales department and numerous production sites located as different locations. A case study was done on global lubricant additive supply chain. Behdani et al. (2010) demonstrated how an agent-based model of chemical supply chain can be developed to evaluate the dynamic behavior of supply networks, considering both the system-level performance as well as the components’ behavior particularly during disruptions. Later, they extended their work on the disruption management in chemical supply chains by developing an agent-based coordination framework (Behdani et al., 2011) to evaluate the effect of different coordination mechanisms, and a simulation-based approach for mitigating supply chain disruptions (Behdani et al., 2012). The model used in the three papers is an agent-based model of multi-site lube
additives chemical supply chain, which consists of a global chemical enterprise that having a global sales department and three production plant, customers and suppliers. Agents were used to represent (model) customers, global sales department, plants and suppliers. Besides, Pepple et al. (2011) also used an agent-based chemical supply chain model to analyze how a short-term shutdown caused by earthquake would impact the upstream and downstream chemicals with the supply chain network. All these work have demonstrated the capability of agent-based modeling and simulation in the decision support for supply chain management.
2.5
Chapter Summary
In this chapter, we introduced the supply chain management concept and discussed the requirements for supply chain modeling framework and the advantage of agent-based modeling in supply chain studies. We have done a comprehensive literature review on agent-based modeling of supply chain and its applications from over one hundred journal papers, and also demonstrated the application of agent-based modeling in the domain of chemical supply chain.
Agent-based models are typically implemented in platforms such as Mason, NetLogo, Repast and Swarm. Allan (2010) did a very comprehensive survey of ABMS software packages and indicated that most of the platforms are difficult to use, especially for non-technical users. Thus it calls for a new framework for developing agent-based models of supply chains which can be easily implemented into real business domain. In the following chapters of this thesis, we present a new agent-based supply chain modeling framework and demonstrate its application in chemical supply chains.
Chapter 3
BPMN Based Specification of
Agent-Based Models
3.1
Introduction
Good supply chain management is crucial for business success in today’s increasingly complex, global, and competitive business environment. Modeling and simulation is a popular tool to handle the complexities and uncertainties of supply chain so as to observe, investigate, analyze, and diagnose the real industrial systems. However, most of existing supply chain modeling approaches are complex, and resulting models are hard coded and very difficult for non-technical users to understand, manipulate and analyze. Business Process Modeling Notation (BPMN) is a widely recognized graphical modeling notation for business processes. In this chapter, we propose a BPMN-based framework for supply chain modeling.
BPMN was first introduced by Business Process Management Initiative in 2002, and is currently maintained by Object Management Group. It is a language for constructing business process models. A BPMN model reveals the order of activities, when they happen, and under what conditions. It is based on concepts similar to flowcharting, hence, it is considered business-friendly. Several versions of BPMN have been released. In this thesis, we follow version 1.2.
BPMN is an increasingly important standard for business process modeling, and has been widely adopted today and attracted high levels of attention (Recker,
2010). Nowadays, BPMN is broadly supported both freely and commercially, and there have been more than seventy companies and organizations that offer products and services supporting BPMN. As a visual modeling language, BPMN provides a standardized notation similar to traditional flowcharting, and makes it easy to understand and employ by both technical and non-technical users, allowing them to draft, document and communicate business process with their internal and external business partners. The role of BPMN is to serve as a business-friendly communication language to minimize the misunderstanding among the users having different technical skills or business knowledge during the business process design and implementation. Besides, BPMN is designed as “executable” oriented (Silver, 2009). The specifications of BPMN allows for automated execution of processes, which implies that BPMN models can be designed to control business processes. This ability to transform documentation of process flows to executable process model with simple notation makes BPMN unique.
3.2
BPMN Elements
Business process modeling in BPMN is made by process diagrams with graphical elements. There are four basic categories of elements in BPMN: Flow Objects, Connectors, Artifacts and Swimlanes.
BPMN has three primary shapes – activities, gateways, and events – as shown in Figure 3.1. These primary shapes have several subtypes distinguished by border style, symbols inside, and placement in the diagram.
Figure 3.1: Elements of BPMN
Flow Objects are core elements and consist of three types: Event, Activity and Gateway. An Event is something that “happens” during the course of a process including message sending, message receiving and timer. Events affect the flow of the process and usually have a trigger or a result. They can start, interrupt, or end the process. Event is represented by a circle with open centers to allow internal markers that distinguish different triggers and results. The trigger and result can be empty, message or timer. There exist three kinds of events in BPMN based on when they affect the flow: Start Event, Intermediate Event, and End Event (see Figure 3.2). In particular, Start Event acts as the trigger of a process; End Event represents the result of a process.
An Activity is a generic term for work that is performed within a business process. It is represented by a rounded-corner rectangle. An Activity can be atomic or compound. There are two types of Activities: Task and Sub-Process (see Figure 3.2). A Task is an atomic activity and is used when the work in the process is not or cannot be broken down into subparts. A Sub-Process is a compound activity that is included within a process. It can be represented in a finer level of details through a set of sub-activities, which enables hierarchical process development. Sub-Process has a “plus” sign in the lower-center of the shape indicates that this activity has a lower level of
detail. A Sub-Process has an event holder which can attach Intermediate Event for the purpose of exception handling, exception handling and compensation.
Gateways are control elements used to manipulate the convergence and divergence of the paths within a process. Thus, they will determine the forking, merging, and joining of paths. A Gateway is represented by a diamond shape with internal marker which indicates the type of behavior control, including Exclusive Gateway, Inclusive Gateway, Parallel Gateway and Complex Gateway. All gateways can split and merge the paths. Among these gateways, exclusive gateways are used where the sequence flow can take two or more alternative paths. There are two types of exclusive gateways based on decision mechanism, exclusive data-based gateway and exclusive event-based gateway. Exclusive gateways (see Figure 3.2) are also used to merge sequence flow. Parallel gateways are employed in a process where multiple parallel branches are defined.
Figure 3.2: Legend of Flow Objects
Flow Objects are connected together in a process diagram by Connecting Objects, which are of three types: Sequence Flow, Message Flow and Association. A
Sequence Flow is represented with a solid line with arrow and shows the order that activities will be performed in a Process. Conditional argument can be added to a Sequence Flow to make it Conditional Sequence Flow, which is employed following Exclusive Gateway where a selection of path is required. A Message Flow is represented as a dash line with an open circle at the beginning and an open arrow at the end. It is used to show the flow of message between two entities that are prepared to send and receive it. An Association is represented with a dotted line and is used to associate data, information and artifacts with Flow Objects.
Figure 3.3 presents a simple Process Diagram of (S, s) inventory control. (S, s) inventory control is a typical inventory management policy. S represents the order level and s represents the reorder point. Under this inventory policy, the inventory position of material/product is observed at a given time point. Once the inventory position (I) is below s, a quantity of S - I is ordered in order to bring the inventory position back to S. In Figure 3.3, the process model starts with a Task to attain inventory position I and reorder point s. An Exclusive Data-based Gateway with conditional argument is then employed to compare the value of I and s, and split the course of the process into two possible branches. If the inventory level is higher than reorder point, the process would end with Empty End Event. Otherwise, an order with quantity of S – I is initiated and the process ends up with sending out the order.
For business processes involving multiple entities, Swimlanes are employed to help partition and organize elements into separate visual categories in order to represent different responsibilities, roles or functions. They include two types in BPMN, i.e. Pools and Lanes. A Pool acts as a container of a business process. It could also represent as a major participant in a process. A lane is a sub-partition of a process. It is used to represent subdivision for the objects within a Pool. A pool contains one or more lanes. Pools are used to contain the individual business process of each participant. Lanes may be employed if a participant can be further divided into subparts.
Artifacts provide the additional capability to show more information beyond the basic flow-chart structure of the process in process diagram. There are currently three types of Artifacts in BPMN: Data Objects, Groups, and Text Annotations. Data Objects show which data or documents are required in a process; Groups are represented with a rounded dash rectangle and used to highlight certain sections of process diagram; and Text Annotations are used to provide additional information about a process.
Figure 3.4 illustrates a Process Diagram of periodical review (S, s) inventory control developed from the previous simple process. In this example, there are two major participants in the process: Retailer and Supplier. Retailer periodically reviews the inventory position of product under (S, s) policy and places order to Supplier. Two Pools are implemented to represent Supplier and Retailer respectively. As shown in the figure, the process of Retailer starts with an Empty Start Event, crosses the first Exclusive Data-based Gateway and proceeds to a Sub-Process which represents the product inventory control process. The process shown inside the Sub-Process executes every periodical time interval. It starts with obtaining inventory position I of the product based on the inventory level and outstanding orders. If the inventory position is higher than reorder point s, the Sub-Process would end. Otherwise, Retailer initiates an order with quantity of S – I, sends order to Supplier, and waits for the response. Once Retailer receives the reply, it saves the order information and ends the Sub-Process. After that, the process continues to a Timer Intermediate Event representing the time interval for periodical review, and links back to the first Exclusive Data-based Gateway, allowing periodical execution of the Sub-Process.
Supplier Starts with a Message Start Event which is the order sent from Retailer. Therefore the process of Supplier is triggered whenever an order (message) is received from Retailer. Upon receiving the order, Supplier checks the product inventory. If there is adequate stock, Supplier informs Retailer and initiates product delivery. Otherwise, Supplier informs Retailer of delayed delivery, start manufacturing product and initiates delivery once the order can be fulfilled. The details of the production and delivery Sub-Process are not included in this example. In this Figure, Message Flows are also employed in the model to represent the information flows between Retailer and Supplier.
In conclusion, in the implementation of BPMN in supply chain modeling, Tasks and Sub-Processes represent supply chain plans and activities. Sequence Flows connect Activities and present the linkage of different tasks and plans in supply chain operations. Message Flows construct and display the information flows, material flows and financial flows among supply chain entities. Gateways visualize the decision-making process and control the paths in supply chain process diagrams. Sub-rocesses present the hierarchy of large pSub-rocesses. Artifacts explain the process diagram in forms of data and text. In this way, supply chain model would have a better vision and organization compared with many other supply chain simulation models that contains hundreds of files without intuitive expression.
3.3
Execution of BPMN Models
BPMN is “executable oriented” designed. A BPMN model contains information that does not show in the diagram itself but is very important for model execution. The information mainly involves the properties (i.e. class and parameter value) of Activities, Sequence Flows, Message Events and Timer Events.
Figure 3.5(a) presents the property information in Text Annotations for (S, s) inventory control model in Figure 3.3. We assume that reorder point s is 50 units; order level S is 150 units and Inventory Position I is data input from user. As shown in the figure, the first task is associated with a function which assigns data input to inventory position I and attains the value of reorder point s. A conditional argument is added to the Condition Sequence Flow following the Exclusive Gateway so as to decide whether to place an order. If I is not larger than s, another function, which is attached to the second Task, is executed to attain the value order level S and compute the order quantity. After that, a Message Event is employed to send out the order. Figure 3.5(b) shows the inventory position and responding order quantity for 10 execution trails of (S, s) inventory control model. In this figure, order quantity of zero indicates that inventory position is higher than reorder point and there is no need to place an order.
(a)
(b)
Figure 3.5: (a) Details of Tasks and Connectors in (S, s) inventory control model; (b) Execution trails for (S,s) inventory control
25 92 37 45 60 12 96 53 8 72 125 0 113 105 0 138 0 0 142 0 0 20 40 60 80 100 120 140 160 0 2 4 6 8 10 Quantity