THE MECHANICAL PROPERTIES AND MICROSTRUCTURES OF VANADIUM BEARING HIGH STRENGTH DUAL PHASE STEELS PROCESSED WITH CONTINUOUS
GALVANIZING LINE SIMULATIONS
by Yu Gong
B.S. in Materials Science and Engineering, Zhejiang University, 2009
Submitted to the Graduate Faculty of
Swanson School of Engineering in partial fulfillment of the requirements for the degree of
Doctor of Philosophy
University of Pittsburgh 2015
UNIVERSITY OF PITTSBURGH SWANSON SCHOOL OF ENGINEERING
This dissertation was presented
by
Yu Gong
It was defended on October 30th, 2015
and approved by
Albert Chi Fu To, Ph.D., Associate Professor, Mechanical Engineering and Materials Science Scott X. Mao, Ph.D., Professor, Mechanical Engineering and Materials Science John A. Barnard, Ph.D., Professor, Mechanical Engineering and Materials Science Ian Nettleship, Ph.D., Associate Professor, Mechanical Engineering and Materials Science
Dennis Haezebrouck, Ph.D., Sr. Research Consulting Manager, USS Company Luis E. Vallejo, Professor, Ph.D., Civil and Environmental Engineering
Dissertation Director: Anthony J. DeArdo, Ph.D., Professor, Mechanical Engineering and Materials Science
Copyright © by Yu Gong 2015
For galvanized or galvannealed steels to be commercially successful, they must exhibit several attributes: (i) easy and inexpensive processing in the hot mill, cold mill and on the coating line, (ii) high strength with good formability and spot weldability, and (iii) good corrosion resistance. At the beginning of this thesis, compositions with a common base but containing various additions of V or Nb with or without high N were designed and subjected to Gleeble simulations of different galvanizing(GI), galvannealing(GA) and supercooling processing. The results revealed the phase balance was strongly influenced by the different microalloying additions, while the strengths of each phase were somewhat less affected. Our research revealed that the amount of austenite formed during intercritical annealing can be strongly influenced by the annealing temperature and the pre-annealing conditions of the hot band (coiling temperature) and cold band (% cold reduction). In the late part of this thesis, the base composition was a low carbon steel which would exhibit good spot weldability. To this steel were added two levels of Cr and Mo for strengthening the ferrite and increasing the hardenability of intercritically formed austenite. Also, these steels were produced with and without the addition of vanadium in an effort to further increase the strength. Since earlier studies revealed a relationship between the nature of the starting cold rolled microstructure and the response to CGL processing, the variables of hot band coiling temperature and level of cold reduction prior to annealing were also studied. Finally, in an effort to increase strength and ductility of both the final sheet (general formability) and the sheared edges of cold punched holes (local formability), a new thermal path was developed that replaced the conventional GI
THE MECHANICAL PROPERTIES AND MICROSTRUCTURES OF VANADIUM BEARING HIGH STRENGTH DUAL PHASE STEELS PROCESSED WITH CONTINUOUS
GALVANIZING LINE SIMULATIONS
Yu Gong, PhD University of Pittsburgh, 2015
microstructure. The new microstructure exhibited a somewhat lower strength but much high general and local formabilities. In this thesis, both the physical and mechanical metallurgy of these steels and processes will be discussed. This research has shown that simple compositions and processes can result in DP steels with so-called Generation III properties.
TABLE OF CONTENTS
ACKNOWLEDGEMENTS ... XXV
1.0 INTRODUCTION ... 1
2.0 BACKGROUND ... 6
2.1 GENERAL DESCRIPTION OF DUAL-PHASE STEELS ... 6
2.2 MECHANICAL PROPERTIES OF DUAL-PHASE STEELS ... 10
2.2.1 Tensile strength and yield strength ... 11
2.2.2 Work hardening ... 13 2.2.3 Ductility ………..16 2.2.4 Yielding behavior ... 17 2.3 ALLOYING ELEMENTS... 18 2.3.1 Manganese ... 18 2.3.2 Vanadium ………..19 2.3.3 Niobium ………..20
2.3.4 Chromium and molybdenum ... 21
2.4 FORMATION OF AUSTENITE ... 22
2.5 TEMPERING OF DUAL-PHASE STEELS ... 29
2.6 BANDING IN DUAL-PHASE STEELS ... 31
3.0 STATEMENT OF OBJECTIVE ... 36
4.1.1 Optical microscopy (OM) ... 39
4.1.2 Scanning electron microscope (SEM) and EBSD ... 40
4.1.3 Transmission electron microscopy (TEM) ... 40
4.2 MECHANICAL PROPERTIES ... 41
4.2.1 Tensile testing ... 41
4.2.2 Micro hardness and nano hardness ... 41
4.2.3 Hole expansion tests ... 42
4.3 HEAT TREATMENTS ... 42
4.4 MEASUREMENT OF RETAINED AUSTENITE ... 43
4.5 STORED ENERGY ... 44
4.5.1 Calculation of stored energy from EBSD scanning ... 44
4.5.2 Other methods to get stored energy ... 45
5.0 RESULTS AND DISCUSSION ... 47
5.1 MECHANICAL PROPERTIES OF DUAL PHASE STEELS WITH VANADIUM OR NIOBIUM ADDITIONS ... 47
5.1.1 Chemical compositions and thermomechanical processing ... 47
5.1.2 Results of hot rolled and cold rolled sheets... 50
5.1.3 Mechanical properties ... 52
5.1.4 Work hardening behavior ... 63
5.1.5 Microstructures of dual phase steels with full processing ... 67
5.1.6 Micro hardness ... 77
5.1.7 Results of dual phase steels with partial processing: study of austenite formation, dissolution behavior of cementite and recrystallization behavior of cold rolled ferrite ... 80
5.1.7.1 Effects of alloying elements on the austenite formation during intercritical annealing ... 80
5.3 EFFECTS OF V OR VN ON THE SOFTENING RESISTANCE OF DUAL PHASE
STEELS WITH EXTENDING HOLDING AT ZINC POT TEMPERATURE ... 102
5.4 INFLUENCE OF STORED ENERGY IN COLD ROLLED SHEET ON THE FORMATION OF AUSTENITE DURING THE SUBSEQUENT INTERCRITICAL ANNEALING OF V-BEARING DUAL-PHASE STEELS ... 114
5.4.1 Austenite formation during intercritical annealing ... 114
5.4.2 Effects of stored energy on the formation of austenite during intercritical annealing ... 117
5.5 EFFECTS OF THERMOMECHANICAL AND VANADIUM ADDITIONS ON THE MICROSTRUCTURE AND MECHANICAL PROPERTIES OF DUAL PHASE STEELS WITH HIGH CR, MO CONTENTS ... 127
5.5.1 Chemical compositions and thermomechanical processing ... 127
5.5.2 Mechanical properties of dual phase steels with high Cr, Mo contents ... 130
5.5.3 Effects of coiling temperature on the strength of vanadium bearing steels ... 155
5.5.4 Effects of coiling temperature and cold rolling reduction on ferrite grain size ... 160
5.5.5 Fracture study ... 165
5.5.6 Sheared edge formability-hole expansion ratio ... 168
5.6 EFFECTS OF THERMOMECHANICAL AND VANADIUM ADDITIONS ON THE MICROSTRUCTURE AND MECHANICAL PROPERTIES OF DUAL PHASE STEELS WITH LOW CR, MO CONTENTS ... 178
5.6.1 Mechanical properties of dual phase steels with low Cr, Mo contents ... 178
5.6.2 Microstructures of low alloyed DP steels and the discussions of the roles of Cr, Mo ... 186
5.6.3 Sheared-edge formability of low alloyed DP steels ... 192
5.7 OVERALL DISCUSSIONS: IMPROVING THE STRENGTH-DUCTILITY BALANCE IN HIGH STRENGTH DUAL PHASE STEELS THROUGH THE ADDITION OF VANADIUM ... 197
5.7.1 Stored energy of initial cold rolled sheets ... 197
5.7.2 Mechanical properties of dual phase steels with various conditions ... 206
5.7.3 Retained austenite and supercool temperatures ... 216
5.7.4 Precipitation hardening from the benefits of vanadium additions ... 220
7.0 FUTURE WORK ... 246 APPENDIX A ... 248 BIBLIOGRAPHY ... 255
LIST OF TABLES
Table 5.1.1. Chemical compositions of the five steels used in this study, Wt.%, The chemical
composition of the commercial steel is also included ... 47
Table 5.1.2 Predicted Critical temperatures of the five steels used in this study, and the volume fractions of austenite at different IAT are also shown ... 50
Table 5.1.3 Mechanical properties of the DP steels for the 7 full processing in this current study. ... 59
Table 5.1.4. Hole expansion ratios (HE %) and reduction in area (RA%), which was measured from OM images of the fracture surfaces after tensile testing, of the DP steels with different alloying elements. A1 is the standard galvanizing processing and C1 is the supercool processing with supercool temperature 250oC. ... 63
Table 5.1.5. n(ε)= , εis true strain, σ is true stress. The values of n in the table are the averaged ones in the specific true strain range as shown in the table. ... 64
Table 5.1.6. Strain-hardening exponent (m) from modified C-J analysis and the transition strains between the two stages of work hardening behavior ... 64
Table 5.1.7. Volume fractions (%) of MA, and TM in the DP steels with five different compositions and A1,A 3, B1 and C1 processing ... 71
Table 5.1.8 values of VHN in soft region and hard region for DP_V ... 78
Table 5.1.9. VHN values of soft region and hard region for DP_VN, 10g, Gleeble1 at USS ... 78
Table 5.1.10 values of VHN in soft region and hard region for DP_NbV... 78
Table 5.1.11 Volume fractions of MA of the five steels with processing group M ... 81
Table 5.1.12. Volume fractions (%) of non-recrystallized ferrite at different intercritical annealing temperatures and holding times for DPV and DPVN ... 91
Table 5.2.1. Heating rate to IAT (T) is 5oC/s, the numbers are the tensile strength (MPa). ... 95
Table 5.2.3 Volume fraction of MA, a, 800oC, 1min; b, 800oC, 2min; c, 800oC, 5min; and d, 820oC, 2min (water quenched) ... 97 Table 5.3.1. Analyzed chemical compositions (wt.%) of DPV and DPVN. DPU is the commercial dual
phase steels supplied by USS. ... 103 Table 5.3.2. Tensile strength (UTS) and yield strength (YS) of dual phase steels with V or VN addition
and commercial DPs without micro alloying elements. Each number is the average of two tests. ... 103 Table 5.3.3. Uniform elongation (UE, converted to 2 inch gauge length), total elongation (TE, converted
to 2 inch gauge length), and work hardening ratios (between 4% and 6% engineering strain) of dual phase steels with V or VN addition and commercial DPs without micro alloying elements. Each number is the average of two tests. ... 103 Table 5.3.4. Volume fractions (%) of MA and bainite in DPV with different holding time at zinc pot
temperature ... 106 Table 5.3.5. Volume fractions (%) of MA and bainite in DPVN with different holding time at zinc pot
temperature ... 106 Table 5.4.1. Austenite amount (%) after intercritical annealing and water quench (or air cooling AC) for
cold rolled (60% vs 72%) DPV, DPVN and DPNbV steels. The number in the parentheses is the heating rate from room temperature to IAT. ... 117 Table 5.4.2. Averaged stored energy calculated using different methods (J/cm3) and the VHN values. . 121 Table 5.4.3. Volume fraction of stored energy greater than 5, 10 or 14 J/cm3 for cold rolled (CR) samples ... 124 Table 5.4.4. Different Gleeble processing applied to DPV (60%CR and 72%CR) and DPVN (60%CR)126 Table 5.5.1. Chemical composition (wt. %) of the four steels used in this section and section 5.6 ... 128 Table 5.5.2. Conditions (addition of microalloying elements, coiling temperatures (CT) and cold rolling
reduction) of initial cold rolled (CR) sheets with sample IDs used in this paper. ... 128 Table 5.5.3. Critical temperatures of austenite formed at 790oC of steels 2A and 2B, estimated from
JMatPro commercial software. ... 128 Table 5.5.4. Increase in the tensile strength due to the addition of 0.06% wt.% vanadium. UTS-A is the
tensile strength of dual phase steels without vanadium addition in the first column, and UTS-B is
the tensile strength of DPs with vanadium addition in the second column. ΔUTS is the increase in
UTS. ... 135 Table 5.5.5. Increase in the yield strength due to the addition of 0.06% wt.% vanadium. YS-A is the yield
strength of dual phase steels without vanadium addition in the first column, and YS-B is the yield
Table 5.5.7. Work hardening exponents (n-values between engineering strain 4% and 6%) of dual phase steels with high Cr, Mo contents ... 140 Table 5.5.8. Volume fractions of martensite, bainite and tempered martensite in high alloyed DPs with
80% cold reduction. ... 152 Table 5.5.9. Volume fractions of martensite, bainite and tempered martensite in high alloyed DPs with
50% cold reduction. ... 153 Table 5.5.10. Mechanical properties (UTS, YS, TE and HE) of the dual phase steels with 50% cold rolling
reduction, the Gleeble heat treatment E1: 790oC/60s, 15oC/s, 250oC/20s, 42oC/s, 460oC/30s, 10oC/s to RT ... 156 Table 5.5.11. Tensile strength (UTS) of hot band steels with high Cr, Mo and with or without V addition.
Each number is the average of two tests. ... 157 Table 5.5.12. Ferrite grain size of high alloyed DPs with E1 processing. ... 165 Table 5.5.13. Measured hole expansion ratios (HER). ... 175 Table 5.5.14. Comparison of hole expansion ratios of vanadium free DPs and vanadium bearing DPs at
the same UTS level, TE were converted to 2 inch specimens ... 177 Table 5.6.1. Increase in the tensile strength due to the addition of 0.06% wt.% vanadium. UTS-A is the
tensile strength of dual phase steels without vanadium addition in the first column, and UTS-B is the tensile strength of DPs with vanadium addition in the second column. ΔUTS is the increase in UTS. ... 183 Table 5.6.2. Increase in the yield strength due to the addition of 0.06% wt.% vanadium. YS-A is the yield
strength of dual phase steels without vanadium addition in the first column, and YS-B is the yield
strength of DPs with vanadium addition in the second column. ΔYS is the increase in YS. ... 183 Table 5.6.3. Work hardening exponents (n-values between engineering strain 4% and 6%) of dual phase
steels with low Cr, Mo contents ... 186 Table 5.6.4. Volume fractions of martensite, bainite and tempered martensite in low alloyed DPs with
80% cold reduction, 2%-6%bainite can be found for E1 processing. ... 191 Table 5.6.5. Volume fractions of martensite, bainite and tempered martensite in low alloyed DPs with
50% cold reduction, 2%-6%bainite can be found for E1 processing. ... 191 Table 5.6.6. Hole expansion ratios of DPs with low Cr, Mo and various heat treatments. Top holder 6mm
radius flat ... 193 Table 5.6.7. hole expansion ratios of USS commercial DP590 and DP780 tested at BAMPRI using the
same procedure as for the tests in Table 5.6.6 i.e. Bottom holder 40mm hole, top holder 40mm hole and 6mm radius flat, and continuous die moving speed 0.5mm/s. The hole expansion ratios of USS commercial DP980 were tested in USS lab. ... 193
Table 5.7.3. VHN (300g) of cold rolled (50%CR and 80%CR) initial steel sheets with low Cr, Mo
contents, and the increase in VHN (ΔVHN) due to the addition of 0.06% w.t% vanadium. ... 198
Table 5.7.4. VHN (300g) of cold rolled (50%CR and 80%CR) initial steel sheets with high Cr, Mo
contents, and the increase in VHN (ΔVHN) due to the addition of 0.06% w.t% vanadium. ... 198
Table 5.7.5. Retained austenite calculated from magnetic properties. ... 217 Table 5.7.6. Amount of retained austenite from magnetic measurements ... 220 Table 5.7.7. Strain hardening exponents n-values (4%-6% engineering strain) and uniform elongations of
DPs with high Cr, Mo contents. ... 231 Table 5.7.8. Strain hardening exponents n-values (4%-6% engineering strain) and uniform elongations of
DPs with low Cr, Mo contents. ... 232 Table 5.7.9. Work hardening exponent n-values between engineering strain 0.2% and 0.5%. ... 234 Table 5.7.10. Work hardening exponent n-values between engineering strain 0.2% and 0.5%. ... 234 Table A1. Volume fractions of RA, polygonal ferrite and martensite from IQ peak fitting for DPV, GI
(A3) ... 253 Table A2. Volume fractions of RA, polygonal ferrite and martensite from IQ peak fitting for DPNbV, GI
(A3) ... 254 Table A3. Volume fractions of RA, polygonal ferrite and martensite from IQ peak fitting for DPVN, GI
LIST OF FIGURES
Figure 1.1. Comparison of tensile strength and total elongation for different types of steels ... 2 Figure 2.1.1. Schematic representation of basic two-phase microstructure species ... 7 Figure 2.1.2 Schematic stress-strain curves for plain carbon, HSLA, and dual phase steels. SAE 950X
and 980X are Society of Automotive Engineers designations for HSLA steels of different strength levels. GM 980X is a General Motors developed dual phase steel. GM 980[9] ... 8 Figure 2.1.3 Schematic representation of intercritical annealing and water quenching (WQ) for developing
dual phase structure, IAT means intercritical annealing temperature ... 9 Figure 2.2.1 The 0.2 pct flow stress and the tensile strength as a function of percent martensite for the Fe-Mn-C alloys[21] ... 11 Figure. 2.2.2 Uniform elongation as a function of tensile strength for standard HSLA steels and Fe-Mn-C
dual phase steels[21] ... 11 Figure 2.4.1 (a) Schematic view of the microstructure, (b) variation of the carbon content across the
cementite-austenite-ferrite boundaries, F=ferrite, A=austenite, and P=pearlite[80] ... 24 Figure 2.4.2 Carbon concentration profile around the carbide spheroid during dissolution[88]... 26 Figure 2.4.3 Initial conditions. A ferrite-pearlite mixture is heated into the intercritical range to produce
austenite particles of width, 2L, separated by distance, 2W, as illustrated schematically in (a). The austenite is initially of eutectoid composition , with a carbon concentration profile as in (b). The manganese concentration is uniform as shown in (c) ... 27 Figure 2.6.1 An illustration of the common mechanism of banding ... 32 Figure 2.6.2 Schematization of Mn segregation and microstructures expected to depend on the austenite
grain size and the density of ferrite nuclei ... 34 Figure 5.1.1. Schematic diagram of hot rolling and cold rolling used for each type of steel in the current
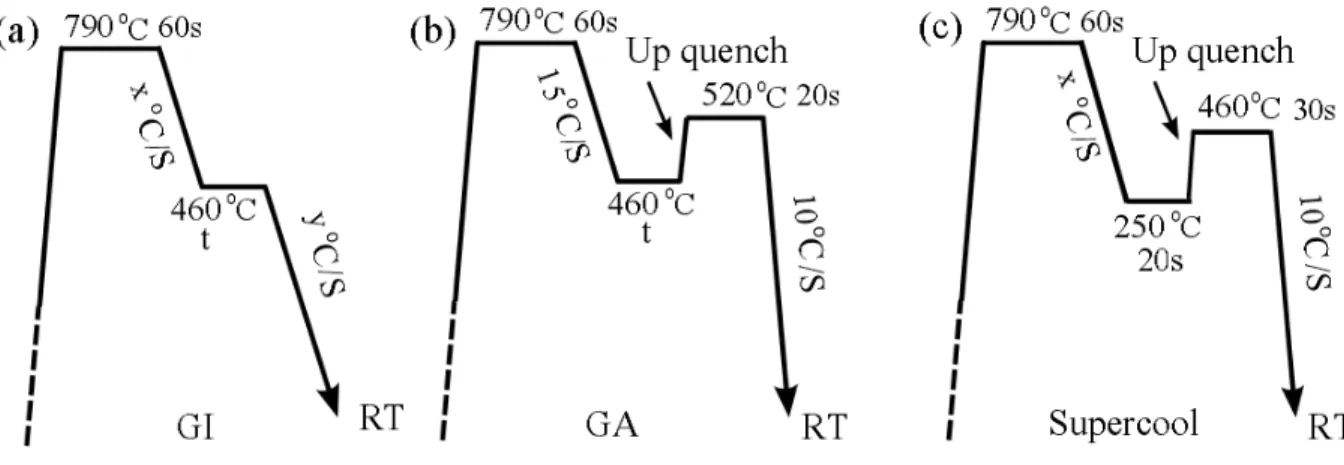
study, RT means room temperature ... 48 Figure 5.1.2. Schematic representation of heat-treatment schedules for Gleeble processes.GI: A1,
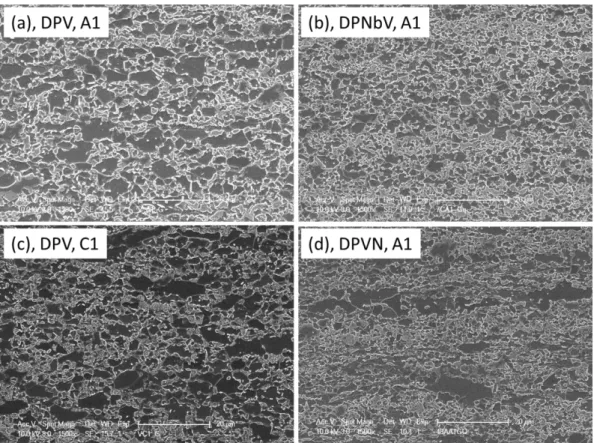
Figure 5.1.3. 2% Nital etched microstructures of hot rolled samples (a) DP_V, (b) DP_Nb, (c) DP_V higher magnification, and (d) DP_V SEM microstructure. ... 51 Figure 5.1.4 (a) optical microstructure of DP_Nb, Nital etched, (b) optical microstructure of DP_VN,
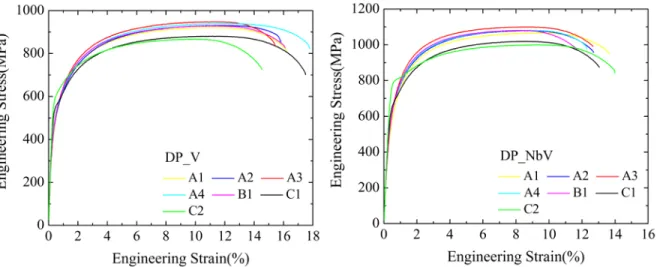
Nital etched, (c) optical microstructure of DP_VN, LePera etched, and (d) SEM microstructure of DP_VN ... 52 Figure 5.1.5 Engineering strain versus stress curves of DP_V and DP_NbV with full processing GI (A1-A4), GA (B1) and Supercool (C1-C2). ... 53 Figure 5.1.6 True strain versus stress curves of DP_V and DP_NbV with full processing GI (A1-A4), GA
(B1) and Supercool (C1-C2). ... 53 Figure 5.1.7 Tensile strength and 0.2% yield strength of DP steels in this work, and the corresponding
values of commercial DP steels are also included ... 54 Figure 5.1.8 Values of work hardening exponent n (4%-6%) and yield strength to tensile strength ratios of
DP steels in this work, and the corresponding values of commercial DP steels are also included 55 Figure 5.1.9 Total elongation and uniform elongation of DP steels in this work, and the corresponding
values of commercial DP steels are also included ... 56 Figure 5.1.10 Values of UTS×TE and YS×UE of DP steels in this work, and the corresponding values of
commercial DP steels are also included ... 57 Figure 5.1.11 (a) Comparison of MA volume fraction versus UTS with the corresponding values obtained
by Davies[21], the data of DPV, DPVN and DPNbV with A1, A3 and B1 processing were plotted in this figure, (b) comparison of UTS versus UE with the corresponding values obtained by Davies[21]. The values of commercial steels are also included ... 58 Figure 5.1.12. The relationship between the volume fractions of retained austenite obtained by
magnetometry and the total elongations of the DPNbV steels ... 60 Figure 5.1.13 . Relationship among hole expansion ratio (HE%), tensile strength (UTS), n-values,
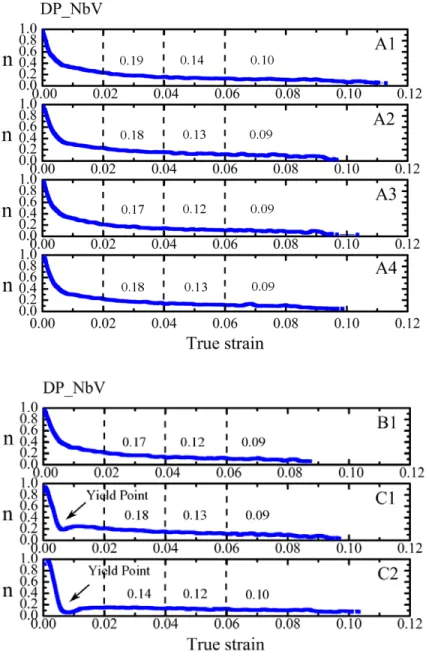
YS/UTS ratios and reduction in area (RA%) ... 62 Figure 5.1.14 Instantaneous n-values versus true strain curves for the 7 full processing of DP_NbV ... 65
Figure 5.1.15 ln(dσ/dε) versus lnσ curves of the five steels with GI (A3) processing, the transition strains and the slopes of the two parts of the curves are also shown in the figure ... 67 Figure 5.1.16 SEM microstructures of DP_V, DP_VN and DP_NbV, 2% Nital etched ... 69 Figure 5.1.17. SEM microstructures of (a) DPV, A3, (b) DPNbV, A3 and (c) DPVN, A3 processing ... 70 Figure 5.1.18. SEM microstructures of (a) DPVN, C1, (b) DPNbVN, C1, (c) DPNbV, C1, and (d) DPNb,
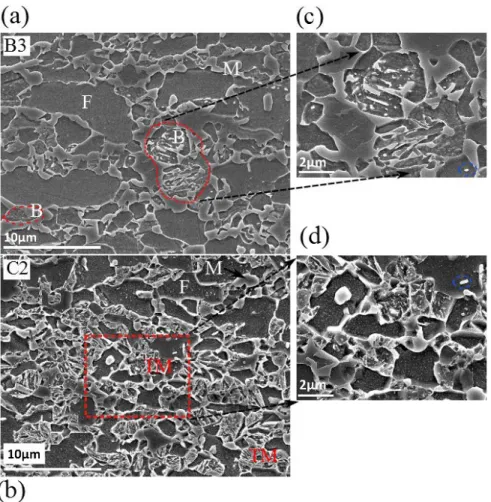
Figure 5.1.20 SEM microstructures of DP_V with full processing GA (B3) (a) and C2 (b), (c) is the microstructure with higher magnification of the area enclosed by dashed red circle in (a), (d) is the enlarged microstructures of the area enclosed with dashed red square in (c). The bright white particles enclosed with dashed blue lines are the cementite ... 74 Figure 5.1.21 SEM microstructures of DP_VN with full processing GA (B2), (b) and (c) are the
magnified microstructures of (a) at the central region ... 75 Figure 5.1.22 Optical microstructures of DP_NbV, GI(A3). (a) and (b) Nital etched, (c) LePera etched. 76 Figure 5.1.23 Optical microstructures of DP_NbV. (a) GI(A4), LePera etched, (b) GA(B1) LePera etched,
(c) Supercool (C2), Nital etched. ... 76 Figure 5.1.24 SEM microstructures of DP_NbV with full processing GI (A1 and A3), GA (B1) and
Supercool (C2) ... 77 Figure 5.1.25. VHN (10g) of DP_V, DP_VN and DP_NbV at ferrite bands (soft region) and MA bands
(hard region) respectively ... 79 Figure 5.1.26. Micro-hardness indents (VHN 10g) in DP_NbV, GI (A3), LePera etched ... 79 Figure 5.1.27 partial processing conducted in MTS system, (a) M1 1min, M2 2min, and M3 5min. (b) T1
0s, T2 30s and T3 8min. Air cooling (AC), water quenching (WQ) ... 80 Figure 5.1.28. microstructures of DP_V with processing M1 (a) LePera etched, (b) Nital etched, (c) and
(d) SEM microstructures of different magnifications ... 82 Figure 5.1.29. DPV, 60% cold rolled (a) 780oC, 1min, WQ, (b) 780oC, 2min, WQ and (c) 780oC, 5min,
WQ. (LePera Etched, White MA, Brown Ferrite) ... 82 Figure 5.1.30 Volume fractions of the five steels with different holding time at IAT 780oC ... 83 Figure 5.1.31 LePera etched microstructures (a) DP_VN, M1 (b) DP_Nb, M1(c) DP_NbV, M2 ... 83 Figure 5.1.32 SEM microstructures of DP_VN, (a) M1, 780oC, 1min, (b) M2, 780oC, 2min, (c) M3,
780oC, 5min and (d) DP_NbVN, M2, 780oC, 2min ... 84 Figure 5.1.33. OM images (above 3 images) of DPVN, DPNbV and DPV (from left to right) and SEM
microstructures of the corresponding steels (bottom, from left to right DPVN, DPNbV and DPV, respectively), the heat treatment is 650oC/5min, WQ, heating rate from RT to IAT 650oC is 5oC/s. ... 85 Figure 5.1.34. SEM microstructures of DPV (60%CR) (a) 700oC for 5minutes, (b) 720oC for 5 minutes,
(c) 740oC for 5minutes, (d) 760oC for 1minute, (e) 760oC for 2minutes, (f) 780oC for 0s, and (g) 780oC for 1minute, water quenched. ... 86 Figure 5.1.35 Microstructures of DP_NbV, (a) cold rolled, LePera etched, (b) cold rolled, SEM, (c)
680oC, for 5minutes, water quenched, LePera etched, and (d) 680oC for 5minutes, water quenched, SEM. ... 89
Figure 5.1.37. SEM microstructures of (a) DPVN, (b) DPV and (c) DPNb after holding at 680oC for 5
minutes and then water quenched. ... 91
Figure 5.1.38. OM microstructures of (a) DPV, 780oC 0s WQ, and (b) DPVN, 780oC, 0s, WQ ... 92
Figure 5.1.39 SEM microstructures of DP_V with partial processing T2 (460oC, 30s), ACRT ... 93
Figure 5.1.40 SEM microstructures of DP_VN with partial processing T3 (460oC, 8min), ACRT ... 93
Figure 5.1.41 SEM microstructures (a) DP_V with partial processing T3 (460oC, 8min), ACRT (b) DP_VN, with partial processing T2 (460oC, 30s), ACRT ... 94
Figure 5.2.1. Tensile strength and yield strength of DPV and DPVN with IAT 790oC and 820oC, as listed in Tables 5.2.1 and 5.2.2. The first number in the horizontal axis is the cooling rate (oC/s) from IAT to zinc pot temperature, and the second is the cooling rate from zinc pot temperature to room temperature. ... 96
Figure 5.2.2. Optical microstructures (LePera etched) of DP_V, (a) 800oC, 1min, (b) 800oC, 2min, (c) 800oC, 5min, (d) 820oC, 2min (water quenched). MA white, ferrite brown ... 97
Figure 5.2.3. (a) DPV, 820oC/1min, 30oC/s, 460oC/30s, 10oC/s to RT, 35% bainite, 12% MA, (b) DPV, 820oC/1min, 30oC/s, 460oC/30s, 30oC/s to RT, 31% bainite, 15% MA... 98
Figure 5.2.4. Illustration of the effects of different alloying elements on the transformation of austenite to bainite for galvanizing processing[80]. ... 98
Figure 5.2.5. Predicted Bs and Ms temperatures using JMatPro of DPV at different intercritical annealing temperatures ... 99
Figure 5.2.6. SEM microstructures of (a) DPVN, 820oC/(60oC/s)460oC/(10oC/s)RT, (b) DPVN, 820oC/(30oC/s)460oC/(30oC/s)RT, (c) DPVN, 820oC/(60oC/s)460oC/(30oC/s)RT (d) DPVN, 790oC/(30oC/s)460oC/(30oC/s)RT. For higher IAT 820oC, bainite microstructures can be clearly observed and all the ferrite are recrystallized, while for lower IAT 790oC, little bainite was found and some non-recrystallized ferrite still existed. ... 100
Figure 5.2.7. SEM microstructures of (a) DPVN, 820oC-30oC/s-460oC-30oC/s-RT, (b) DPVN, 820o C-60oC/s-460oC-30oC/s-RT ... 102
Figure 5.3.1. Tensile strength (UTS) of dual phase steels with V or VN addition and commercial DPs without micro alloying elements. ... 104
Figure 5.3.2. Yield strength (YS) of dual phase steels with V or VN addition and commercial DPs without micro alloying elements. ... 104
Figure 5.3.3. SEM micrographs of (a) DPV, A5 (460oC, 60s), (b) DPV, A6 (460C, 120oC), (c) DPVN, A5 (460oC, 60s), and (d) DPVN, A6 (460C, 120oC) ... 105 Figure 5.3.4. Bright field image (a) and Dark field image (b) of twined martensite, SADP of twinned
Figure 5.3.6. HRTEM and FFT of a larger VC in extracted replica. Note the quality of the lattice image of the particle edge is much better than that in the center, in DPV, A5. ... 109 Figure 5.3.7. Typical and conventional electron diffraction pattern (EDP) from thin foil specimen,
showing VC forms in α ferrite with Baker-Nutting orientation relationship in DPV, A5. ... 109 Figure 5.3.8. HRTEM images of VCx particle embedded in ferrite matrix in the foil of DPV, A5, the FFT
patterns of VCx and ferrite confirmed the relationship between particle and ferrite matrix, i.e. Baker-Nutting orientation relationship. ... 110 Figure 5.3.9. HRTEM images of VCx or V(CN)x precipitates in DPVN, A5 (460oC/60s). ... 112 Figure 5.3.10. AlN found in DPVN, A5, replica ... 113 Figure 5.4.1. DPV, 72% cold rolled (a) 780oC, 0s, WQ, (b) 780oC, 1min, WQ and (c) 790oC, 1min, WQ
and (d) 820oC, 1min,WQ (SEM micros, 2% Nital Etched) ... 116 Figure 5.4.2. X-ray diffraction profiles of as cold rolled DPV(60%CR and 72%CR), DPVN(60%CR) and
DPNb(60%CR), hot band steels of DPV and DPNbV, as well as annealed DPV(60%CR, 720oC for 1minute and then water quenched). ... 117 Figure 5.4.3. Image Quality (IQ) images of (a) DPV, HB, quarter, (b) DPNbV, HB, quarter. Blue lines for
15o-180o grain boundaries, green lines 5o-15o grain boundaries and red lines for 2o-5o grain boundaries. Stored Energy (SE) distribution maps of (c) DPV, HB, quarter, and (d) DPNbV, HB, quarter. ... 119 Figure 5.4.4. Stored Energy (SE) distribution maps of (a) DPV, 60% CR, (b) DPNbV, 60% CR, (c) DPV,
72% CR. The size of each image is 60µm×60µm. ... 121 Figure 5.4.5. Stored Energy (SE) distribution maps of (a) DPV, 60% CR, 740oC, 0s WQ, (b) DPVN, 60%
CR, 740oC, 0s WQ, (c) DPNbV, 60% CR, 740oC, 0s WQ, and (d) DPV, 72% CR, 740oC, 0s, WQ. The size of each image is 60µm×60µm. ... 123 Figure 5.4.6. The positive relationship between SE from sub-grain method and SE from IQ data (left); the
positive relationship between SE from sub-grain method and VHN (300g) hardness (right) ... 124 Figure 5.4.7. (a) shows the local volumes with SE higher than 8 J/cm3 in the microstructure of initial 72%
cold rolled steel, the size is 60x60 μm, and (b) illustrates the austenite found after heating to 760°C and water quenching immediately with no holding time. (c) and (d) are the SEM microstructures of DPVN with Galvannealing processing with nucleation of austenite at sub-grain boundaries in non-recrystallized ferrite ... 125 Figure 5.4.8. Tensile strengths (UTS) of DPV (60%CR and 72%CR) and DPVN with different Gleeble
processing, the steel IDs are the same as those listed in Table 5.4.4 ... 127 Figure 5.5.1 (a). Schematic diagram of hot rolling and cold rolling used for each type of steel in the
current study, RT means room temperature. (b). Simulated CGL heat treatments used in this study. Anneal D1 was the standard GI anneal while E1 (T=250oC), E2 (T=320oC) & E3 (T=390oC) were the anneals incorporating the new supercooled feature. Note: For Process D1:
Figure 5.5.2. Engineering stress-strain curves of DP steels with high Cr, Mo contents and standard galvanizing and supercool processing... 131 Figure 5.5.3. True stress-strain curves of DP steels with high Cr, Mo contents and standard galvanizing
and supercool processing ... 132 Figure 5.5.4. Tensile strength (UTS) of dual phase steels with standard galvanizing (D1) and supercool
processing, X=A is vanadium free, X=B is vanadium bearing, 1 represents high CT 650oC and 3 represents low CT 500oC. ... 134 Figure 5.5.5. Yield strength (YS) of dual phase steels with standard galvanizing (D1) and supercool
processing. ... 136 Figure 5.5.6. Total elongations (TE) of dual phase steels with standard galvanizing (D1) and supercool
processing. TEs were converted to 50mm (2 inch) standard gage length specimen. ... 137 Figure 5.5.7. YS/UTS ratios of dual phase steels with standard galvanizing (D1) and supercool
processing. ... 138 Figure 5.5.8. Comparison of SEM microstructures of dual phase steels with and without vanadium
addition, (a) 2A3A (vanadium free), (b)2B3A (with vanadium addition). The heat treatment is D1 (standard galvanizing processing) ... 142 Figure 5.5.9. Comparison of SEM microstructures of dual phase steels with high and low coiling
temperatures (CT), (a) 2A1E (CT=650oC, vanadium free), (b)2A3E (CT=500oC, vanadium free). The heat treatment is D1 (standard galvanizing processing) ... 142 Figure 5.5.10. Comparison of SEM microstructures of dual phase steels with high and low coiling
temperatures (CT), (a) 2B1E (CT=650oC, with vanadium), (b)2B3E (CT=500oC, with vanadium). The heat treatment is D1 (standard galvanizing processing) ... 143 Figure 5.5.11. Comparison of SEM microstructures of dual phase steels with and without vanadium
addition, (a) 2A3A (vanadium free), (b)2B3A (with vanadium addition). The heat treatment is E3 (supercool processing, supercool temperature 390oC) ... 143 Figure 5.5.12. Comparison of SEM microstructures of dual phase steels with high and low coiling
temperatures (CT), (a) 2B1A (CT=650oC, with vanadium addition, UTS=904MPa), (b)2B3A (CT=500oC, with vanadium addition, UTS=967MPa). The heat treatment is E1 (supercool processing, supercool temperature 250oC) ... 144 Figure 5.5.13. Comparison of SEM microstructures of dual phase steels with high and low coiling
temperatures (CT), high magnification showing fresh MA and tempered martensite, (a) 2B1A (CT=650oC, with vanadium addition), (b)2B3A (CT=500oC, with vanadium addition). The heat treatment is E1 (supercool processing, supercool temperature 250oC) ... 144 Figure 5.5.14. Comparison of SEM microstructures of dual phase steels with and without vanadium
addition, (a) 2A3A (vanadium free, UTS=919MPa), (b)2B3A (with vanadium addition, UTS=967MPa). The heat treatment is E1 (supercool processing, supercool temperature 250oC)
Figure 5.5.15. Comparison of SEM microstructures of dual phase steels with and with different cold rolling reductions, (a) 2A1E (50%CR, vanadium free, UTS=853MPa), (b)2A1A (80%CR, vanadium free, UTS=894MPa). The heat treatment is E1 (supercool processing, supercool temperature 250oC) ... 145 Figure 5.5.16. Steels with high Cr, Mo contents, vanadium free, high coiling temperature 650oC and
different cold rolling reductions; inverse pole figures (IPF) (a) 2A1C, hot band, (b) 2A1E, 50%CR, and (c) 2A1A, 80%CR; stored energy distribution mappings (d) 2A1C, hot band, average SE 0.90J/cm3, (e) 2A1E, 50%CR, average SE 2.86J/cm3, and (f) 2A1A, 80%CR, average SE 3.66J/cm3. The horizontal direction is the normal direction and the vertical direction is the transverse direction. ... 146 Figure 5.5.17. SEM microstructures of dual phase steels with high Cr, Mo contents, (a) (b) 2A1A, E2; (c)
(d) 2A1E, E2; (e) (f) 2B1A, E2; (g) (h) 2B1E, E2. ... 148 Figure 5.5.18. SEM microstructures of dual phase steels with high Cr, Mo contents, (a) (b) 2A3E, E2, (c)
(d) 2B3A, E2, (e) (f) 2B3E, E2 ... 149 Figure 5.5.19. SEM microstructures of (a) 2A1A, E3 (b) 2A1E, E3 (c) 2B1A, E3 and (d) 2B1E, E3, Low
magnification 2000x ... 150 Figure 5.5.20. SEM microstructures of (a) 2A1A, E3 (b) 2A1E, E3 (c) 2B1A, E3 and (d) 2B1E, E3, High
magnification 8000x ... 151 Figure 5.5.21. SEM microstructures of (a) 2A3A, E3 (b) 2A3E, E3 (c) 2B3A, E3 (d) 2B3E, E3, low
magnification 2000x ... 153 Figure 5.5.22. SEM microstructures of (a) 2A3A, E3 (b) 2A3E, E3 (c) 2B3A, E3 (d) 2B3E, E3, high
magnification 8000x ... 154 Figure 5.5.23. Volume fraction of martensite of high alloyed DPs with different Gleeble full processings. ... 154 Figure 5.5.24. Volume fraction of tempered martensite (TM) of high alloyed DPs with different Gleeble
full processings. ... 155 Figure 5.5.25. Inverse pole figures of hot band steels, vertical direction is RD, horizontal direction is ND.
(a) 2A1C, (b) 2A2C, (c) 2A3C, (d) 2B1C, (e) 2B2C and (f) 2B3C. black lines are the high angle (15o) grain boundaries. The IPF triangle describes the relationship between colors and orientations. ... 157 Figure 5.5.26. VHN of hot band steels with high Cr, Mo contents and different coiling temperatures ... 158 Figure 5.5.27. Nanohardness of ferrite and tempered martensite (TM) in 2A1E, 2A3E, 2B1E and 2B3E
with E1 processing ... 160 Figure 5.5.28. Distribution of ferrite grain size in 2A1E, 2A3E, 2B1E and 2B3E with E1 processing ... 162 Figure 5.5.29. Distribution of ferrite grain size in 2A1A, 2A3A, 2B1A and 2B3A with E1 processing . 164
Figure 5.5.30. Optical microstructures of (a) 2B1C, HB steel with coiling temperature 650oC, VHN(300g) 210±3 (b) 2B3C, HB steel with coiling temperature 500oC, VHN (300g) 278±6, 2% Nital etched
... 165
Figure 5.5.31. SEM micrographs near fracture surfaces, (a) 2B1A, D1, (b) 2B3A, D1 ... 166
Figure 5.5.32. SEM micrographs near fracture surfaces, (a) 2B1E, D1, (b) 2B3E, D1 ... 166
Figure 5.5.33. Fractured surfaces after tensile tests of (a) 2B3A, D1, (b) 2B3E, D1 ... 168
Figure 5.5.34. Fractured surfaces after tensile tests of (a) 2B1E, E1, (b) 2B3E, E1 ... 168
Figure 5.5.35. Hole expansion tested samples (a) 2A3A, D1, (b) 2A3E, D1, (c) high magnification image of the region inside the dashed square in (b), (d) 2B3A, D1, (e) 2B3E, D1, (f) high magnification image of the region inside the dashed square in (e). Vertical direction is the rolling direction ... 169
Figure 5.5.36. Microstructures near the hole edge punched or sheared of 2B3E, D1, before hole expansion test, (a) 350x, (b) 2000x, and (c) 8000x ... 172
Figure 5.5.37. Microstructures near the hole edge punched or sheared of 2B3A, E1, before hole expansion test, (a) low magnification and (b) higher magnification ... 173
Figure 5.5.38. Hole expansion tested samples (a) 2A1E, E1, (b) 2A3E, E1, (c) high magnification image of the region inside the dashed square in (b), (d) 2B1E, E1, (e) 2B3E, E1, (f) high magnification image of the region inside the dashed square in (e). Vertical direction is the rolling direction ... 173
Figure 5.5.39. Reduction in area (%RA) of dual phase steels with standard galvanizing (D1) and supercool processing (E1, E2 and E3). ... 174
Figure 5.5.40. Hole expansion ratios (HE%) of dual phase steels with standard galvanizing (D1) and supercool processing (E1, E2 and E3). ... 175
Figure 5.5.41. The data points were in Table 5.5.14 were plotted in 3D form. ... 177
Figure 5.5.42. (a) data points (UTS-HE) of high alloyed DPs, (b) averaged UTS values at three hole expansion ratio levels, 20-30%, 30-40% and 40-50%. ... 178
Figure 5.6.1. Engineering strain and stress curves of DP steels with low Cr, Mo contents and standard galvanizing and supercool processing... 179
Figure 5.6.2. True strain-stress curves of DP steels with low Cr, Mo contents and standard galvanizing and supercool processing ... 180
Figure 5.6.3. Tensile strength (UTS) of dual phase steels with standard galvanizing (D1) and supercool processing. ... 182
Figure 5.6.4. Yield strength (YS) of dual phase steels with standard galvanizing (D1) and supercool processing. ... 183
Figure 5.6.6. YS/UTS ratios of dual phase steels with standard galvanizing (D1) and supercool processing. ... 185 Figure 5.6.7. SEM microstructures of DP steels with low Cr, Mo contents, (a) 4A1A, D1, (b) 4A1E, D1,
(c) 4B1A, D1, (d) 4B1E, D1. ... 187 Figure 5.6.8. SEM microstructures of DP steels with low Cr, Mo and without vanadium addition, (a) (b):
4A1A, E1, (c) (d): 4A3A, E1, (e) (f): 4A1E, E1, (g) (h): 4A3E, E1. ... 188 Figure 5.6.9. (a) 4A3A, E3, (b) 4A3E, E3, (c) 4B3A, E3, (d) 4B3E, E3. Low magnification 2000x ... 189 Figure 5.6.10. (a) 4A3A, E3, (b) 4A3E, E3, (c) 4B3A, E3, (d) 4B3E, E3. High magnification 8000x .... 189 Figure 5.6.11. Volume fractions of martensite in low alloyed DPs with different Gleeble processings. . 192 Figure 5.6.12. The relationship between hole expansion ratio and heat treatments... 194 Figure 5.6.13. Hole expansion tested samples (a) 4A3A, D1, (b) 4B3A, D1, (c) high magnification image
of the region inside the dashed square in (b), (d) 4A3A, E1, (e) 4B3A, E1, (f) high magnification image of the region inside the dashed square in (e). Vertical direction is the rolling direction ... 195 Figure 5.6.14. (a) data points (UTS-HE) of low alloyed DPs, (b) averaged UTS values at four hole
expansion ratio levels, 35-40%, 40-45%, 45-50% and 50-55%. ... 196 Figure 5.7.1. IPFs (a) 2A1E, (c) 2A1A, (e) 2B1E, (g) 2B1A; SE mappings (b) 2A1E, (d) 2A1A, (f) 2B1E,
and (h) 2B1A. The IPF triangle describes the relationship between colors and orientations, and this triangle can be applied to all the IPFs in the following part of this thesis. ... 200 Figure 5.7.2. Inverse pole figures of (a) 2A3E, (b) 2B3E, (c) 2A3A and (d) 2B3A ... 200 Figure 5.7.3. Stored energy mapping of (a) 2A3E, (b) 2B3E, (c) 2A3A and (d) 2B3A. The size of each
image is 60μmx60μm ... 201 Figure 5.7.4. Inverse pole figures of (a) 4A1E, (b) 4B1E, (c) 4A1A and (d) 4B1A ... 203 Figure 5.7.5. Stored energy mappings of (a) 4A1E, (b) 4B1E, (c) 4A1A and (d) 4B1A, the size is
60μmx60μm ... 204 Figure 5.7.6. Inverse pole figures of (a) 4A3E, (b) 4B3E, (c) 4A3A, and (d) 4B3A ... 205 Figure 5.7.7. Stored energy mappings of (a) 4A3E, (b) 4B3E, (c) 4A3A, and (d) 4B3A, the size of each
image is 60μmx60μm ... 206 Figure 5.7.8. Tensile strength (UTS) of dual phase steels with standard galvanizing (D1) and supercool
processing. ... 209 Figure 5.7.9. Tensile strength (UTS) of dual phase steels with standard galvanizing (D1) and supercool
processing (E1, E2, and E3). The DPs with 80%CR are stronger than corresponding DPs with 50%CR. ... 210
line is fitted for DPs without vanadium using exponential function (TE% exp(-UTS)). (b) red line is linearly fitted for DPs with vanadium and black line is linearly fitted for DPs without vanadium. (c), (d) red solid, red dashed, black solid and black dashed lines are for 26000, 22000, 18000, 10000 UTSxTE (MPa x %) respectively. ... 211 Figure 5.7.11. Comparison of MA volume fraction vs UTS with the corresponding values obtained by
Davies. Only dual phase steels with high Cr, Mo and galvanizing (D1) processing are shown in the figure. ... 212 Figure 5.7.12. Comparison of UTS vs UE with the corresponding values obtained by Davies. . Only dual
phase steels with high Cr, Mo and galvanizing (D1) processing are shown in the figure. ... 212 Figure 5.7.13. Relationship between hole expansion ratios (HE%) and tensile strength (UTS), all the data
of 64 DP steels were included. ... 213 Figure 5.7.14. Relationship between hole expansion ratios (HE%) and heat treatment processing. ... 213 Figure 5.7.15. Post UE-HE data points for low alloyed and high alloyed steels with various conditions.
The black line is fitted by linear equation, PUE%=0.13xHE%+5.85, the coefficient of determination R2is 0.24, and the Pearson’s linear correlation coefficient ρ is 0.49. ... 215 Figure 5.7.16. Reduction in area (RA)-HE data points for low and high alloyed steels with various
conditions. The black lines were fitted by linear equations, (a) HE%=0.99xRA%-17.6, the coefficient of determination R2 is 0.6, and the Pearson’s linear correlation coefficient ρ is 0.76, the steels are with vanadium additions, (b) HE%=1.48xRA%-41.2, the coefficient of determination R2is 0.52, and the Pearson’s linear correlation coefficient ρ is 0.76, the steels with and without vanadium additions are all included. ... 215 Figure 5.7.17. Magnetic Field (in G) vs Moment/Mass (emu/g) curves of DPV, 72%CR supercooled
steels... 218 Figure 5.7.18. HRTEM images of DP 2B1E, E1 (50%CR, high CT 650oC), showing fine and dense VCx
precipitates in ferrite matrix. ... 223 Figure 5.7.19. (a) example showing the precipitation of nitrides, nitrogen-rich carbonitrides and carbides
in 0.10%V steels at various nitrogen contents, (b) chemical driving force, ΔGm/RT, for precipitation of VC and VN in 0.12%V steel[150]. ... 226 Figure 5.7.20. HRTEM images of VCx particles (a-c) in 2B1E (50%CR) cold rolled sheets (without heat
treatments), (d) is the EDX from the particles indicated by the arrow in (c). ... 227 Figure 5.7.21. Predicted results from JMatPro4.0 of 2B (vanadium bearing steel), (a) amount of
precipitates (M(C,N), M is alloying elements, AlN and MnS), (b) weight percent of different elements in M(C,N) and (c) contents of nitrogen in different phases (Austenite, ferrite, M(C,N) and AlN) at different temperatures at equilibrium states. ... 230 Figure 5.7.22. UE-n-value data points for low alloyed and high alloyed steels with various conditions (all
Figure 5.7.23. Work hardening ratios between engineering strain 0.2% and 0.5%, i.e. just after yielding of the steels, of the steels with high coiling temperatures 650oC, the sample IDs are listed in Tables 5.7.9 and 5.7.10 ... 235
Figure 5.7.24. lnσ-lnԑ curves of DPs with E1 processing. ... 237
Figure 5.7.25. lnσ-lnԑ curves of DPs with D1 and E1 processing. ... 240 Figure A1. LePera etched microstructures of DPV annealed at 780oC for (a) 1 minute (18±1%MA), (b) 2
minutes (37±2%MA), and (c) 5 minutes (39±3%MA) and then water quenched. ... 249 Figure A2. LePera etched microstructures of DPNbV annealed at 780oC for (a) 1 minute (47±2%MA), (b)
2 minutes (54±1%MA), and (c) 5 minutes (85±1%MA) and then water quenched. ... 250 Figure A3. LePera etched microstructures of DPVN annealed at 780oC for (a) 1 minute (34±2%MA), (b)
2 minutes (38±2%MA), and (c) 5 minutes (39±3%MA) and then water quenched. ... 250 Figure A4. LePera etched microstructures of DPNb annealed at 780oC for (a) 1 minute (51±2%MA), (b) 2
minutes (54±3%MA), and (c) 5 minutes (64±3%MA) and then water quenched. ... 250 Figure A5. DPV, Gleeble A3 (standard galvanizing processing), IQ image (up left) (red lines 2o-5o, green
lines 5o-15o, and blue lines 15o-180o), IPF mapping (up right), and IQ peak fitting curves (below). ... 251 Figure A6. DPNbV, Gleeble A3 (standard galvanizing processing), IQ image (up left) (red lines 2o-5o,
green lines 5o-15o, and blue lines 15o-180o), IPF mapping (up right), and IQ peak fitting curves (below). ... 252 Figure A7. DPVN, Gleeble A3 (standard galvanizing processing), IQ image (up left) (red lines 2o-5o,
green lines 5o-15o, and blue lines 15o-180o), IPF mapping (up right), and IQ peak fitting curves (below). ... 253 Figure A8. AlN found at the ferrite grain boundary for DP_NbV, GI (A3) standard galvanizing
ACKNOWLEDGEMENTS
The completion of this thesis would have never been possible without the help, support and assistance from so many kind persons. Here, I would like to give my most sincere thanks to them.
First and foremost, I would like to thank my advisor, Professor Anthony J. DeArdo for his great guidance and generous support throughout my research. His invaluable advices and suggestions make the whole research so well organized and directed. Secondly, I would like to thank my academic advisor Albert Chi Fu To for the help on courses.
I would like to thank Dr. Ken Goldman. He is a very kind and generous man and a great teacher in both research and language. His help makes so many things much easier.
Special thanks are due to Dr. Xiaojun Liang and Professor Mingjian Hua for their great help in the research, helpful discussions and suggestions. Special thanks are also extended to Victoria Wang, Juha Uusitalo, Bing Ma, Brendan Connolly, Junyu Duan, Petch Janbanjong, Cole Van Ormer, and Dr. Susheng Tan, for their generous and constant help on my experiments.
I would like to thank the Basic Metals Processing Research Institute (BAMPRI) and the Mechanical Engineering and Materials Science Department, University of Pittsburgh for providing the facilities to conduct this work. I would also like to thank Vanitec Ltd., London (The Vanadium International Technical Committee) for financially sponsoring this work, and the United States Steel Research and Technology Center for in-kind assistance. Their generous support is greatly appreciated. Special thanks are also due for helpful discussions to Dennis Haezebrouck, Research and Technology Center of United States Steel Corp. and Robert Glodowski of Everaz, PLC.
I would also like to thank the undergraduate group members of BAMPRI, e.g. Patrick Andrew Soloski, Michael O'Donnell, Mitchell Stephen Hrapchak, Katia Santos, Joseph J Hartle, Nicholas J Thimons, Joshua Taylor Barron, and Anthony E Analo for their help on my experiments.
Last but not least, I would like to thank my parents for their love, support and courage. Thank you all very much!
1.0
INTRODUCTIONConsidering the increasing pressure from energy-saving and ecological responsibility, the automobile industry has to find promising steels to produce fuel-efficient vehicles by reducing the weight of vehicles. The application of advanced high strength sheet steels is a good choice, since they show both high strength and good ductility, as well as they can also reduce the weight, optimize environmental performance and improve passenger safety, but still at affordable cost.
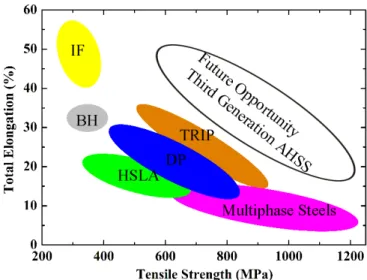
Today various types of steels are used in automotive industry. The comparison of some of these steels is depicted in Figure 1.1[1]. Interstitial-free (IF)[2] steels with carbon content less than 0.01wt.% are extensively used in automotive industries for making car outer panels because of the high formability that they possess. However the tensile strength level of IF steels is relatively low. In recent years, efforts have been made to improve the strength of IF steels, using solid solution hardening, precipitation hardening or by means of grain refinement through SPD (severe plastic deformation) procedures. Bake-hardening (BH)[3] steels are another class of forming steels with both good formability and high dent resistance used in automotive industry for outer panels. After forming and paint baking, they can offer high yield strength due to strain aging, which is the interaction between solute carbon and dislocations (formation of Cottrell atmospheres). However, as can be seen in Figure 1.1, both IF steels and BH steels have low tensile strength level compared with the other classes of steels.
Figure 1.1. Comparison of tensile strength and total elongation for different types of steels
Efforts between the global steel and automobile industries have developed the “Advanced High Strength Steels” (AHSS). AHSS steels are multi-phase steels, whose microstructure may contain a defined content of martensite, bainite and/or austenite. Compared with conventional high strength steels (HSS or HSLA steels) which are hardened by solid solution, precipitation or grain refinement, the AHSS steels are hardened principally by phase transformation. The AHSS include dual phase (DP) steels, transformation induced plasticity (TRIP) and complex multiphase (CPS) steels. Due to their superiority in strength and ductility combination as compared with conventional HSS, AHSS enable higher energy absorption during impact and ensure safety when reducing weight. The TRIP[4] steels with microstructure of ferrite, bainite and 5%~15% retained austenite possess high elongation and excellent sustainable work hardening ratio. The high ductility of this steel is the result of martensite formation from the retained austenite during deformation. High strength low-alloy (HSLA) steels are also used in automotive industries[5, 6], which usually contain 0.05~0.25% carbon content to retain formability and weldability. Compared with conventional HSLA, dual-phase steels (DP) exhibit better ductility as shown in Figure 1.1.
Advanced High Strength Steels (AHSS). The AHSS (Dual-Phase and TRIP) used in automobile is expected to reduce fuel consumption, improve safety, and increase recyclability, all at reasonable prices.
Since most forming operations in automobiles involve plane strain bending or stretch-forming, the ideal steels must have moderate yield strength to improve die life and good work hardening. In addition, candidate steels must also have good sheared edge ductility and an acceptable bake hardening response. The modern dual-phase steels (DP) satisfy these requirements. Due to its particular advantage in mechanical properties, dual-phase steels are promising candidate for bumper beams, motor compartment-longitudinal rails, rocker inners, and door inners, and so on.
Today, DP590 (590MPa, UTS) and DP780 (780MPa, UTS) are commercial realities, while DP980 (980MPa, UTS) and DP1180 (1180MPa, UTS) are still being investigated. Firstly, in this thesis, the DP steels at the 980 MPa level that have been microalloyed with Nb, V and V-N and have been processed using a Continuous Galvanizing Line (CGL) simulation on a Gleeble 3500 unit will be studied in detail. After final CGL processing, these steels exhibited UTS values between 900 and 1100 MPa, and total elongations (corrected for sub-sized gauge length) between 8 and 17%. Some factors, e.g., the dissolution of cementite, recrystallization behavior of cold rolled ferrite, intercritical annealing temperature, and cooling rates will be studied and discussed. Then the effects of vanadium on the softening resistance during extended holding at zinc pot temperature and the precipitation hardening of vanadium carbonitrides will be investigated.
Most steel companies producing DP steels usually cool the strip from the intercritical annealing temperature (IAT) to zinc-pot temperature (460oC), and then either cool the strip to RT or reheat it to 520oC and then cool to RT. The tensile strength is closely related to the amount of martensite in the final microstructure which is controlled by the amount of the austenite formed during intercritical annealing, which is a common first step in producing the DP steels. So understanding the formation of austenite during intercritical annealing is very important in optimizing the processing schedules and compositions
heating rate or reduction of cold rolling. Secondly, in this thesis, the effect of cold rolling will be emphasized, which is related to the stored energy.
The stored energy is associated with the lattice defects and can reflect the extent of the deformation of grains. It is thought to provide the initial driving force for recovery and recrystallization during the annealing process. In this work, it was also found that increasing the stored energy in the initial cold rolled samples can make the formation of austenite during intercritical annealing faster, resulting in more austenite after only 1 minute annealing at different IATs. The stored energy was estimated using sub-grain method from EBSD data, and cross checked with IQ data and hardness values in order to get reasonable stored energy values. 60% and 72% cold reductions were applied in order to get different initial conditions, and, therefore, with different starting stored energy we can study how the stored energy can affect the formation of austenite. The effects of higher stored energy of the cold band with higher cold reductions on the final properties after full CGL process simulation will be shown.
Finally, in the late part of this thesis, research will be conducted on aluminum killed, low carbon (0.1%) steels containing Mn, Cr, and Mo. The steels were produced with and without V and at high and low levels of Cr and Mo. The four steels were processed using four CGL simulations, one a conventional GA simulation and three others where the steels were supercooled to various temperatures below the zinc pot temperature prior to being heated to the galvanizing temperature of 460oC.
However, before different CGL processing paths can be discussed, it is very important that the cold rolled condition going into the CGL anneal be fully understood. This cold rolled condition is comprised of two factors: (i) the stored energy in the hot rolled coil and (ii) the increase in this stored energy due to cold rolling. Together, these two factors have a large influence on both the amount of austenite formed at 790oC, and the amount of fresh martensite found in the final microstructure. Higher stored energy means more and finer austenite formed in the anneal at 790oC, therefore lower coiling temperatures and higher cold reductions together promote higher amounts of intercritically formed austenite. These also refine the ferrite grain size, as well. Two levels of cold reductions (50% and 80%)
Moreover, high and low coiling temperatures will be used to investigate the effects of coiling temperatures on the precipitation hardening from vanadium carbonitrides.
After final CGL processing, these steels exhibited UTS values between 800 and 1050 MPa, and total elongations (corrected for sub-sized gauge length) between 15 and 35%. The microstructural observations and processing-microstructure-property relations will be presented, described and discussed.
2.0
BACKGROUND2.1 GENERAL DESCRIPTION OF DUAL-PHASE STEELS
Dual phase steels are characterized by a microstructure consisting of a dispersion of hard martensite particles in a soft, ductile ferrite matrix. There are two main phases, i.e., ferrite and martensite, in the microstructure essentially, although small amounts of bainite or retained austenite may also be present. According to some early researchers, it was postulated that the general dual-phase microstructure can be characterized as follows (Figure 2.1.1)[8]:
As in a duplex structure, the number of ferrite and martensite grains per unit volume is equal.
As in a dispersion structure, the second phase martensite forms isolated zones surrounded by ferrite.
Figure 2.1.1. Schematic representation of basic two-phase microstructure species
Due to this typical microstructure, dual phase steels possess a number of unique properties compared with ferrite-pearlite steels such as plain carbon steels or the HSLA steels, Figure 2.1.2[9]. The ferrite-pearlite steels have yield point elongation, and a high yield strength to ultimate tensile strength (YS/UTS) ratio. The dual phase steels have higher work hardening rates than conventional steels, a low 0.2 percent offset yield strength, high tensile strength, low yield strength to tensile strength ratio, continuous yielding behavior ( no yield point) and high uniform and total elongation. The low yield strength combined with the good uniform elongation of these steels gives them good formability, suitable for forming both outer panels and body-in-white components used in the automotive industries. Due to the high tensile strength, together with the high work hardening rates which provide high strength after forming, they have the potential for significantly improved crash performance. As a result, these steels are
Figure 2.1.2 Schematic stress-strain curves for plain carbon, HSLA, and dual phase steels. SAE 950X and 980X are Society of Automotive Engineers designations for HSLA steels of different strength levels. GM 980X is a General
Motors developed dual phase steel. GM 980[9]
There are mainly two ways to produce the dual-phase steels. The first method develops the dual phase microstructure in the hot band[10, 11]. The hardenability of the steel and the cooling rate are matched such that the ferrite forms during the cooling period between hot rolling and coiling while the martensite forms during coiling.
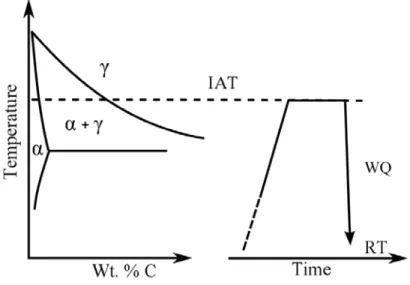
However, using the first method to produce dual-phase steels, it is difficult to get an optimum ratio of ferrite and martensite volume fraction since the transformation starts from a fully austenitic structure after hot rolling. Compared with the first method, the intercritical annealing method[12, 13] makes it much easier to control the volume fraction of martensite, since the transformation starts from a two
Figure 2.1.3 Schematic representation of intercritical annealing and water quenching (WQ) for developing dual phase structure, IAT means intercritical annealing temperature
From the Fe-C phase diagram, it is clear that at a low intercritical temperature, the carbon content in austenite is high, and the stability of austenite is high, but the volume fraction of austenite is low, while at a high intercritical temperature, the carbon content in austenite is low, and the stability of austenite is low, but the volume fraction of austenite is high according to the lever rule. Similarly, the carbon content in ferrite is higher at low intercritical temperature than that at high intercritical temperature. So the general idea to control the volume fraction of martensite in DP steel is to control the intercritical annealing temperature and the carbon content in the original steel. Usually, the volume fraction of martensite will be controlled around 20% to get a best combination of the mechanical properties[14], because earlier research found that the ductility and impact toughness degrade rapidly with increasing martensite amount above 25%. By reheating the material into the two phase region (α+γ) at some intercritical temperature and holding for some time, we can get proper amounts of ferrite and austenite. The austenite will be transformed into martensite during the subsequent cooling if the cooling rate is fast, e.g., water quenching. The cooling rate depends on the composition of the steel. It was found that the
Log CR(C/sec)= -1.73Mneq(%) +3.95 (2.1) Mneq(%)= Mn(%) + 1.3Cr(%) + 2.7Mo(%) (2.2)
2.2 MECHANICAL PROPERTIES OF DUAL-PHASE STEELS
The important factors that can influence the mechanical properties of dual-phase steels include the volume fraction of martensite, size and distribution of martensite, ferrite grain size, fine precipitates in the ferrite matrix, the morphology of ferrite and martensite, retained austenite, and so on[16-33]. Much research has been done in order to understand the effects of these factors on the mechanical properties of dual phase steels. Obviously, it is extremely complex and difficult to completely understand the microstructure-mechanical properties relationships in dual-phase steels.
R.G. Davies[21] investigated the relationship between flow stress (tensile strength and yield strength) and amount of martensite. In his research, the flow stresses were found to be mainly linearly related to percent martensite as shown in Figure 2.2.1. He also plotted the uniform elongation as a function of tensile strength as shown in Figure 2.2.2. As we can see, at a given strength level dual phase steels have superior ductility to standard HSLA steels, and the uniform elongation decreases with increasing tensile strength as can be expected.
Figure 2.2.1 The 0.2 pct flow stress and the tensile strength as a function of percent martensite for the Fe-Mn-C alloys[21]
Figure. 2.2.2 Uniform elongation as a function of tensile strength for standard HSLA steels and Fe-Mn-C dual phase steels[21]
2.2.1
Tensile strength and yield strength[C]tot=[C]m.xm+[C]f.(1-xm) (2.3) where xm is the volume fraction of martensite, [C]m,[C]f,[C]tot are carbon content(wt.%) in the martensite, ferrite and in the steel, respectively.
The same law of mixtures can be applied to ultimate tensile strength (UTS) and yield strength (YS) for simplicity:
(UTS)tot=(UTS)m.xm+(UTS)f.(1-xm) (2.4) (YS)tot=(YS)m.xm+(YS)f.(1-xm) (2.5) where (UTS)m and (UTS)f are the ultimate tensile strengths of the 100% martensite and ferrite phases respectively, while (YS)m and (YS)f are the yield strengths of the 100% martensite and ferrite phases, respectively.
However, the variation of ultimate tensile strength and yield strength with volume fraction of martensite is much more complex. Tamura et al.[35], found that equation (2.5) was obeyed only when the values of the yield strength of the martensite (YS)m and ferrite (YS)f were nearly the same, as in tempered dual-phase steels. They introduced another parameter called C, which is (YS)m/(YS)f. If C is less than 3, the law of mixtures was nearly obeyed, while if C is more than 3, the value of yield strength first increased linearly with the volume fraction of martensite and then deviated strongly from this linear relationship at some value of xm.
Speich and Miller[36] suggested that the (YS)m and (UTS)m in (2.4) and (2.5) may be replaced by (YS)m’ and (UTS)m’, where
(YS)m’=(YS)f+(1/3(YS)m-(YS)f)xm/100 (2.6) (UTS)m’=(UTS)f+((YS)m-(UTS)f)xm/100 (2.7) Equations 2.6 and 2.7 are a “modified law of mixtures”. The yield strength of martensite is related to the carbon content of the martensite phase, as follows[37]
(YS)m(MPa)=620+2585Cm (2.8) where Cm is the carbon content of the martensite phase in weight percent.
where ρf is the density of the ferrite, ρm is the density of martensite, Cf is the carbon content of the ferrite and Co is the carbon content of the steel. ρf/ ρm is approximately 1.025, or simply 1. If Co>>Cf, then we can simply use[14, 36]
Cm=100(Co/xm). (2.10)
2.2.2
Work hardeningThe work-hardening behavior of dual-phase steels can be simply described by the Hollomon equation[38], which is commonly used to analyze the work-hardening behavior of metallic materials,
σ = Kεn (2.11)
where σ and ε are the true stress and true strain, respectively, n is the work-hardening exponent and K is the strength coefficient. From the Considere’ condition[14, 39]
(dσ/dε) = σ (2.12) and assume this power law (2.11) is obeyed, it can be shown that
n= , (2.13)
where is the true uniform strain. The work of Davies[21] indicates that the uniform elongation (n value)
decreased in a nonlinear manner with increasing percent martensite. Speich and Miller[36] in addition, found that the uniform elongation increased slightly when the carbon content of the martensite phase was decreased. The empirical equation is
(2.14)
(2.15)
where and are the total elongation for the composite and for 100 percent ferrite, respectively.
The value of n can be obtained using a ln-ln plot of true stress and true strain, since equation (2.11) can be expressed as
ln σ = ln K + n ln ε (2.16)
However, a nonlinear variation of ln σ with ln ε can usually be observed, which may be due to
different stages of work hardening.
Some researchers suggested that work-hardening behavior in dual-phase steels occurred in three different stages[14, 36, 40, 41], which could be revealed by the Jaoul-Crussard(J-C) analyses[42-46]. The J-C analyses are based on the following equation:
σ = σo+Kεn (2.17)
where σo and εo are reference true stress and true strain, respectively. The equation (2.17) can be expressed as
ln( ) = ln K + ln n + (n-1) ln ε (2.18)
Analysis of the true stress-strain using equation (2.18) is referred to the J-C analysis, by using which several researchers have been able to reveal the three stages of work hardening in dual-phase steels. These stages of work hardening may be explained by the following deformation mechanisms[14, 36, 40, 41]:
(1) Stage I consists of homogeneous deformation of the ferrite matrix by the glide of mobile dislocations present near the martensitic regions.
(2) Stage II covers a diminished work hardening with constrained ferrite deformation and with possible transformation of retained austenite to martensite.
(3) Stage III consists of ferrite deformation with attendant cross-slip and dynamic recovery together with martensitic deformation.
However, some researchers, e.g., Jiang et al.[47], observed only two stages of work-hardening behavior in dual-phase steels containing a volume fraction of martensite larger than 0.3 using the modified J-C analysis.
The modified Crussard-Jaoult (C-J) analysis[48, 49] based on the Swift equation[50], which is known to best describe the work hardening behavior of dual phase steels, was used in this study. The Swift stress-strain relationship is expressed as
, (2.19)
where and are the true strain and true stress, respectively, m is the strain hardening exponent, and
and k are the material constants. When we differentiate the logarithmic form of Eq. (2.19) with respect to , we get
. (2.20)
The values of m can be obtained from the slope, (1-m) of the ln(dσ/dε) versus lnσ curves. From the
ln(dσ/dε) versus lnσ curves we can clearly see the different stages of work hardening behavior .
The instantaneous n-value can be defined as the slope of the stress-strain curve in its logarithmic form.
n(ε)= (2.21)
where ε is true strain, σ is true stress. The so defined differential n-value is independent of strain hardening laws.
2.2.3
DuctilityMost of the previous results on the ductility of dual-phase steels indicate that both uniform elongation and total elongation decease with the volume fraction of martensite (Vm)[21]. Many investigators suggest that the type of martensite dictates the ductility of dual-phase steels (twinned or lath) and conclude that a finer microstructure shows higher ductility. Great efforts have been made to develop an expression for uniform or total elongation in terms of the volume fraction of martensite. But no single expression can explain all the situations.
It is suggested that the lower values of the carbon content of the martensite phase favor higher ductility. Speich and Miller[36] argued that the lower carbon content of the martensite increased ductility because cracking of the martensite particle or decohesion of the martensite/ferrite interface then became more difficult. Rashid[51] argued that the improved ductility of ferrite-martensite steels in contrast to ferrite-pearlite steels was caused by the higher plasticity of the martensite phase. The distribution of the martensite must also influence ductility. Chains of martensite particles that are linked up may be detrimental to ductility because this may offer an easy crack propagation path through the ferrite matrix. So the uniformly dispersed, small martensite particles are desired in order to get high ductility.
Lowering the carbon content of the ferrite, as well as increasing the amount of epitaxial (“new”) ferrite can improve the ductility of dual phase steels. The retained austenite can also improve the ductility of the dual phase steels due to the transformation induced plasticity (TRIP) mechanism. Speich and Miller[36] argued that when large amounts of retained austenite were present and when the stability of the austenite is sufficient that transformation of retained austenite occurs late in the plastic deformation, then large effects on uniform elongation can be expected. However, small amounts of retained austenite and early transformation of the retained austenite can affect the ductility negligibly.